A.I.Driven TradersAI Model Trades for 20190612The entry and exit levels here are NOT derived from any specific indicator but are coming from our A.I. driven proprietary models.
This is an attempt at exploring the trading community here at TradingView and sharing our daily trading plans published at our site with the community here in the form a Pine Script - just starting and learning this platform. Please help point out any obvious errors or gotchas committed in the scripts. Thanks and have a great trading day!
**** The Trading Plan Published for today ****
>>>> Medium-Frequency Models: <<<<< For today, Wednesday 06/12, our medium-frequency models indicate using the 2895 as a pivot point - opening a long on a break above 2895, and opening a short on a break below 2895 (wait for a close on at least a five minute chart to determine the break), both sides with a 9-point trailing stop.
Note: For the trades to trigger, the breaks should occur during the regular session hours starting at 9:30am ET. By design, these models do NOT open any new positions after 3:45pm. Only one open position at any given time.
>>>>> Aggressive Intraday Models: <<<<< For today, Wednesday 06/12, our aggressive intraday models indicate going long on a break above 2892 or 2875 with an 6-point trailing stop, and going short on a break below 2887 or 2878 with an 8-point trailing stop.
Note: For the trades to trigger, the breaks should occur during regular session hours starting at 9:30am ET. Due to the intraday nature of these aggressive models, they indicate closing any open trades at 3:55pm and remaining flat into the session close. No opening of new positions after 3:45pm. Only one open position at any given time.
SPX (S&P 500 Index)

Kal’s MTF ADX Rangoli RollerKaly MTF ADX Rangoli Roller is a method/study for finding trending stocks, indexes and cryptocurrencies using two different data periods (10, 5) of ADX Overlap over different time-frames (10m, 1H, 4H, 1D, 1W, 1M). In the study, I used 5-Period ADX for all mentioned time-frames. You may use 10-Period ADX for lower time-frames especially 10m and 1H.
Sample Image of the pinescript code(at the end of this post) in Tradingview looks as follows:
Note: Kal's MTF ADX Rangoli Roller is the lower Plot. The upper plot is KAL’s ADX Overlap Technical Study with MACD Filter( )
Description:
----------------
In the study plot, the lowest row is 10m, row above is 1H, row above is 4H, then 1D, then 1W and highest row is 1M
Lime(Bright Green) dot implies Trending Uptrend for that time-frame (first phase)
Green dot implies Trending Uptrend for that time-frame (second phase near exhaustion)
Red dot implies Trending Downward for that time-frame (first phase)
Maroon dot implies Trending Downward for that time-frame (second phase near exhaustion)
Lime cross implies Strong Trending Uptrend for that time-frame (first phase)
Green cross implies Strong Trending Uptrend for that time-frame (second phase near exhaustion)
Red cross implies Trending Strong Downward for that time-frame (first phase)
Maroon cross implies Trending Strong Downward for that time-frame (second phase near exhaustion)
Yellow is ‘Squeeze On’ setting. During the squeeze period, the ADX signals are almost always ineffective. One may wait and watch over during this time. Once the Squeeze is released (i.e. no longer yellow), the trend corresponds to the color of the dots and crosses.
Black is CRSI Overbought condition for that time-frame. It’s best to wait and research for possibility of trend reversal because
1. Profit-booking/trimming happens after CRSI Overbought condition.
2. Large Short-sellers may take huge positions during this time pushing the stock prices up.
White is CRSI Oversold condition for that time-frame. It’s best to wait and research for possibility of trend reversal because
1. Profit-booking/trimming happens after CRSI Oversold conditions.
2. Large buyers may take huge positions during this time pushing the stock prices down.
I am a disabled man. Therefore, I am not able to write in detail here today. More Details will follow as time permits. Please let me know if I am missing anything…
Legal Disclaimer: I published here so I get replies from fellow viewers to educate myself and for my daily expenses. Hence, if anyone uses this script for making their decisions, I am not responsible for any failures incurred.
Safe Trading!
Kal Gandikota
PS: If you found this script interesting and edifying please follow and upvote.
PS2: Please kindly donate for my daily expenses (atleast as you would on streets) at the following addresses:
BTC Wallet: 1NeDC1GvpFa49DFLuT1v28ohFjqtoWXNQ5
ETH Wallet: 0x35e557F39A998e7d35dD27c6720C3553e1c65053
NEO Wallet: AUdiNJDW7boeUyYYNhX86p2T8eWwuELSGr
PS3: For more information on ADX and CRSI, please 'Google' or search here yourself.
PS4: This study is intended for research in creating automated Python Trading Systems using Pandas( steemit.com ).
Screenshots of the pinescript code looks as follows:
10minute Screenshot of Kal's MTF ADX Rangoli Roller (Above)
1 Hour Screenshot of Kal's MTF ADX Rangoli Roller (Above)
4 Hour Screenshot of Kal's MTF ADX Rangoli Roller (Above)
1 Day Screenshot of Kal's MTF ADX Rangoli Roller (Above)
1 Week Screenshot of Kal's MTF ADX Rangoli Roller (Above)
1 Month Screenshot of Kal's MTF ADX Rangoli Roller (Above)
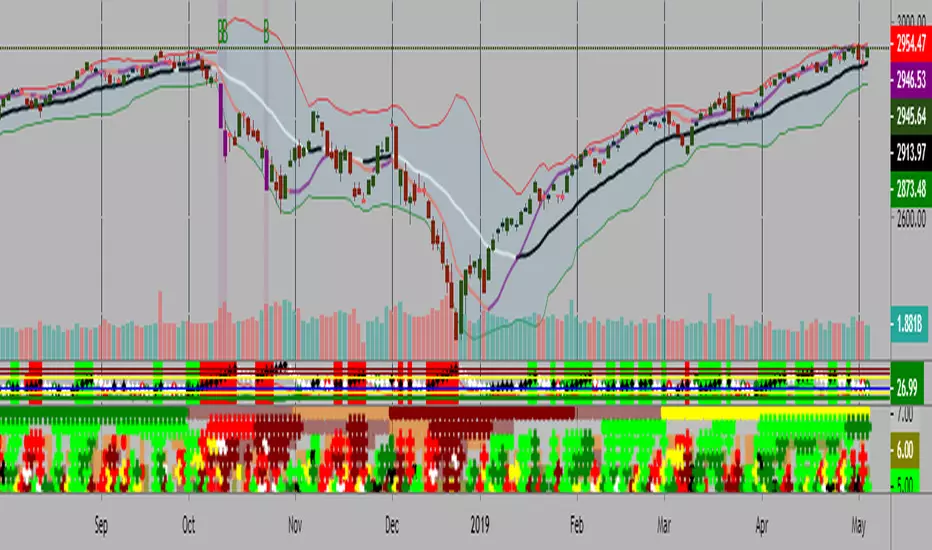
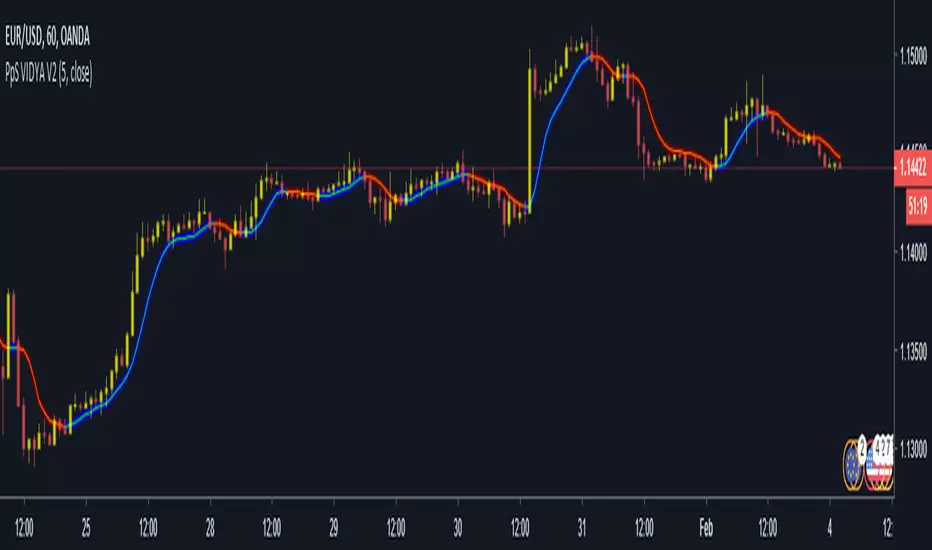
PpSignal Variable Index Dynamic Average V2The Moving Average is, perhaps, the most popular indicator in trading for a reason. Comparatively, the crossing average can tell you plenty about a trend, i.e. whether it’s broken or unbroken, changing or holding. But the Moving Average isn’t perfect; there is one area where it falls short and that is volatility. Even an Exponential Moving Average, which places more emphasis on the latest data, can miss the mark when it comes to a sudden change in volatility, rising or falling. Consequently, it can either give a fake signal or else generate a signal only when it is too late to trade on. Volatility is where the Variable Index Dynamic Average comes in, or VIDYA for short.
The Variable Index Dynamic Average or VIDYA was developed by Tushar Chande, and its focus is precisely on volatility. In other words, the VIDYA is an average that adjusts itself to changing volatility. When volatility is high, the VIDYA becomes more sensitive and when volatility is low, the VIDYA becomes less sensitive. That allows you to assess the trend according to current market conditions (and not irrelevant conditions that had earlier prevailed).
The VIDYA in Essence
The math behind the VIDYA formula is quite complicated, but the logic is not.
The VIDYA essentially has two components, the first being the Exponential Moving Average (aka EMA). The second indicator is in the “oscillator family” and it is known as the Chande Momentum Oscillator (aka CMO). Like most oscillators, the Chande Momentum Oscillator generates a signal of -100 and 100, with -100 being oversold and 100 overbought. The EMA is the anchor index, and the CMO’s job is to adjust the exponential average to volatility. The closer the CMO is to 100 or -100 the higher the volatility and the more sensitive our exponential average will turn. Conversely, the closer the CMO is to 0 the less sensitive our exponential average will turn. The final reading after the volatility adjustment is the VIDYA.
As you can see below, once you add the Variable Index Dynamic Average in MetaTrader you get a window with two parameters from which to choose: One is the Period CMO and the other is Period EMA. We can then decide which period the CMO will run on (and thus affect the sensitivity of our EMA) and which period the EMA will run on (to capture our trend). Usually, the best CMO to plug in is a third of the value of the EMA duration; this is to allow the latest change in volatility to impact to the greatest degree. If the CMO period is too long, it will likewise spread over the period too long and consequently fail to reflect current levels of volatility, thus defeating the VIDYA’s purpose.
VIDYA
Comparing the VIDA to the EMA
When we compare the two, we can see the clear advantages the VIDYA(Red) has over the EMA(Green). Both the VIDYA and the EMA run on a 30-week period, but the VIDYA is smoothed out by the Chande Momentum Oscillator running on a 10-week period (again, a third of the whole period). The VIDYA simply captures the trend much more accurately. We can see how, in Point A, when momentum weakens, the Variable Index Dynamic Average starts to flatten, while the EMA just moves across the price and fails to adjust.
This quality is especially beneficial when we want to get an indication if a trend has broken or not. The EMA, in this case, suggests the trend has, indeed, broken but when we look at the VIDYA we quickly get a more accurate picture. We can see that the downtrend has not been broken which allows us to prepare for another bearish round rather than mistakenly expect a rebound.
VIDYA
Of course, for every upside there is a downside and the downside of the VIDYA is that it becomes less effective on a very high duration, such as above 90. The Chande Momentum Oscillator cannot reflect sentiment very well when the duration ןד high and therefore it stops being effective at balancing the Exponential Moving Average within the Variable Index Dynamic Average. One way to tackle or mitigate this is to go higher in the intervals whenever possible, such as from days to weeks or weeks to months. Nonetheless, you should be cognizant of this in inherent weakness in the Variable Index Dynamic Average. Yet, despite that, the Variable Index Dynamic Average does a very effective job. If you are trading under volatile conditions and want to figure out if a trend is broken or set to continue, the Variable Index Dynamic Average could be the solution. When combined with other indicators of momentum, the VIDYA can give you the bigger, clearer picture.
www.onestepremoved.com
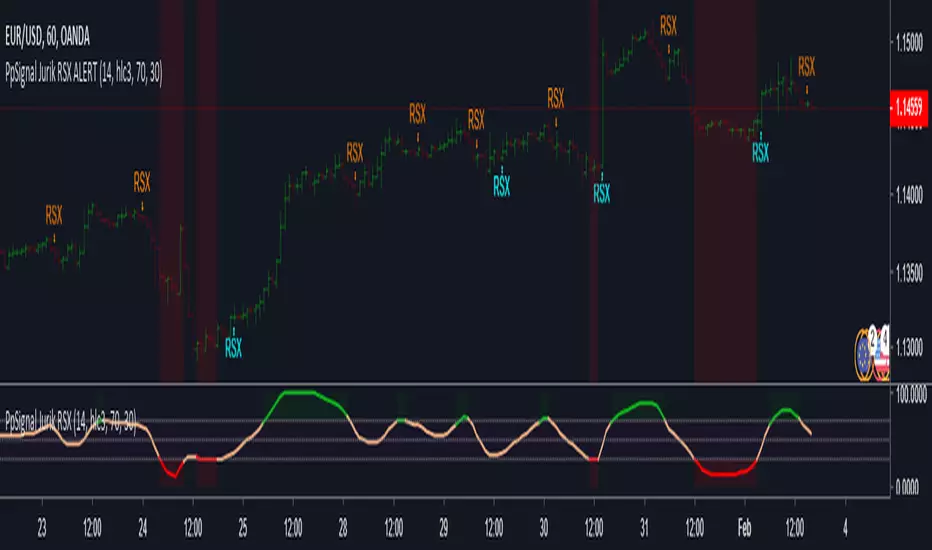
PpSignal Jurik RSXJurik RSX
Mark Jurik is a brilliant engineer and has done amazing work creating smooth, minimum lag indicators. I’ve bought a lot of his indicators and in fact I have used the Jurik Moving Average (JMA) to pre-process (smooth) data for the Better Sine Wave indicator. You can check out his website here.
emini-watch.com
www.jurikres.com
SPY SECTOR MONEY FLOW ANALYTICSSPY AND DJI SECTOR VOLUME ADVANCE AND DECLINE
THIS CONTAINS THE KEY CONSTITUENTS OF SPY AND DJI TO HELP TRADERS TO PROVIDE HOW UNDERLYING VOLUME AFFECTS THE REVERSAL

EMINI OPTIONS HighAccuracy Signal SystemThe SPX Options signal system is based on the Market Internals which ultimately drills down to its underlying stocks and their Movement
So a signal system is created which takes the key market Internals rather than just price alone.
In trading OPTIONS, your Direction earns you money along with Option Writing.
PARAMETERS TAKEN INTO ACCOUNT
1. Key Sector Stocks
2. NYSE TICK INDEX
3. UPVOL and DVOL
4. VIX Bands With Applied Gaussian Methodology
"PRICE OF SPX IS NOT TAKEN IN TO ACCOUNT IN THIS SIGNAL SYSTEM"
Understanding the signal system
1. Do not combine this signal system with any other indicators.
2. Greater than 75% success rate for 15 points in SPX .
Recommended time frames: 1 hour are highly recommended time frames.
But a risky trader can trade with 15 Mins because Market Internals support lower time frames. But trade cautiously and read the disclaimer carefully.
The signal system does not carry any recommendations and the signals are generated mathematically using the underlying MARKET INTERNALS LOGIC

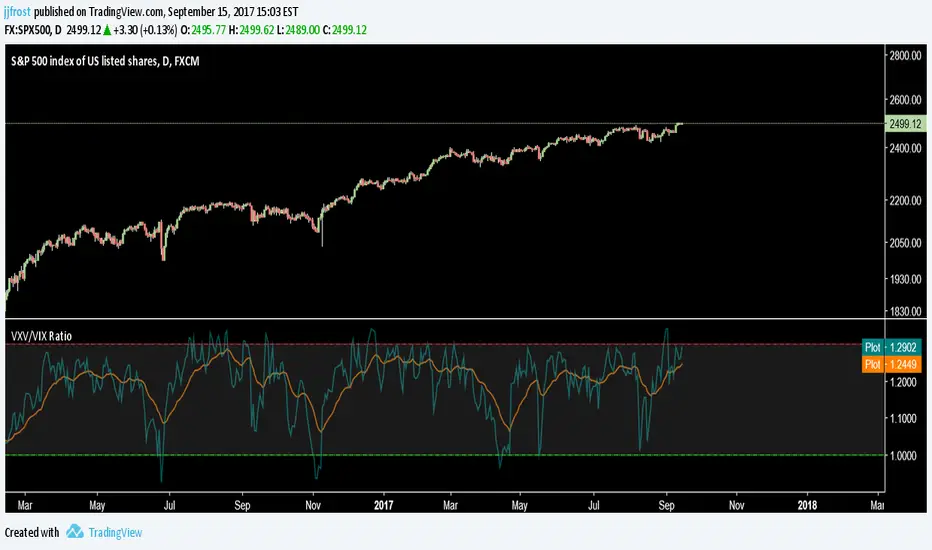
@WACC Volatility Weighted PUT/CALL Positions [SPX]This indicator is based on Volatility and Market Sentiment. When volatility is high, and market sentiment is positive, the indicator is in a low or 'buy state'. When volatility is low and market sentiment is poor, the indicator is high.
The indicator uses the VIX as it's volatility input.
The indicator uses the spread between the Call Volume on SPX/SPY and the Put Volume.
This is pulled from CVSPX and PVSPX.
When volatility and put/call reaches a critical level, such as the levels present in a crisis or a sell off, the line will be green. See Sept 2015, 2008, and Feb 2018.
This level can be edited in the source code.
As the indicator is based on Put/Call, the indicator works best on larger time frames as the put/call ratio becomes a more discernible measure of sentiment over time.

IV/HV ratio 1.0 [dime]This script compares the implied volatility to the historic volatility as a ratio.
The plot indicates how high the current implied volatility for the next 30 days is relative to the actual volatility realized over the set period. This is most useful for options traders as it may show when the premiums paid on options are over valued relative to the historic risk.
The default is set to one year (252 bars) however any number of bars can be set for the lookback period for HV.
The default is set to VIX for the IV on SPX or SPY but other CBOE implied volatility indexes may be used. For /CL you have OVX/HV and for /GC you have GVX/HV.
Note that the CBOE data for these indexes may be delayed and updated EOD
and may not be suitable for intraday information. (Future versions of this script may be developed to provide a realtime intraday study. )
There is a list of many volatility indexes from CBOE listed at:
www.cboe.com
(Some may not yet be available on Tradingview)
RVX Russell 2000
VXN NASDAQ
VXO S&P 100
VXD DJIA
GVX Gold
OVX OIL
VIX3M 3-Month
VIX6M S&P 500 6-Month
VIX1Y 1-Year
VXEFA Cboe EFA ETF
VXEEM Cboe Emerging Markets ETF
VXFXI Cboe China ETF
VXEWZ Cboe Brazil ETF
VXSLV Cboe Silver ETF
VXGDX Cboe Gold Miners ETF
VXXLE Cboe Energy Sector ETF
EUVIX FX Euro
JYVIX FX Yen
BPVIX FX British Pound
EVZ Cboe EuroCurrency ETF Volatility Index
Amazon VXAZN
Apple VXAPL
Goldman Sachs VXGS
Google VXGOG
IBM VXIBM

(JS) S&P 500 Volatility Oscillator For OptionsThe idea for this started here: www.tradingview.com with the user @dime
This should only be used on SPX or SPY (though you could use it on other things for correlation I suppose) given that the instrument used to create this calculation is derived from the S&P 500 (thank you VIX). There's a lot of moving parts here though, so allow me to explain...
First: The main signal is when Implied Volatility (from VIX) drops beneath Historical Volatility - which is what you want to see so you aren't purchasing a ton of premium on long options. Green and above 0 means that IV% has dropped lower than Historical Volatility. (this signal, for example, would suggest using a Long Call or Put depending on your sentiment)
Second: The green line running underneath zero is the bottom portion of the "Average True Range" derived from the values used to create the oscillator. the closer the bottom histogram is to the green line, the more "normal" IV% is. Obviously, if this gets far away from the line then it could be setting up nicely to short options and sell the IV premium to someone else. (this signal, for example, would suggest using something like a Bull Put Spread)
Third: The red background along with the white line that drops down below zero signals when (and how far) the IV% from 3 months out (from VIX3M) is less than the current IV%. This would signal the current environment has IV way too high, a signal to short options once again (and don't take any long option positions!).
Tried to make this simple, yet effective. If you trade options on SPX, SPY, even ES1! futures - this is a tool tailored specifically for you! As I said before, if you want you can use it for correlation on other securities. Any other ideas or suggestions surrounding this, please let me know! Enjoy!

Dollar / Stocks Correlation OscillatorMakes visual the theory that "a strong dollar is bullish for equities/stocks"
...but oh man, these two are definitely not that strongly correlated.
What's the deal with that? Still learning. Glad for any comments.

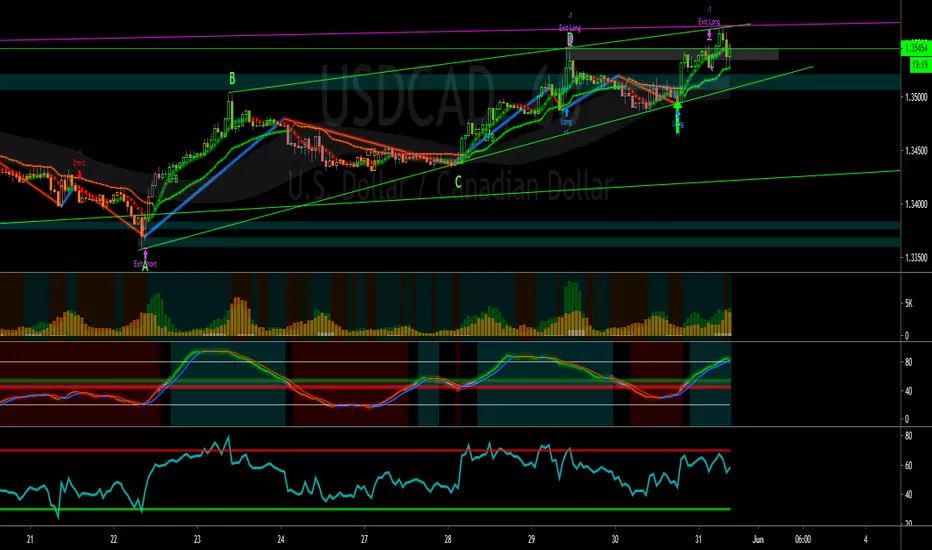
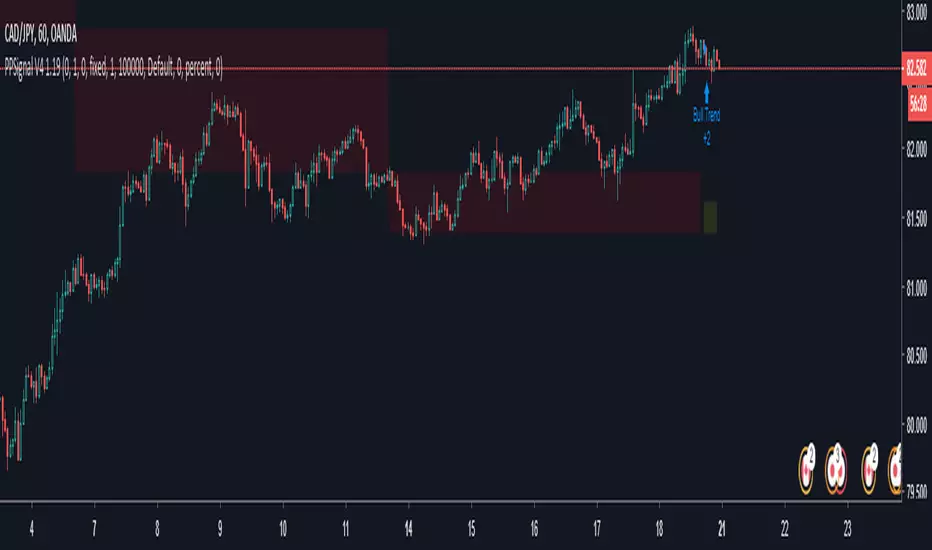
PPSignal System Algorithm Introduction
System Algorithm based on historical price probabilities and volumes. We recommend use financial stock, bond, crypts, indices, futures and Forex market (GBPUSD, EURUSD, USDJPY, USDCAD, AUDUSD, USOIL, XAUUSD, SOYUSD, DXY, SPY, SP1!, bitcoin) with defined trends above 50 or 100 and 200 simple moving averages idem if you want trade downtrend financial assets.
Use projections and retracements Fibonacci, MACD and RSI or Stoch oscillator and figures charters Head and shoulder, triangles and double bottom, double top, etc.
This system will notify you of the probability of success. The profit will be defined for yourself and according to your investor profile.
There are stocks and other assets with high returns but the system does not know exactly. Check in the Strategy tester section and then net profit.
We have other tools that support to PPsignal system, we will publish them shortly.
Define system parameters
As it is a system that is based on past data we recommend using the most historical data weekly (W) but you an use day historical data or 3 o 2 hs.
Candle color: you can choose if you want a trend color for candles or not, in the chart propieties menu detach the border option.
PPsignal it's a very simple system with which you will have a great support when it is a good time for enter in the marker and out.
we await your comments.
Eng. Oscar Alejandro Peruchena
Quants Mathematical and Market Analyst
Bollinger + RSI, Double Strategy Long-Only (by ChartArt) v1.2This strategy uses the RSI indicator together with the Bollinger Bands to go long when the price is below the lower Bollinger Band (and to close the long trade when this value is above the upper Bollinger band).
This simple strategy only places a long, when both the RSI and the Bollinger Bands indicators are at the same time in a oversold condition.
In this new version 1.2 the strategy was simplified even more than before by going long-only, which made the strategy more successful in backtesting than the previous version (that older version also opened short trades).
This strategy does not repaint and was updated to PineScript version 3.
All trading involves high risk; past performance is not necessarily indicative of future results. Hypothetical or simulated performance results have certain inherent limitations. Unlike an actual performance record, simulated results do not represent actual trading. Also, since the trades have not actually been executed, the results may have under- or over-compensated for the impact, if any, of certain market factors, such as lack of liquidity. Simulated trading programs in general are also subject to the fact that they are designed with the benefit of hindsight. No representation is being made that any account will or is likely to achieve profits or losses similar to those shown.
P.S. For advanced users: If you want also be able to short with the same strategy approach, then please use my older version 1.1:

S&P VIX & SKEW IndicatorUse this indicator to compare VIX, SKEW and yearly HIGH and LOW of the S&P 500. If three of those indicators are on a down trend, then the indicator changes to red color.

Bars Since VIX MedianBARS SINCE VIX17 Median by dime (v1.0 release) 04/02/2017
(Inspired by "Bars Since the last RSI Extreme" from DRodriguezFX)
This indicator is useful in tracking how many daily bars since the VIX was last at a historically 'normal' range.
Currently the VIX has been in a period of low volatility for a period of 98 daily bars since the VIX was last at the 17 historical median.

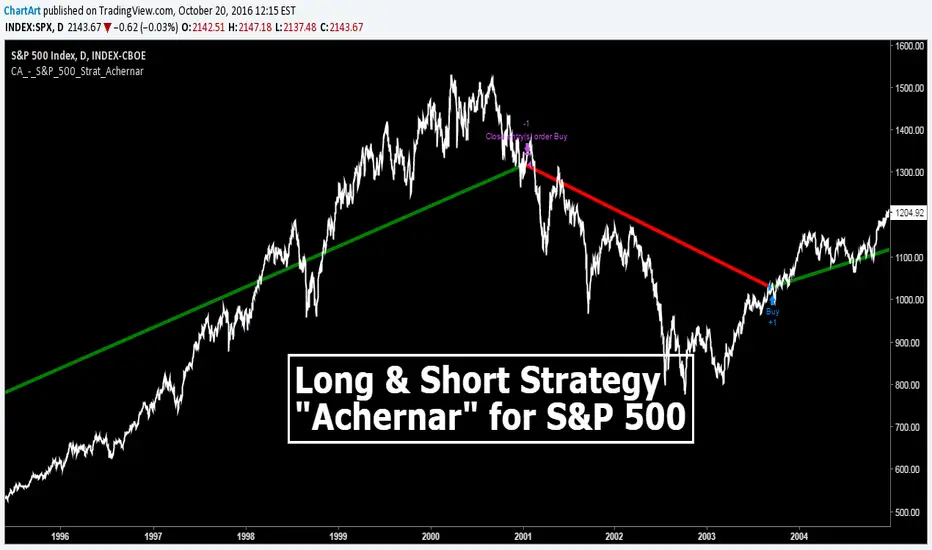
S&P 500 Long Only Investment Strategy, Achernar (by ChartArt)Here is my strategy with the working title "Achernar", which works best with the published default setting on the 'CBOE' 'S&P 500' daily chart. The strategy is intended for investments in long-term time-frames (the current average of the trades is a holding period of over 1000 days). The setting allows to use the 'CBOE' as price source (default) or the Tradingview TVC index, which uses a 'CFD' of the 'S&P 500' as price source. Please beware that there is a typo: This strategy does not go short, it closes the long trades and goes into cash instead, therefore this is a long only strategy.
If you don't want to lose all your money due to some random strategy you found on the Internet, here is a warning:
All trading involves high risk; past performance is not necessarily indicative of future results. Hypothetical or simulated performance results have certain inherent limitations. Unlike an actual performance record, simulated results do not represent actual trading. Also, since the trades have not actually been executed, the results may have under- or over-compensated for the impact, if any, of certain market factors, such as lack of liquidity. Simulated trading programs in general are also subject to the fact that they are designed with the benefit of hindsight. No representation is being made that any account will or is likely to achieve profits or losses similar to those shown.
P.S. The published script does not show the other trade entries on the screenshot above. Here is how the strategy looks like on the chart:
SPY Master v1.0This is a simple swing trading algorithm that uses a fast RSI-EMA to trigger buy/cover signals and a slow RSI-EMA to trigger sell/short signals for SPY, an xchange-traded fund for the S&P 500.
The idea behind this strategy follows the premise that most profitable momentum trades usually occur during periods when price is trending up or down. Periods of flat price actions are usually where most unprofitable trades occur. Because we cannot predict exactly when trending periods will occur, the algorithm basically bets money on all trade opportunities during all market conditions. Despite an accuracy rate of only 40%, the algorithm's asymmetric risk/reward profile allows the average winner to be 2x the average loser. The end result is a positive (profitable) net payout.
TRADING RULES:
Buy/Cover = EMA3(RSI2) cross> 50
Sell/Short = EMA5(RSI2) cross< 50
BACKTEST SETTINGS:
- Period = March 2011 - Present
- Initial capital = $10,000
- Dividends excluded
- Trading costs excluded
PERFORMANCE COMPARISON:
There are 657 trades, which means 1,314 orders. Assuming each order costs $2 (what I pay for at Interactive Brokers), total trading costs should be $2,628.
-SPY (buy & hold) = 132.73 ---> 193.22 = +45.57% (dividends excluded)
-SPY Master v1.0 = $12,649 - $2,628 = $10,021 = +100.21%
DISCLAIMER: None of my ideas and posts are investment advice. Past performance is not an indication of future results. This strategy was constructed with the benefit of hindsight and its future performance cannot be guaranteed.
