Squeeze Momentum Indicator Strategy [LazyBear + PineIndicators]The Squeeze Momentum Indicator Strategy (SQZMOM_LB Strategy) is an automated trading strategy based on the Squeeze Momentum Indicator developed by LazyBear, which itself is a modification of John Carter's "TTM Squeeze" concept from his book Mastering the Trade (Chapter 11). This strategy is designed to identify low-volatility phases in the market, which often precede explosive price movements, and to enter trades in the direction of the prevailing momentum.
Concept & Indicator Breakdown
The strategy employs a combination of Bollinger Bands (BB) and Keltner Channels (KC) to detect market squeezes:
Squeeze Condition:
When Bollinger Bands are inside the Keltner Channels (Black Crosses), volatility is low, signaling a potential upcoming price breakout.
When Bollinger Bands move outside Keltner Channels (Gray Crosses), the squeeze is released, indicating an expansion in volatility.
Momentum Calculation:
A linear regression-based momentum value is used instead of traditional momentum indicators.
The momentum histogram is color-coded to show strength and direction:
Lime/Green: Increasing bullish momentum
Red/Maroon: Increasing bearish momentum
Signal Colors:
Black: Market is in a squeeze (low volatility).
Gray: Squeeze is released, and volatility is expanding.
Blue: No squeeze condition is present.
Strategy Logic
The script uses historical volatility conditions and momentum trends to generate buy/sell signals and manage positions.
1. Entry Conditions
Long Position (Buy)
The squeeze just released (Gray Cross after Black Cross).
The momentum value is increasing and positive.
The momentum is at a local low compared to the past 100 bars.
The price is above the 100-period EMA.
The closing price is higher than the previous close.
Short Position (Sell)
The squeeze just released (Gray Cross after Black Cross).
The momentum value is decreasing and negative.
The momentum is at a local high compared to the past 100 bars.
The price is below the 100-period EMA.
The closing price is lower than the previous close.
2. Exit Conditions
Long Exit:
The momentum value starts decreasing (momentum lower than previous bar).
Short Exit:
The momentum value starts increasing (momentum higher than previous bar).
Position Sizing
Position size is dynamically adjusted based on 8% of strategy equity, divided by the current closing price, ensuring risk-adjusted trade sizes.
How to Use This Strategy
Apply on Suitable Markets:
Best for stocks, indices, and forex pairs with momentum-driven price action.
Works on multiple timeframes but is most effective on higher timeframes (1H, 4H, Daily).
Confirm Entries with Additional Indicators:
The author recommends ADX or WaveTrend to refine entries and avoid false signals.
Risk Management:
Since the strategy dynamically sizes positions, it's advised to use stop-losses or risk-based exits to avoid excessive drawdowns.
Final Thoughts
The Squeeze Momentum Indicator Strategy provides a systematic approach to trading volatility expansions, leveraging the classic TTM Squeeze principles with a unique linear regression-based momentum calculation. Originally inspired by John Carter’s method, LazyBear's version and this strategy offer a refined, adaptable tool for traders looking to capitalize on market momentum shifts.
Sqzmom

Momentum Trend [MT]The Momentum Trend indicator is an innovative technical analysis tool designed to capture and visualize momentum trends in financial markets. This advanced indicator goes beyond traditional momentum measures, offering a unique perspective on price action and trend strength.
Core Functionality:
Trend Momentum Index (TMI) Calculation:
At the heart of this indicator is the Trend Momentum Index (TMI), a proprietary algorithm that combines moving averages with price action analysis to gauge momentum. The TMI is calculated using a user-defined source, length, and moving average type.
Dynamic Trend Visualization:
The indicator uses a color-coded column plot to represent the TMI values, providing an intuitive visual representation of trend strength and direction. The colors change based on specific conditions, offering instant insights into the current market state.
Adaptive Momentum Analysis:
The TMI adapts to changing market conditions by comparing current values to historical ones, allowing for a more nuanced understanding of momentum shifts.
Key Inputs and Their Significance:
TMI Source:
Allows users to select the price data for TMI calculations. The default is the closing price, but users can choose alternative sources for different analytical perspectives.
TMI Length:
Defines the lookback period for the TMI calculation. The default of 8 provides a balance between responsiveness and stability, but users can adjust this to suit their trading style.
Moving Average Type:
Users can select from various moving average types (SMA, EMA, SMMA, WMA, VWMA) for the base calculation, allowing for customization based on trading preferences.
What Makes It Unique:
Comprehensive Momentum Analysis:
The TMI combines elements of trend following and momentum, providing a more holistic view of market dynamics than traditional momentum indicators.
Multi-Faceted Trend Identification:
The color-coding system doesn't just show bullish or bearish trends, but also identifies accelerating and decelerating momentum in both directions.
Flexible Moving Average Integration:
The ability to choose different moving average types allows traders to fine-tune the indicator's responsiveness and smoothness.
Visual Clarity:
The column-style plot with color changes offers clear, at-a-glance insights into trend strength and direction.
Momentum Comparison Logic:
The indicator incorporates logic to compare current momentum changes with recent historical changes, providing context for the current market state.
The Momentum Trend indicator represents a sophisticated approach to momentum and trend analysis. By combining moving averages, price action, and comparative momentum logic, it offers traders a powerful tool for identifying potential trend continuations, reversals, and momentum shifts.
This indicator is particularly valuable for traders looking to:
- Identify the start of new trends
- Spot potential trend reversals
- Gauge the strength of ongoing trends
- Time entries and exits based on momentum shifts

TL_Strategy [APIDEVs]TL_STRATEGY:
The TL_STRATEGY , is a whole ecosystem of indicators that make up a quite powerful and famous strategy in cryptocurrency trading, it is composed of the following indicators:
• Exponential moving media bands (10 and 55).
• Squeeze Momentum indicator (SQZMON PRO +).
• Volume profile (VP Developed by APIDEVs).
• Average directional index ( ADX PRO +).
In ApiDev , we decided to visually optimize this strategy, that is why we created an information panel that shows the joint projection of all the indicators that we already mentioned.
IMPROVEMENTS MADE IN THE STRATEGY:
Simpler: We simplified the interface of all indicators [so that the trader can follow the ABCs of his strategy without much complication.
Buy and sell signals: Based on a strategy that incorporates two moving averages of 10 and 55 periods, the observation of the strength of the ADX and the directionality of the oscillators of the SQZMON, signals of buying and selling to be valued by the trader.
Side panel: We integrate a side panel that allows observing the assessment and direction of all the indicators that make up the strategy.
It has an alert system that will send notifications about the changes that occur in the indicator.

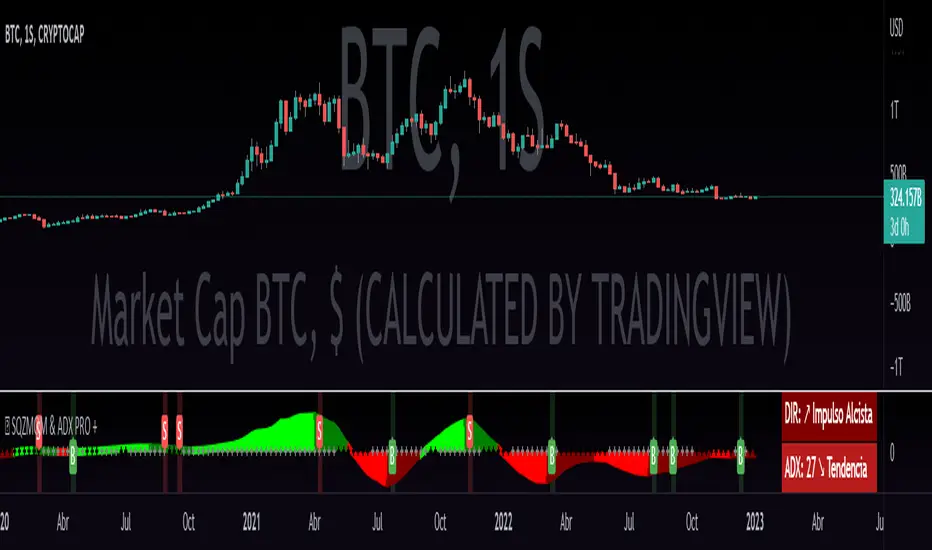
QZMOM & ADX PRO+The Momentum Squeeze Indicator is a momentum oscillator that indicates how explosively the price will move. Its first known version was called "TTM Squeeze" by John Carter explained in his book "Mastering the Trade" (chapter 11) and popularized in TradingView by a developer named LazyBear.
The black crosses on the center line show that the market has just entered a consolidation. This means low volatility, the market is preparing for an explosive move (up or down). The gray crosses mean the "Squeeze". Carter suggests waiting until the first gray after a black cross and taking a position in the direction of the oscillator. For its part, LazyBear recommends using an additional indicator such as ADX to improve the effectiveness of entry points and position closures.
Oscillator understanding improvements:
During the indicator creation process we were able to better understand the logic of the oscillator and based on that knowledge we implemented improvements.
Oscillator development improvements:
Side panel:
The ADX algorithm was incorporated, which is displayed numerically on the right panel of the indicator, shows the value of ADX and its directionality.
Added an arrow pointer to indicate oscillator directionality.
Two exponential moving averages of 11 and 55 periods have been added to the right panel, this will mark if the trend is bullish or bearish depending on the crossover of the EMAs.
An indicator of the Indicator Squeeze was also included, which marks the periods of price consolidation (OFF) and the periods in which the price should react explosively.
Added a feature that allows automatic color changing of the panels based on the color of the oscillator and the ADX.
o ADX: Dark green (bullish force).
o ADX: Light green (loss of bullish strength).
o ADX: Dark red (bearish force).
o ADX: Light red (loss of bearish strength).
o ADX: Orange (loss of strength, disinterest and low volume).
Signs:
A very famous strategy that we have learned is that of the trading expert Jaime Merino, who by combining the Momentum Squeeze Indicator and a ADX común, logró vincular eficientemente la debilidad del ADX con el inicio de un momentum alcista o bajista. La parametrización de su estrategia se señaló en alertas de compra y venta, que se representan de la siguiente manera:
B (Comprar): se activa cuando un movimiento bajista marcado por el ADX (pendiente negativa) termina y el oscilador toma direccionalidad alcista (impulso alcista).
S (Vender): se activa cuando un movimiento alcista marcado por el ADX (pendiente negativa) termina y el oscilador toma direccionalidad bajista (momentum bajista).
Filter:
To prevent any trader from trading against the trend, a filter was added that limits bearish entry alerts when the trend is up and vice versa, that is, when the EMA 10 is above the EMA 55, it is understood that the trend is up in that time frame, therefore bearish entry alerts will not be triggered. It will be the decision of each trader to activate or deactivate this function.
Alerts:
This is without a doubt the most awaited function for all Latin American traders, (Just kidding), but being aware, I am very proud of the implementation of alerts for each improvement made to this indicator, if you decide to use the Momentum Squeeze Indicator you can automate alerts for the following actions:
Buy and sell alerts.
Alerts to activate the Squeeze to (ON).
Oscillator quadrant change alerts
or bullish momentum.
or bearish momentum.
o Bullish force.
o Bearish force.
Recommendations:
One of the things that became clearer in the development of this indicator is the coloring of the dials, which is why we recommend the use of four colors, one for each oscillator grid.
ADX_OSCILLATOR [APIDEVs]ENGLISH:
ADX (ORIGINAL VERSION)
The ADX Indicator (Average Directional Index), is a non-directional oscillator type indicator, that is, it quantifies the strength of a trend regardless of its direction. In its original version, it is made up of 3 lines that represent the direction and strength of the movement:
• A line representing the ADX indicator.
• A green line representing the bullish Direction Index (DI +).
• A red line representing the Bearish Direction Index (DI-).
When the ADX is greater than 35, the market is in a strong trend, when it is between 35 and 20 the market is in trend and when it is less than 20 it indicates that the market is in range.
ADX OSCILLATOR (OUR VERSION)
At APIDEVs we really care about improving the understanding and experience of our users, which is why, in response to multiple requests, we decided to make important modifications to the ADX, which we consider to be the most powerful indicator of strength.
For many traders it was really confusing to understand that the ADX could be bullish or bearish and at the same time have the same numerical values, so in our version of the “ADX PRO +” we added colors and different intensity levels for your better understanding, however. , many needed a more explicit indicator and it is based on this request that we decided to take a leap into the incredible and that is how the “ADX OCILLATOR” was born.
We convert the ADX into a trend oscillator, now simpler and with multiple advantages which we will proceed to list:
1. The ADX was transformed into a directional oscillator whose color is based on the crossing of (DI +) and (DI-). This modification opens the door to the replacement of the Squeeze Momentum Indicator (SQZMOM) as a directional complement to the ADX.
2. A Background was added that is activated exclusively when the market has a strong upward or downward trend, specifying through its colors and intensity the type and direction of the force.
3. The original ADX parameters were adjusted to almost eliminate completely the “no trend” condition. This condition only created confusion for traders.
4. Added a system of signals based on the direction of the oscillator and the strength of the ADX.
• When the oscillator is sloping up and the ADX is green, the LONG (L) signal is activated.
• When the oscillator slopes downward and the ADX is red, the SHORT (S) signal is activated.
5. A side panel has been enabled that visually expresses the numerical value and direction of the ADX, as well as the direction of the oscillator.
6. An alert system was enabled so that traders receive notifications on all their devices:
• It is activated when the ADX changes color.
• It is activated when the Oscillator crosses the 0 point.
• It is activated when any input signal is activated.
---------------------------SPANISH --------------------------------
ADX OSCILLATOR:
ADX (VERSIÓN ORIGINAL)
El Indicador ADX (Average Directional Index), Es un indicador de tipo oscilador no direccional, es decir, cuantifica la fuerza de una tendencia independientemente de su dirección. En su versión original está compuesto por 3 líneas que representan la dirección y la fuerza del movimiento:
1. Una línea que representa el indicador ADX.
2. Una línea verde que representa el Índice de Dirección alcista (DI+).
3. Una línea roja que representa el Índice de Dirección bajista (DI-).
Cuando el ADX es mayor a 35, el mercado está en fuerte tendencia, cuando está entre 35 y 20 el mercado esta en tendencia y cuando es menor a 20 indica que el mercado está en rango.
ADX OSCILLATOR (NUESTRA VERSIÓN)
En APIDEVs realmente nos preocupamos por mejorar la comprensión y experiencia de nuestros usuarios, es por ello por lo que atendiendo a múltiples solicitudes decidimos realizar importantes modificaciones al ADX, el cual consideramos como el más potente indicador de fuerza.
Para muchos traders era realmente confuso entender que el ADX podía ser alcista o bajista y al mismo tiempo tener los mismos valores numéricos, así que en nuestra versión del “ADX PRO+” le añadimos colores y diferentes niveles de intensidad para su mejor comprensión, sin embargo, muchos necesitaban un indicador más explícito y es en base a esta solicitud que decidimos dar un salto a lo increíble y es así como nació el “ADX OCILLATOR” .
Convertimos el ADX en un oscilador de tendencia, ahora más simple y con múltiples ventajas las cuales procederemos a enumerar:
1. Se transformó el ADX en un oscilador direccional cuyo color esta basado en el cruce del (DI+) y el (DI-). Esta modificación abre la puerta al remplazo del Squeeze Momentum Indicator (SQZMOM) como complemento direccional del ADX.
2. Se añadió un Background que se activa exclusivamente cuando el mercado posee una fuerte tendencia alcista o bajista, Especificando a través de sus colores e intensidad el tipo y dirección de la fuerza.
3. Se ajustaron los parámetros del ADX original para eliminar casi en su totalidad la condición de “no haber tendencia” esta condición solo creaba confusión en los traders.
4. Se añadió un sistema de señales basados en la dirección del oscilador y la fuerza del ADX.
• Cuando el oscilador tiene la pendiente alcista y el ADX está en verde, se activa la señal de LONG (L).
• Cuando el oscilador tiene la pendiente bajista y el ADX está en rojo, se activa la señal de SHORT (S).
5. Se habilitó un panel lateral que expresa visualmente el valor numérico y la dirección del ADX, así como también la dirección del oscilador.
6. Se habilito un sistema de alertas para que los traders reciban notificaciones en todos sus dispositivos:
• Se activa cuando el ADX cambia de color.
• Se activa cuando el Oscilador cruza el punto 0.
• Se activa cundo se activa alguna señal de entrada.

TradingLatino_StrategySPANISH:
TL_STRATEGY:
El TL_STRATEGY, es todo un ecosistema de indicadores que conforman una estrategia bastante potente y famosa en el trading de criptomonedas, está compuesta por los siguientes indicadores:
• Bandas de medias móviles exponenciales (10 y 55)
• Squeeze Momentum Indicator (SQZMON PRO+).
• Volume Profile (VP Desarrollado por APIDEVs).
• Average Directional Index ( ADX PRO+).
En ApiDev, decidimos optimizar visualmente esta estrategia, es por ello que creamos un panel informativo que muestra la proyección conjunta de todos los indicadores que ya mencionamos.
MEJORAS REALIZADAS EN LA ESTRATEGIA:
Más simple: Simplificamos la interfaz de todos los indicadores [para que el operador pueda seguir el ABC de su estrategia sin mucha complicación.
Señales de compra y venta: Basado en una estrategia que incorpora dos medias móviles de 10 y 55 periodos, la observación de la fuerza del ADX y la direccionalidad de los osciladores del SQZMON, señales de compra y venta para ser valorado por el comerciante.
Panel lateral: Integramos un panel lateral que permite observar la valoración y dirección de todos los indicadores que componen la estrategia.
Tiene un sistema de alerta que enviará notificaciones sobre los cambios que se produzcan en el indicador.
ENGLISH:
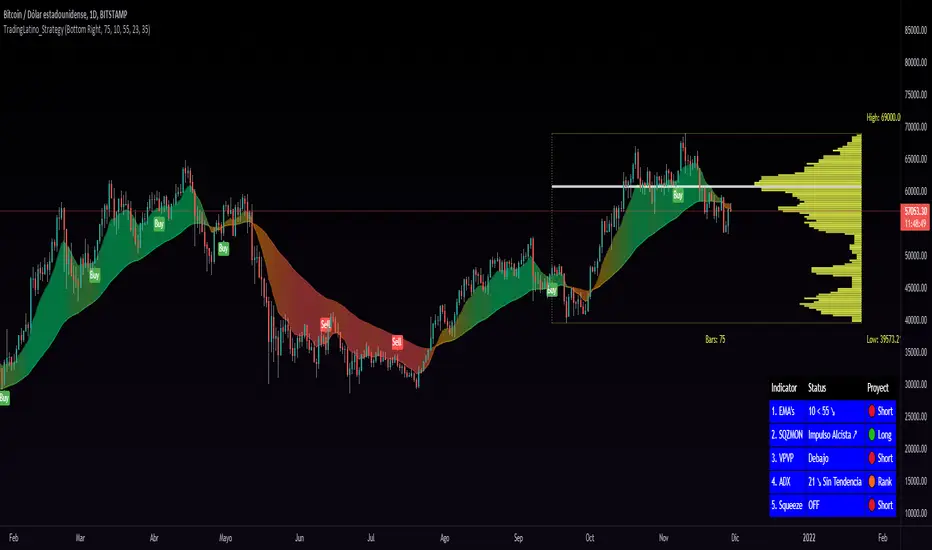
TL_STRATEGY:
The TL_STRATEGY , is a whole ecosystem of indicators that make up a quite powerful and famous strategy in cryptocurrency trading, it is composed of the following indicators:
• Exponential moving media bands (10 and 55).
• Squeeze Momentum indicator (SQZMON PRO +).
• Volume profile (VP Developed by APIDEVs).
• Average directional index ( ADX PRO +).
In ApiDev , we decided to visually optimize this strategy, that is why we created an information panel that shows the joint projection of all the indicators that we already mentioned.
IMPROVEMENTS MADE IN THE STRATEGY:
Simpler: We simplified the interface of all indicators [so that the trader can follow the ABCs of his strategy without much complication.
Buy and sell signals: Based on a strategy that incorporates two moving averages of 10 and 55 periods, the observation of the strength of the ADX and the directionality of the oscillators of the SQZMON, signals of buying and selling to be valued by the trader.
Side panel: We integrate a side panel that allows observing the assessment and direction of all the indicators that make up the strategy.
It has an alert system that will send notifications about the changes that occur in the indicator.
Panel Oscillator EXTENGLISH :
The PanelOscillatorETX is a very useful extension for traders who use the PowerOscillatorMTF indicator, since it allows to have a multitemporal vision of the mentioned indicator in a single glance. In the same way, it has a built-in PanelTest that reacts when the mouse is superimposed over a candle, which will allow you to see in a small panel the multi-temporal forces that made the price move at any point in the market. If you want to know how this indicator works, please visit the link on our website found in the direct access buttons, or in the AUTHOR INSTRUCTIONS box.
ESPAÑOL :
El PanelOscillatorEXT , es una extensión muy útil para los trader que usan el indicador PowerOscillatorMTF , ya que permite tener una visión multitemporal del mencionado indicador en una sola mirada. De igual forma posee integrado un PanelTest que reacciona cuando el mouse se sobrepone por encima de una vela, lo cual te permitirá ver en un pequeño panel las fuerzas multitemporales que hicieron que el precio se moviera en cualquier punto del mercado. Si deseas conocer como funciona este indicador, por favor visita el enlace de nuestra página web que se encuentra en los botones de acceso directo, o en la caja de INSTRUCCIONES DEL AUTOR .

Power Oscillator MTF
Power Oscillator MTF
ENGLISH:
At ApiDevelopers, we develop solutions for traders , these indicators are built based on effective strategies that we learn from some profitable traders or historically effective strategies.
This time we present the Power Oscillator MTF indicator. This is a multitemporal indicator based on the Squeeze Momentum Indicator (SQZMON) and the Elliot Waves , which allows you to see in a single graph the main and secondary waves that move the market, it is a reality that the market moves by waves, in fact it is the largest and oldest truth that exists in financial markets, but no one had been able to create an indicator that would allow us to see the fluctuations of those waves and understand how they affect the direction of the market, we at ApiDev achieve it and bring it to you. If you want to access this indicator and see how it works, understand how the side panel calculates the strength of the market and if you want to know the advanced alert system it has, please visit the link of our website found in the access buttons direct, or in the AUTHOR INSTRUCTIONS box.
ESPAÑOL:
En ApiDevelopers, desarrollamos soluciones para traders , estos indicadores los construimos en base a estrategias efectivas que aprendemos de algunos trader rentables ó de estrategias históricamente efectivas.
En esta oportunidad les presentamos el indicador Power Oscillator MTF. Este es un indicador multitemporal basado en el Squeeze Momentum Indicator (SQZMON) y las Ondas de Elliot , el cual te permite ver en una sola grafica las ondas principales y secundarias que mueven el mercado, es una realidad que el mercado se mueve por ondas, de hecho es la verdad más grande y antigua que existe en los mercados financieros, pero nadie había podido crear un indicador que permitiera ver las fluctuaciones de esas ondas y entender como estas afectan la dirección del mercado, nosotros en ApiDev lo logramos y lo traemos para ti. Si deseas acceder a este indicador y ver cómo funciona, entender cómo el panel lateral calcula la fuerza del mercado y si deseas conocer el sistema de alertas avanzado que posee, por favor visita el enlace de nuestra página web que se encuentra en los botones de acceso directo, o en la caja de INSTRUCCIONES DEL AUTOR.

TopTenAlgo 10. SQZMOM Algorithmic Strategy with Alerts & SignalsEN: This Algorithm is a derivative of John Carter's "TTM Squeeze" volatility indicator. Many strategists have taken the indicator on Tradingview with simple moving averages and have looked at the biggest mistake only by dealing with squeeze and exit processes to squeeze. But I used the algorithm to determine where the markets would actually explode. For example, instead of using SMAs , I tested them on the Linear Regression Curve using Volume Weighted Moving Averages and Hull MAs. This gave me the opportunity to develop a more responsive algorithm and identify where the actual explosion would occur. The Gray Circles in the midline show that the market is entering a new jam (in the Bollinger Bands and Keltner Channel). This means low volatility , the market prepares itself for an explosive move (up or down). White Circles mean that it is about to get out of the jam. The Blue Circles, which no one can calculate, now inform that the exit is no longer jammed and that the explosion has taken place.
Mr. Carter recommends that you wait until the first gray after a gray cross and take a position in the momentum direction (for example, if the momentum value is above zero, relax). Exit position when the momentum changes (increase or decrease, this is indicated by a color change). In this algorithm, I tried to achieve good entry points using an additional indicator such as ADX and WaveTrend. To draw the histogram, I used a different method based on Linear Regression . Mr.Carter uses a simple momentum indicator. Strategy, alarms and signals have been added to the indicator so that you can optimize in algorithmic trading.
In summary, this algorithm is a strict algorithm in which additional 4-5 indicators are blended. Conveniences for Everyone ...
TR: Bu Algoritma John Carter'ın "TTM Squeeze" volatilite göstergesinin bir türevidir. Bir çok stratejist Tradingview' de gösterge' yi basit hareketli ortalamalarla ele almış ve en büyük hatayı sadece sıkışma ve sıkışmadan çıkış süreçlerini ele alarak bakmışlardır. Fakat ben algoritmayı piyasaların asıl patlama yapacağı yeri tespit etmek için kullandım. Örneğin SMA' ları kullanmak yerine Hacim Ağırlıklı Hareketli Ortalamaları ve Hull MA' ları kullanarak onları Linerar Regresyon Eğrisinde stress testine tabi tuttum. Buda bana daha duyarlı bir algoritma geliştirmem ve asıl patlamanın olacağı yerleri tespit etmem için fırsat verdi. Orta hattaki Gri Daireler, piyasanın yeni bir sıkışmaya girdiğini gösteriyor ( Bollinger Bantları ve Keltner Kanalı'nda). Bu, düşük volatilite anlamına gelir, piyasa kendisini patlayıcı bir harekete hazırlar (yukarı veya aşağı). Beyaz Daireler ise sıkışmadan çıkmak üzere olduğu anlamına gelir. Hiç kimsenin hesap edemediği Mavi Daireler ise artık sıkışmadan çıkıldığını ve patlamanın gerçekleştiğini haber verir.
Mr.Carter, gri bir çarpı işaretinden sonra ilk griye kadar beklemenizi ve momentum yönünde bir pozisyon almanızı önerir (örneğin, momentum değeri sıfırın üstünde ise, rahat olun). Momentum değiştiğinde pozisyondan çıkın (artırma veya azaltma, bunu o bir renk değişikliği ile belirtilir). Bu algoritmada ben, ADX ve WaveTrend gibi ek bir gösterge kullanarak iyi giriş noktalarıelde etmeye çalıştım. Histogramı çizmek için ise Linear Regresyon tabanlı farklı bir yöntem kullandım. Mr.Carter basit bir momentum göstergesi kullanır. Göstergeye algoritmik işlemlerde optimizasyon yapabilmeniz için strateji, alrmlar ve sinyaller eklenmiştir.
Özetle bu algoritma ek 4-5 göstergenin harmanlandığı sıkı bir algoritmadır. Herkese Kolaylıklar dilerim...

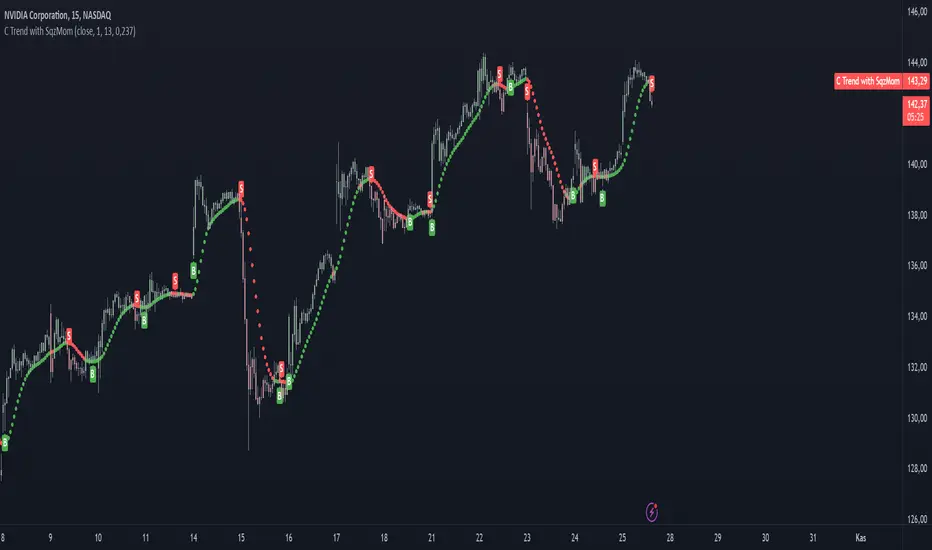
TopTenAlgo 3. Cursor Trend with SQZ MOM(Without Volume Ind.)EN: Indicator Trend is a momentum algorithm that measures the direction of the trend. It recalculates the Volume Weighted Moving Average and Tilson functions included with a certain frequency value according to the closing price and this trend helps us determine trend times. The size of the frequency correction motion. It Looks at the Logarithmic to functions. Is the zigzag of argument correction? otherwise it is a shortcut for a flat / flat correction . You can use the minus frequency value minus in zigzags, while it is handled with lower frequencies in flat or flat corrections . For symbols for which the Volume Indicator cannot be read.
This algorithm is prepared with @Top10Algo ... Improvements have been made regarding short periods.
TR: Gösterge Trend, trendin yönünü ölçen bir momentum algoritmasıdır. İçeriğinde bulunan Volume Weighted Moving Average ve Tilson fonksiyonlarını belli bir frekans değeri ile kapanış fiyatına göre yeniden hesaplar ve bu sayede trend değişim zamanlarını belirlememize yardımcı olur. Frekans değeri düzeltme hareketinin boyutuna göre değişiklik gösterir. Fonsiyonlara Logaritmik bakar.Frekans değerini belirlememizde yardımcı olan argüman düzeltmenin zigzag mı? yoksa yassı/flat bir düzeltmemi olacağını kestirmektir. Zigzaglarda frekans değeri eksi yönde daha fazla büyürken yassı yada flat düzeltmelerde daha düşük frekanslarla ele alınır. Hacim Göstergesinin okunamadığı semboller içindir.
Bu algoritma @Top10Algo ile beraber hazırlanmıştır... Kodlamadaki katkılarından ve yol göstericiliğinden dolayı teşekkürü bir borç bilirim. Kısa Periyotlar için iyileştirmeler yapıldı...

TopTenAlgo 3. Cursor Trend with SQZ MOM (Include Volume Ind.)EN: Indicator Trend is a momentum algorithm that measures the direction of the trend. It recalculates the Volume Weighted Moving Average and Tilson functions included with a certain frequency value according to the closing price and this trend helps us determine trend times. The size of the frequency correction motion. It Looks at the Logarithmic to functions. Is the zigzag of argument correction? otherwise it is a shortcut for a flat / flat correction . You can use the minus frequency value minus in zigzags, while it is handled with lower frequencies in flat or flat corrections .
This algorithm is prepared with @Top10Algo ... Improvements have been made regarding short periods.
TR: Gösterge Trend, trendin yönünü ölçen bir momentum algoritmasıdır. İçeriğinde bulunan Volume Weighted Moving Average ve Tilson fonksiyonlarını belli bir frekans değeri ile kapanış fiyatına göre yeniden hesaplar ve bu sayede trend değişim zamanlarını belirlememize yardımcı olur. Frekans değeri düzeltme hareketinin boyutuna göre değişiklik gösterir. Fonsiyonlara Logaritmik bakar.Frekans değerini belirlememizde yardımcı olan argüman düzeltmenin zigzag mı? yoksa yassı/flat bir düzeltmemi olacağını kestirmektir. Zigzaglarda frekans değeri eksi yönde daha fazla büyürken yassı yada flat düzeltmelerde daha düşük frekanslarla ele alınır.
Bu algoritma @Top10Algo ile beraber hazırlanmıştır... Kodlamadaki katkılarından ve yol göstericiliğinden dolayı teşekkürü bir borç bilirim. Kısa Periyotlar için iyileştirmeler yapıldı...