Anchored VWAP w/ Stdev and VWMA CloudThis is a fun little project that allows you to anchor the Volume Weighed Average Price (VWAP) to a specific day and plot up to 4 standard deviations up or down.
I've also added a Volume Weighted Moving Average (VWMA) plot and accompanying cloud to more easily visualize how volume-based momentum affects trends.
Typically, you'll see price respecting the VWMA Cloud and can expect price bounces off of the VWAP standard deviations.
When setting the initial anchor point, it's best to select a day with high volume and volatility.
This idea is not 100% original, but I couldn't find 1) a public script combining the ideas and 2) the correct plotting of the standard deviation via accumulation.
Happy Trading!
FAQ
Why is your script Protected?
Users like to take my open-source code and charge to use it without my permission.
How do I use this to trade?
Add it to your chart and see what stacks up with your current setup. I trade Forex, so what looks bad on my charts might look golden on yours.
How long have you been doing this?
I've been coding for about 8 years and actively trading for 2 years. My degree is in Robotics Engineering and I became obsessed with investing at 22.
How do you trade?
Hurst + SNR + MESA MAMA + ATR + LSTM + Pure Grid. You can't completely code this setup using Pinescript, but if you learn C++ or Python you're there!
Are your returns good?
I average 0.68% every weekday or 22.65% monthly, using the method above.
Can you build my indicator or strategy?
Absolutely! If it hasn't been done before and it improves our community, then consider it done.
But can you build an indicator or strategy for me and only me?
Citing the house rules, I cannot solicit for any purpose. So saying "PM me" would be a grievous violation of said rules, obviously.
Deviazione Standard (Volatilità)

Functions Allowing Series As Length - PineCoders FAQ█ WARNING
Improvements to the following Pine built-ins have deprecated the vast majority of this publication's functions, as the built-ins now accept "series int" `length` arguments:
ta.wma()
ta.linreg()
ta.variance()
ta.stdev()
ta.correlation()
NOTE
For an EMA function that allows a "series int" argument for `length`, please see `ema2()` in the ta library by TradingView .
█ ORIGINAL DESCRIPTION
Pinescript requires many of its built-in functions to use a simple int as their period length, which entails the period length cannot vary during the script's execution. These functions allow using a series int or series float for their period length, which means it can vary on each bar.
The functions shared in this script include:
Rolling sum: Sum(src,p)
Simple moving average: Sma(src,p)
Rolling variance: Variance(src,p)
Rolling standard deviation: Stdev(src,p)
Rolling covariance: Covariance(x,y,p)
Rolling correlation: Correlation(x,y,p)
If p is a float then it is rounded to the nearest int .
How to Use the Script
Most of the functions in the script are dependent on the Sma function. The Correlation function uses the Covariance and Stdev functions. Be sure you include all the required functions in your script.
Make sure the series you use as the length argument is greater than 0, else the functions will return na . When using a series as length argument, the following error might appear:
Pine cannot determine the referencing length of a series. Try using max_bars_back in the study or strategy function.
This can be frequent if you use barssince(condition) where condition is a relatively rare event. You can fix it by including max_bars_back=5000 in your study declaration statement as follows:
study("Title",overlay=true,max_bars_back=5000)
Example
The chart shows the Sma , Stdev , Covariance and Correlation functions. The Sma uses the closing price as input and bars as period length where:
bars = barssince(change(security(syminfo.tickerid,"D",close ,lookahead=true)))
The Stdev uses the closing price as input and bars + 9 as period length. The Covariance and Correlation use the closing price as x and bar_index as y , with bars + 9 as period length.
Look first. Then leap.

TD Moon Cycle Standard Deviation Z Score AlertsHas alerts for the TD 9 function, also the black is Z score and blue is STD Dev
Also the moon functionality of Ichimoonku is built into this as well because sometimes I just want to see the cycles of moon with TD9 ; see that script (Ichimoonku) for more info on moon functionality.
Much love
Enjoy
GL HF
xoxo
Snoop

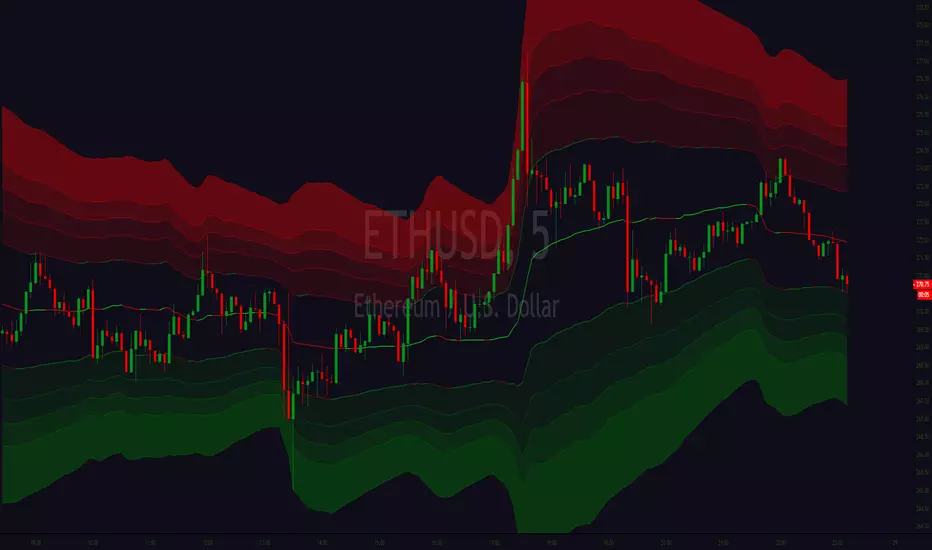
AEONDRIFT {Expected Ranges}Expected Ranges base on AEONDRIFT implementation of Standard Deviation bands.
Note: In no way is this intended as a financial/investment/trading advice. You are responsible for your own investment/trade decisions.
Please PM me for access information.

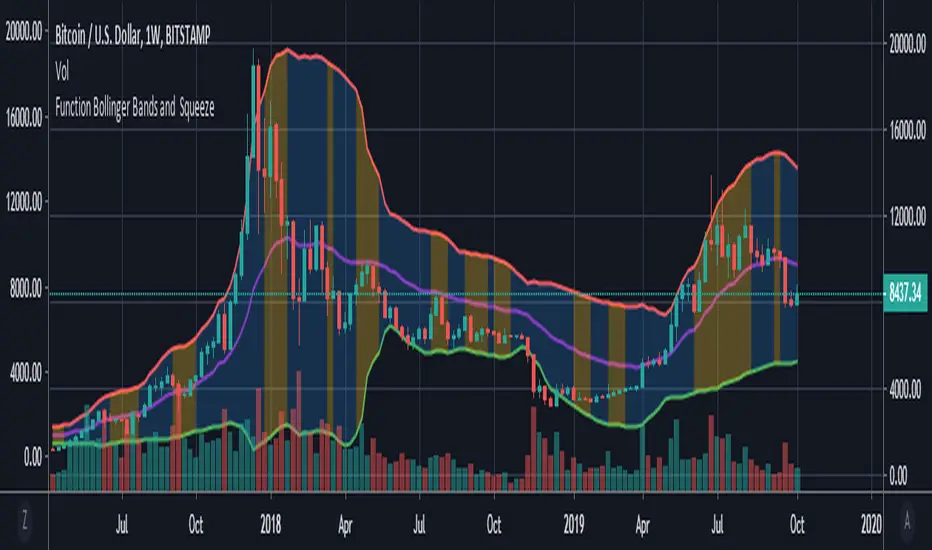
Function : Bollinger Bands and BBW Squeeze DetectorThis script shows Bollinger Bands function and want to detect Bollinger Band Width Squeeze with a successful, different perspective .
Bollinger Bands : You can specify the Bollinger Bands periods as mutable variables .
Bollinger Band Width Squeeze : First the Bollinger bands width was calculated.The width was then divided into levels using the money flow index.
Thus, the bollinger takes into account the available volume averages when calculating the band width mfi (Money Flow Index).
After this modelling, we can limit and color the lower limit and upper limits just as Relative Strength Index.
We can even put warnings on oversold areas if desired. Let's not forget that we are working with width rather than price.
By design, squeeze areas are defined directly above the Bollinger Bands with coloration. I think it is very practical and looks stylish.
I tried and found it quite successful and wanted to share it with users.
I came up with many ideas when I wrote this system, and I will share them very soon . I hope it will be useful to users and give new ideas.
Best regards.
Standard Deviation - Sum Of The Squares Minus Square Of The SumsIntroduction
The standard deviation measure the dispersion of a data set, in short this metric will tell you if your data is on average closer or farther away from the mean. Its one of the most important tools in statistics and living without it is pretty much impossible, without it you can forget about Bollinger-bands, CCI, and even the LSMA (ouch this hurt) .
Now i don't want to extend myself about the standard deviation since that would require a huge post but i want to show you how to calculate the standard deviation from the stdev pinescript function.
Sum Of The Squares Minus Square Of The Sums
Any metric calculated from a moving average can be classified as "running", this mean that the metric constantly update itself and is not constant, this is why it is better to say "running standard deviation" but its okay. If we use the standard calculation for the standard deviation which would be sqrt(sma(pow(close - sma,2))) we might get something totally different from the stdev function :
In white the pine stdev function and in red the standard calculation of both period 4, its clear that both are not the same, one might try to use the Bessel's correction but that won't do either, this is because most technical analysis tools will calculate the square root of the "Sum Of The Squares Minus Square Of The Sums" method to estimate the standard deviation
Another way is to use :
a = sqrt(sma(pow(close,2),length) - pow(sma(close,length),2))
By returning the difference we might still see some errors :
Nothing relevant of course.
Conclusion
Some of you might already be aware of this but a reminder is always good since it can be confusing to make what can be considered the good standard deviation formula and then have something totally different from the pine function, i hope this post will be useful and that you learned something from it.
Thanks for reading :)

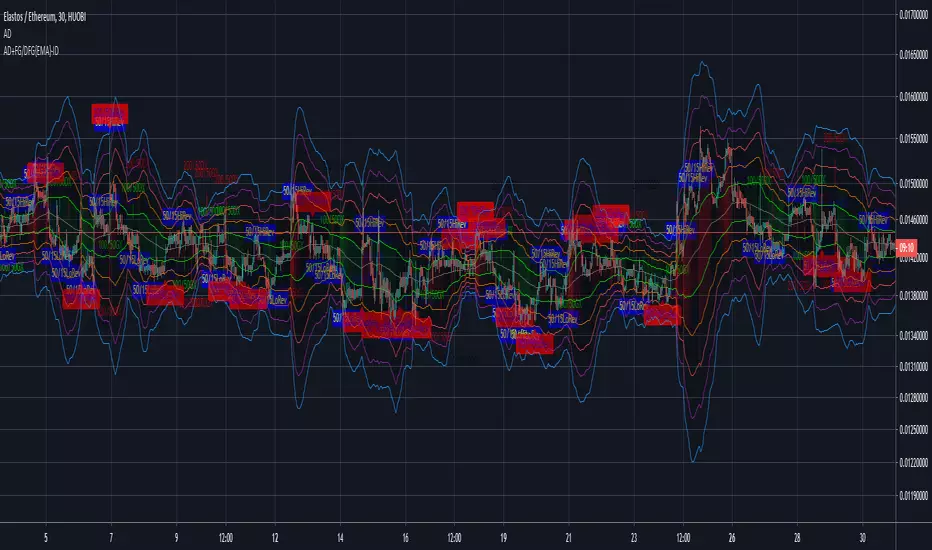
AEONDRIFT with FG & DFG {EMA} indicatorsAEONDRIFT with {EMA} implementation of FUSIONGAPS (FG) and DIFFERENTIAL FUSIONGAPS (DFG) derived indicators.
~JuniAiko
(=^~^=)v~
Check out the other analytical tools that I had published.
AEONDRIFT:


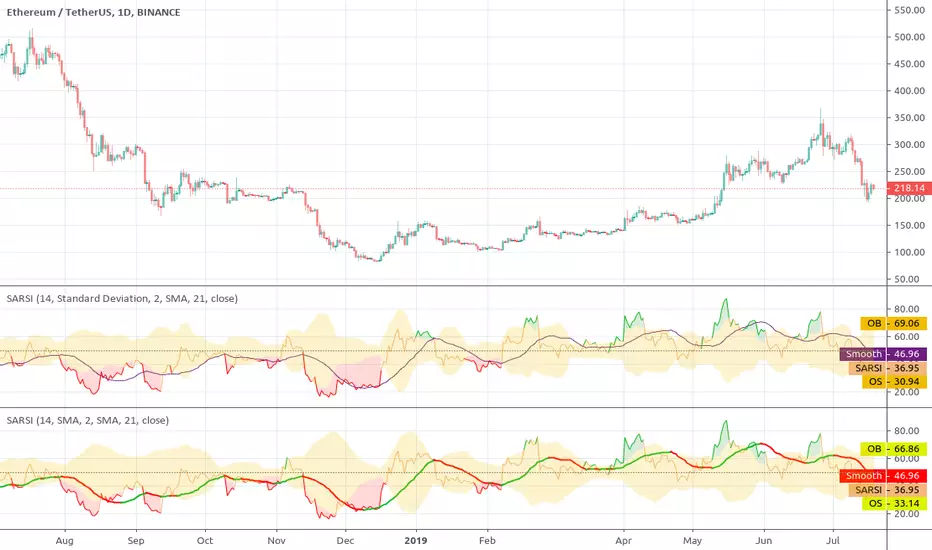
Self-Adjusting RSIThis indicator was originally developed by David Sepiashvili (Stocks & Commodities V. 24:2 (February, 2006): The Self-Adjusting RSI ).
The author presented a technique to adjust the traditional RSI overbought and oversold thresholds so as to ensure that 70-80% of RSI values lie between the two thresholds.
He used two algorithms for adjusting:
Standard Deviation-based
Simple Moving Average-based
Easy and straightforward. But this is not a true way.
Source code on request

Dorsey InertiaThis indicator was originally developed by Donald Dorsey (Stocks & Commodities, V.13:9 (September, 1995): "Refining the Relative Volatility Index").
Inertia is based on Relative Volatility Index (RVI) smoothed using linear regression.
In physics, inertia is the tendency of an object to resist to acceleration. Dorsey chose this name because he believes that trend and inertia are related and that it takes more effort and energy to reverse the direction of a stock or market than to keep it in the same direction. He argues that the volatility is the simplest and most accurate measure of inertia.
When the indicator is below 50, it signals bearish market sentiment and when the indicator is above 50 it signals a bullish trend.
Good luck!

Stiffness IndicatorThis indicator was originally developed by Markos Katsanos (Stocks & Commodities, V.36:12 (November, 2018): "The Stiffness Indicator").
Like and follow for more open source indicators!
Happy Trading!

4 Bollinger Bands and 2 Exponential Moving Averages This script contains multiple indicators of 3 types for better visibility and without having to select multiple indicators one by one and hence saving your time and energy. Also, minimum number of variables are being used in the script for better calculation speed and implementation .
This script is best suited for beginners who are not using pro version and finding it difficult to implement more than 3 indicators on a single chart layout :)
Indicators used :
1. Hybrid of Simple Moving Average and Bollinger Bands .
In this Indicator user can use total of 4 Moving Averages or 4 Bolinger Bands or both (eg: 3 Bolinger bands and 1 Simple Moving Average).
> How to use :
If you want to use Bollinger Bands simply check the boxes of all the 'Upper' and 'Lower' Bands under indicator format/settings.
Else if you want to use Simple Moving Average simply uncheck the boxes of all the 'Upper' and 'Lower' Bands under indicator format/settings.
Tip : You are free to experiment with the format/settings to use both Simple Moving Average and Bollinger Bands using 'MA Length' and 'StdDev'
(standard deviation).
2. Exponential Moving Average
In this indicator user can use 2 Exponential Moving Averages .
> How to use :
If you want to use 2 Exponential Moving Averages simply check 'Enable 2nd EMA' under format/setting inputs.
Else if you want to use only 1 Exponential Moving Average simply uncheck 'Enable 2nd EMA' under format/setting inputs.
Tip : You are free to experiment with both 'EMA_Length1' and 'EMA_Length2' and change it as per your requirments.
//Feel free to ping/DM me for any explaination on how to use this script as your ultimate trading strategy.

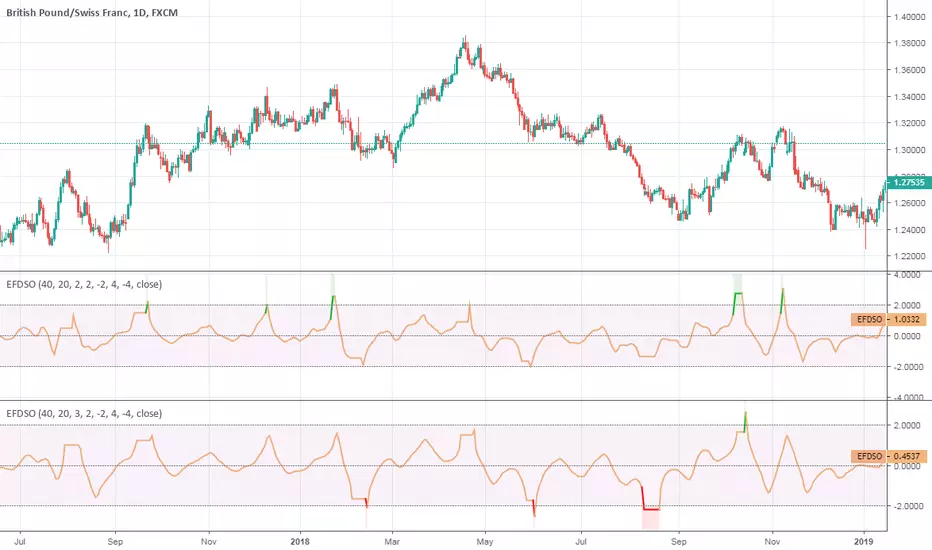
Ehlers Fisherized Deviation-Scaled OscillatorEhlers Fisherized Deviation-Scaled Oscillator script.
This indicator was originally developed by John F. Ehlers (Stocks & Commodities V. 36:11: Probability - Probably A Good Thing To Know).
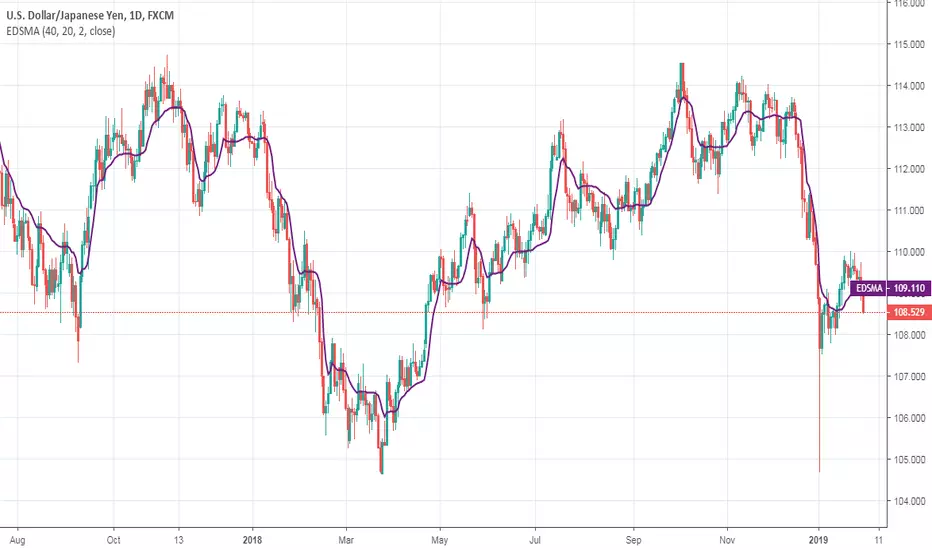
Ehlers Deviation-Scaled Moving Average (DSMA)Ehlers Deviation-Scaled Moving Average indicator script.
This indicator was originally developed by John F. Ehlers (Stocks & Commodities V. 36:8: The Deviation-Scaled Moving Average).
Relative Volatility IndexCorrected Relative Volatility Index. This indicator was originally developed by Donald Dorsey (Stocks & Commodities V.11:6 (253-256): The Relative Volatility Index).
The indicator was revised by Dorsey in 1995 (Stocks & Commodities V.13:09 (388-391): Refining the Relative Volatility Index).
I suggest the refined RVI with optional settings. If you disabled Wilder's Smoothing and Refined RVI you will get the original version of RVI (1993, as built-in).
Also, you can choose an algorithm for calculating Standard Deviation.

OHLC Daily Resolution BandsShout out to nPE- for the idea.
Bands made with stdev from 10 day OHLC.
Keeps resolution to daily, so you can use bands as daily pivots for day trading.
Upper band 1=yesterday close + 0.5 std(ohlc,10)
Upper band 1=yesterday close + 1 std(ohlc,10)
Mid=yesterday close
Lower band 1=yesterday close - 0.5 std(ohlc,10)
Lower band 2=yesterday close - 1 std(ohlc,1

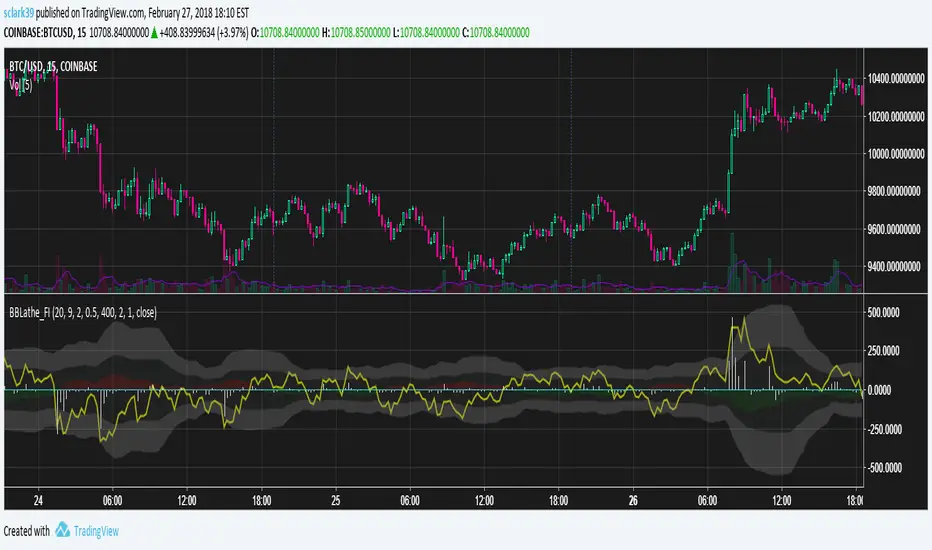
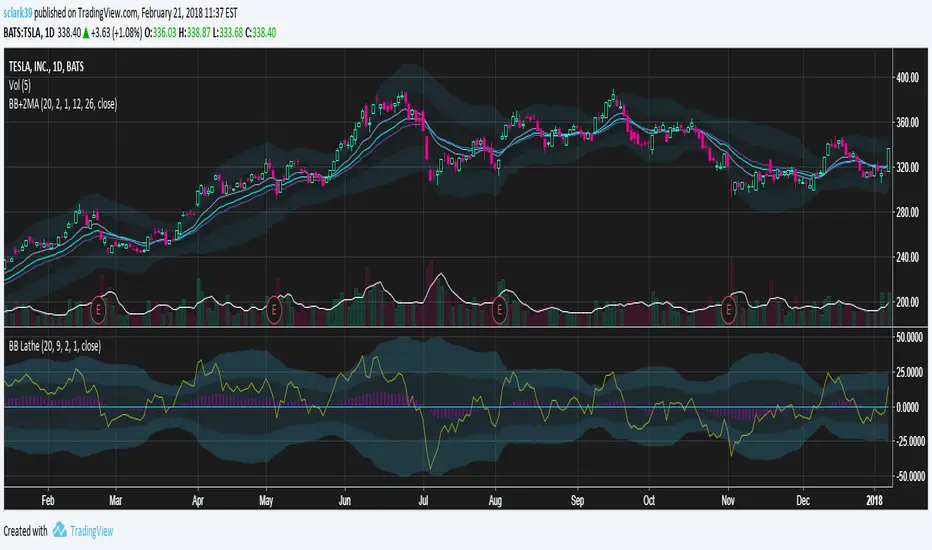
BBLathe2: Bollinger Band Lathe w/ Elder's Force Index [sclark39]Welcome to the second version of the BBLathe!
This shows Bollinger Bands centered on a horizontal basis, to make it easier to see how volatility is changing and identify squeeze opportunities. By default Bollinger bands are calculated using an exponential moving average and an improved higher precision stdev implementation, but this can be disabled. Version 2 also shows Elder's Force Index as a white histogram, so you can see some volume information to help confirm the power of the bears/bulls. The green/red shadow shows how the Bollinger's basis is changing, and when it is going up there will be a green shadow underneath the basis line (this can be inverted in the settings). There is also price line (yellow) showing the location of the price within the Bollinger Bands.
Use this indicator for trades at your own risk, I made this for fun and it is not a trade recommendation.
That being said, if you like my work please tip me!
ETH: 0xf8E0Ea503B5c833fD4546E7fa2c70EcE42A27C8A
Please comment with feedback and requests!
Bollinger Bands + 2 MA (Exponential)Basic Bollinger Bands implementation, with the option to use an exponential moving average and a more accurate stdev function than the builtin. This also includes two extra MA lines which can be tuned as you like, to reduce the number of indicators needed (the bollinger basis is also a moving average, so in total you get 3MA out of this indicator). This draws an inner/outer envelope which can be tuned, by default it is set to 1-2STDEV.
This uses the same same improvement to stdev as my other bollinger indicator:
See more info about the bultin stdev here:
OHLC Volatility Estimators by @Xel_arjonaDISCLAIMER:
The Following indicator/code IS NOT intended to be a formal investment advice or recommendation by the author, nor should be construed as such. Users will be fully responsible by their use regarding their own trading vehicles/assets.
The embedded code and ideas within this work are FREELY AND PUBLICLY available on the Web for NON LUCRATIVE ACTIVITIES and must remain as is by Creative-Commons as TradingView's regulations. Any use, copy or re-use of this code should mention it's origin as it's authorship.
WARNING NOTICE!
THE INCLUDED FUNCTION MUST BE CONSIDERED AS DEBUGING CODE The models included in the function have been taken from openly sources on the web so they could have some errors as in the calculation scheme and/or in it's programatic scheme. Debugging are welcome.
WHAT'S THIS?
Here's a full collection of candle based (compressed tick) Volatility Estimators given as a function, openly available for free, it can print IMPLIED VOLATILITY by an external symbol ticker like INDEX:VIX.
Models included in the volatility calculation function:
CLOSE TO CLOSE: This is the classic estimator by rule, sometimes referred as HISTORICAL VOLATILITY and is the must common, accepted and widely used out there. Is based on traditional Standard Deviation method derived from the logarithm return of current close from yesterday's.
ELASTIC WEIGHTED MOVING AVERAGE: This estimator has been used by RiskMetriks®. It's calculation is based on an ElasticWeightedMovingAverage Standard Deviation method derived from the logarithm return of current close from yesterday's. It can be viewed or named as an EXPONENTIAL HISTORICAL VOLATILITY model.
PARKINSON'S: The Parkinson number, or High Low Range Volatility, developed by the physicist, Michael Parkinson, in 1980 aims to estimate the Volatility of returns for a random walk using the high and low in any particular period. IVolatility.com calculates daily Parkinson values. Prices are observed on a fixed time interval. n=10, 20, 30, 60, 90, 120, 150, 180 days.
ROGERS-SATCHELL: The Rogers-Satchell function is a volatility estimator that outperforms other estimators when the underlying follows a Geometric Brownian Motion (GBM) with a drift (historical data mean returns different from zero). As a result, it provides a better volatility estimation when the underlying is trending. However, this Rogers-Satchell estimator does not account for jumps in price (Gaps). It assumes no opening jump. The function uses the open, close, high, and low price series in its calculation and it has only one parameter, which is the period to use to estimate the volatility.
YANG-ZHANG: Yang and Zhang were the first to derive an historical volatility estimator that has a minimum estimation error, is independent of the drift, and independent of opening gaps. This estimator is maximally 14 times more efficient than the close-to-close estimator.
LOGARITHMIC GARMAN-KLASS: The former is a pinescript transcript of the model defined as in iVolatility . The metric used is a combination of the overnight, high/low and open/close range. Such a volatility metric is a more efficient measure of the degree of volatility during a given day. This metric is always positive.
