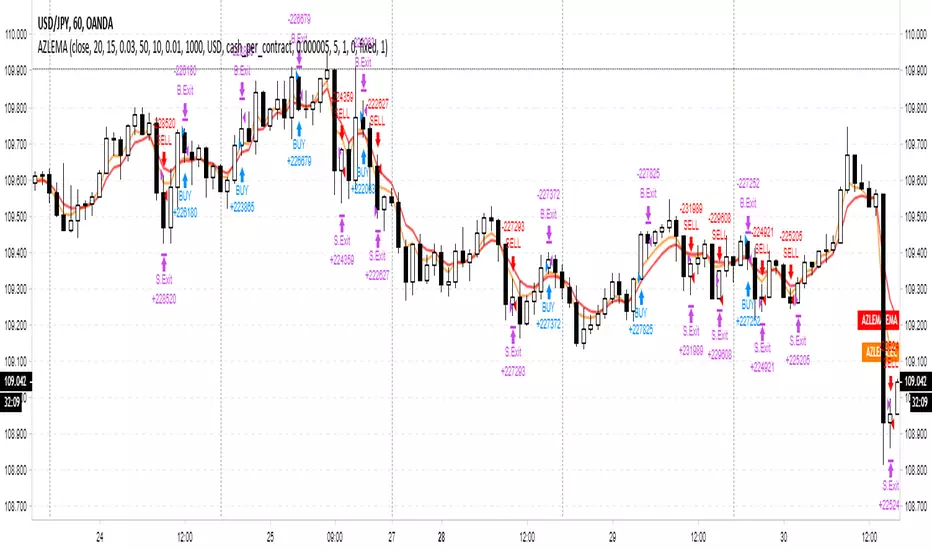
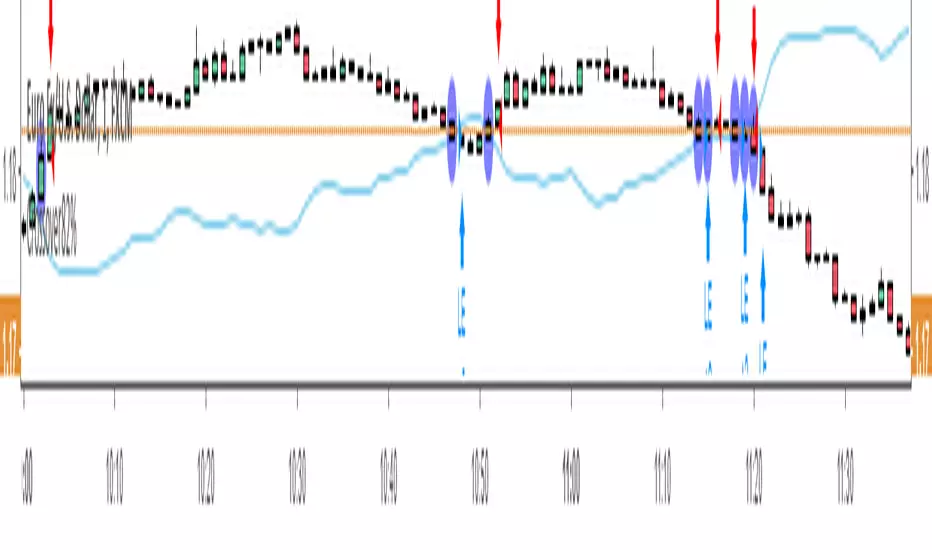
Adaptive Zero Lag EMA Strategy [Ehlers + Ric]Behold! A strategy that makes use of Ehlers research into the field of signal processing and wins so consistently, on multiple time frames AND on multiple currency pairs.
The Adaptive Zero Lag EMA (AZLEMA) is based on an informative report by Ehlers and Ric .
I've modified it by using Cosine IFM, a method by Ehlers on determining the dominant cycle period without using fast-Fourier transforms
Instead, we use some basic differential equations that are simplified to approximate the cycle period over a 100 bar sample size.
The settings for this strategy allow you to scalp or swing trade! High versatility!
Since this strategy is frequency based, you can run it on any timeframe (M1 is untested) and even have the option of using adaptive settings for a best-fit.
>Settings
Source : Choose the value for calculations (close, open, high + low / 2, etc...)
Period : Choose the dominant cycle for the ZLEMA (typically under 100)
Adaptive? : Allow the strategy to continuously update the Period for you (disables Period setting)
Gain Limit : Higher = faster response. Lower = smoother response. See for more information.
Threshold : Provides a bit more control over entering a trade. Lower = less selective. Higher = More selective. (range from 0 to 1)
SL Points : Stop Poss level in points (10 points = 1 pip)
TP Points : Take Profit level in points
Risk : Percent of current balance to risk on each trade (0.01 = 1%)
www.mesasoftware.com
www.jamesgoulding.com(Measuring%20Cycles).doc
Strategy
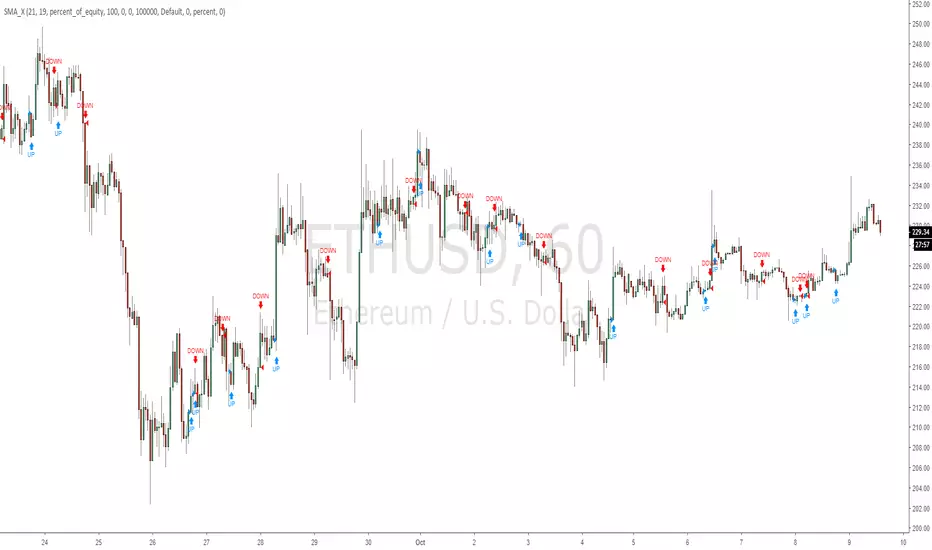
RENKO strategyStandard simple strategy RENKO. Entry on the first reversing bar. No repaints. Caution arrows when price crossing RENKO levels

Powerfull strategy MACD+RSI+STOCH ATR stop best on Crude OilMy strategy uses a combination of three indicators MACD Stochastic RSI .
The Idea is to buy when ( MACD > Signal and RSI > 50 and Stochastic > 50) occures at the same time the BUY STop we place on previous day HIGH
and sell (short) when the opposite condition occurs we place SELL STOP on previous day LOW
We exit on Take profit or Stop loss which is calculated by ATR (10) or on the opposite signal "Volatility breakout"
This strategy works well on stocks, commodities and cryptos especially during market breaking up after consolidation
The best results are on Daily charts , so its NOT a scalping strategy. But it can work also on 1H charts.
The strategy does not have any stops and profit targets, so we can take all the market can give us at the moment.
The exit point only when MACD goes under Signal
Its Preformance is significantly better with "buy stop on High.1 and sell stop on Low.1" idea and exit on "volatility price breakout"
So, use it, trade it.
If it will help you to imprive your trading results, please donate me
BTC: 12kd1F8buWisUBdq27BBwRkUvzW7Ey3og

Powerfull strategy MACD + RSI + Stoch buy on High exit on ATRMy strategy uses a combination of three indicators MACD Stochastic RSI .
The Idea is to buy when ( MACD > Signal and RSI > 50 and Stochastic > 50) occures at the same time the BUY STop we place on previous day HIGH
We exit on Take profit or Stop loss which is calculated by ATR (10) or on the opposite signal "Volatility breakout"
This strategy works well on stocks, commodities and cryptos especially during market breaking up after consolidation
The best results are on Daily charts , so its NOT a scalping strategy. But it can work also on 1H charts.
The strategy does not have any stops and profit targets, so we can take all the market can give us at the moment.
The exit point only when MACD goes under Signal
Its Preformance is significantly better with "buy stop on High.1" idea and exit on "volatility price breakout"
So, use it, trade it.
If it will help you to imprive your trading results, please donate me
BTC: 12kd1F8buWisUBdq27BBwRkUvzW7Ey3og5

[New series!] [Consistent Losing Strategies] 34 EMA Scalping//---------------------------INTRO------------------------------
Hi All!
Let me introduce myself as a semi-successful forex trader & lover of automation.
I've taken to algo trading and have been hunting down strategies (that usually use indicators) to automate, backtest, and hopefully implement in MT4.
Unfortunately, most strategies are complete bulls*** and the select cases that are shown to "prove" success are limited.
These strategy sources often do not provide useful analytics either.
I want to change that approach to trading! We can really benefit each other and the community by being methodical about backtesting
as well as evaluating our results with some kind of scoring heuristic.
As for what that standardized process looks like..well I'm still working on it.
I'm pretty much on Tv for multiple hours of the day, screening strategies via Pinescript and I'd like to start sharing my progress!
This is a new series I'd like to start on consistently losing strategies. I'll make all the code public, so if you think I've made a blunder
or approached a problem the wrong way, then drop me a DM or paste your fix into the comments.
//---------------------------STRAT------------------------------
34 EMA Scalping strategy (ref. forextradingstrategies4u )
How you're supposed to trade it:
BUY:
1. Market is in an down trend as shown by the 34 EMA
2. Price breaks above a downwards trend line
3. Price breaks above the 34 EMA
4. Look for a very bullish candlestick or chart pattern
SELL:
1. Look for the 34 EMA to show we are in an uptrend
2. Price breaks below an upwards sloping trend line
3. Price breaks below 34 EMA
4. Look for a bearish candlestick or a chart pattern
//---------------------------CONC------------------------------
Q: Why does it fail?
A: I believe this strategy relies too much on subjective input (aka, trendlines).
Q: Why does it fail as an algo?
A: The 34 EMA is no more predictive than any other EMA, although it does a good job at filtering out noise.
Q: Should I try it out?
A: No, it's trash. This is the proof that it is trash.

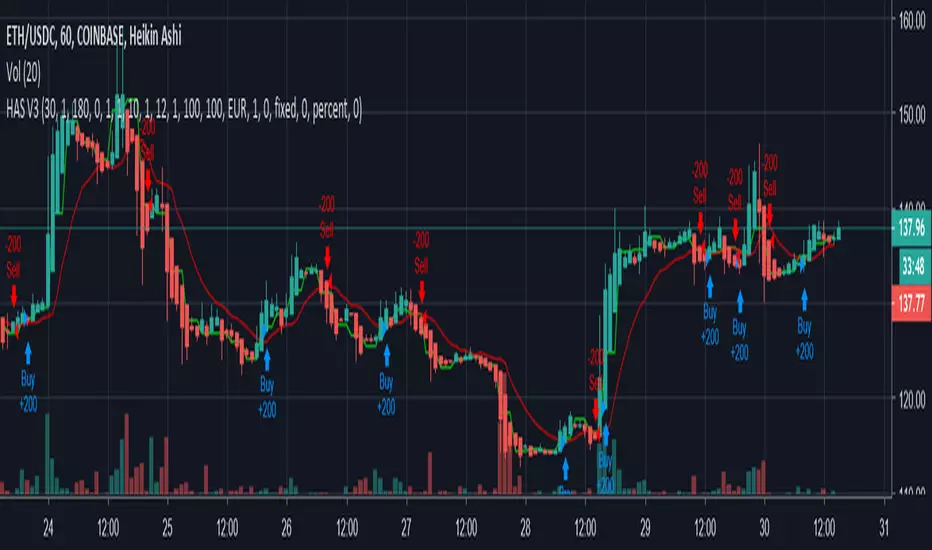
Tulkens ETHUSDC StrategyV3Hello,
My first strategy! I'nt know how to get it working on poloniex. Can somebody help me pls?
I also want to add a stop-loss off some kind but i coudn't get it to work properly.
Please comment on what i need to aprove.
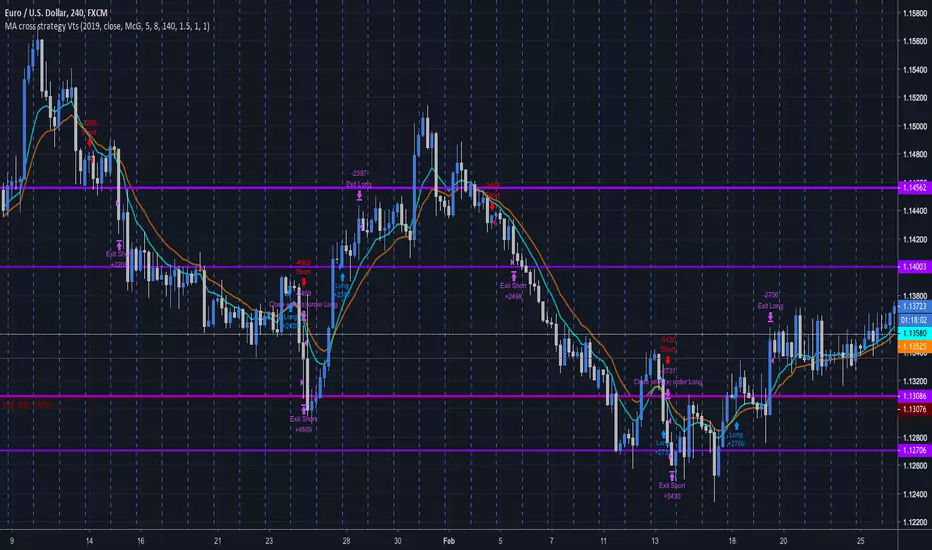
MA cross strategy VtsThe simple Moving average cross strategy is here implemented.
I guess there are multitudes of similar scripts around.
I post this one since I was asked by some friends, and I'll let it free to use for anybody.
Here you can choose the year where to start backtesting, the source, the type of MA, the SL and TP multiplicators of ATR, for which you can also choose the averaging period.
Feel free to modify this script. I would be grateful if you could preserve the first lines of comments including my user names.
The MA cross strategies can be very effective, especially when used on the daily TF.
Try for example the combo EMA15-EMA30 SL=1.5ATR TP=1ATR on EURCHF daily to get an impressive 83% win ratio.
Or EMA20-EMA81 on the GBPCHF to get an 87%.
In those cases where EMA does not perform well, try to set a less lagging MA, like the Hull MA.
I hope you like this script so that you could push the like button multiple (odd) times and you start following me.
I've got a bunch of other interesting scripts to share.
Comments and suggestions are welcome.
Renko Strategy Open_CloseSimple Renko strategy, very profitable. Thanks to vacalo69 for the idea.
Rules when the strategy opens order at market as follows:
- Buy when previous brick (-1) was bearish and previous brick (-2) was bearish too and actual brick close is bullish
- Sell when previous brick (-1) was bullish and previous brick (-2) was bullish too and actual brick close is bearish
Rules when the strategy send stop order are the same but this time a stop buy or stop sell is placed (better overall results).
Note that strategy open an order only after that condition is met, at the beginning of next candle, so the actual close is not the actual price.
Only input is the brick size multiplier for stop loss and take profit: SL and TP are placed at (brick size)x(multiplier) Or put it very high if you want startegy to close order on opposite signal.
Adjust brick size considering:
- Strategy works well if there are three or more consecutive bricks of same "color"
- Expected Profit
- Drawdown
- Time on trade
This strategy uses Renko charts with TRADITIONAL bricks, so no repaint.
Study with alerts, MT4 expert advisor and jforex automatic strategy are available at request.
Please use comment section for any feedback.

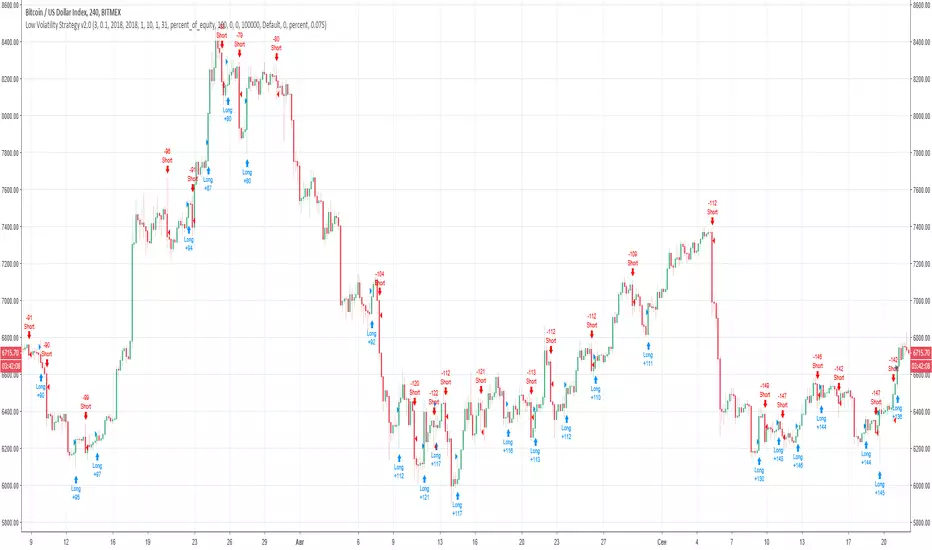
Strategy based on Squeeze Momentum Indicator [LazyBear]This Strategy is based on LazyBear Squeeze Momentum Indicator.
I added some custom feature and filters.
You can customize a lot of features to get a profitable strategy.
Here is a link to original study.
Please use comment section for any feedback.
Next improvement (only to whom is interested to this script and follows me): study with alerts on multiple tickers all at one. Leave a comment if you want to have access to study.
********************************** IMPORTANT*******************************
I have developed an expert advisor for metatrader4 (MT4) and for jforex platform: results of expert advisor form 2015-01-01 to 2018-11-25 are very good with low drawdown and good profit.
********************************************************************************
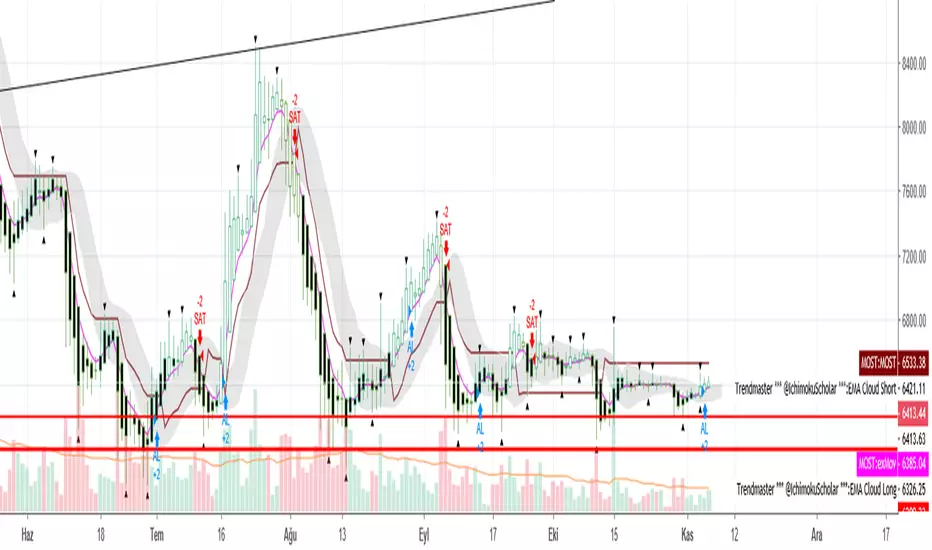
UVTrader StratejiIf you see "AL" you can buy, If you see "SAT" you can sell. You can use all charts, but 4 H and 1 D charts are very well..
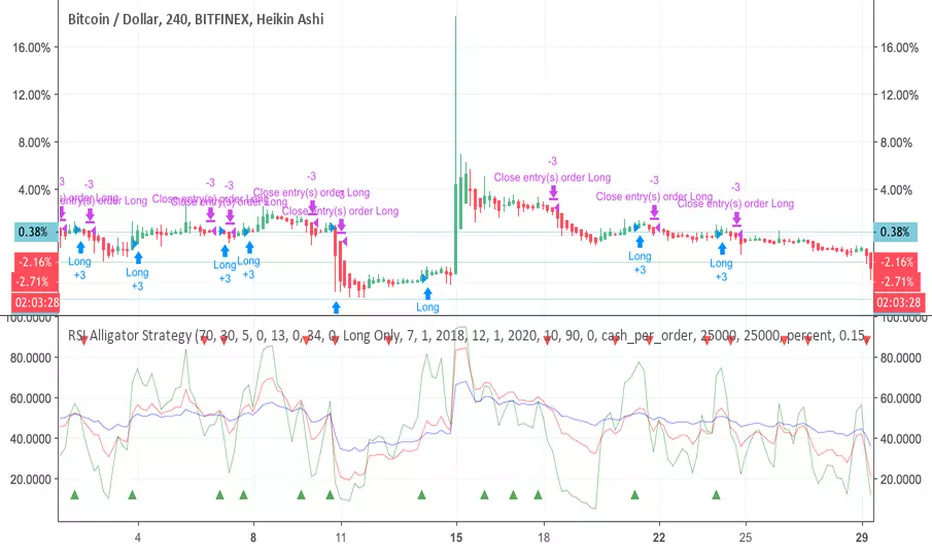
RSI Alligator Strategy [forked from jedireza]Backtester for RSI alligator is Williams Alligator strategy using Relative Strength Index to predict entries
Original script can be found at
Doji strategyThis is a simple strategy based on Doji star candlestick.
It places two orders: buy stop at doji star high or previous candle high and sell stop at doji star low or previous candle low.
Exit rules are with take profit and fixed stop loss or take profit and stop loss at doji min or max.
This strategy works very well with high time frames like Daily and Weekly because those are without noise in doji formation.
Each currency pair has its own optimal setting for TP and SL: it's up to user find the best ones.
I could implement SL based on ATR, maybe in next revision.
Please use comment section for any feedback.
Next improvement (only to whom is interested to this script and follows me): study with alerts on multiple tickers all at one. Leave a comment if you want to have access to study.

SimpleMA smoothed crossover strategyExperimental simple Bot script for ETH/USD 1 hour chart. welcome to test on other pairs. put feedback in comments.
This is a crossbreed between SMA and HULLMA
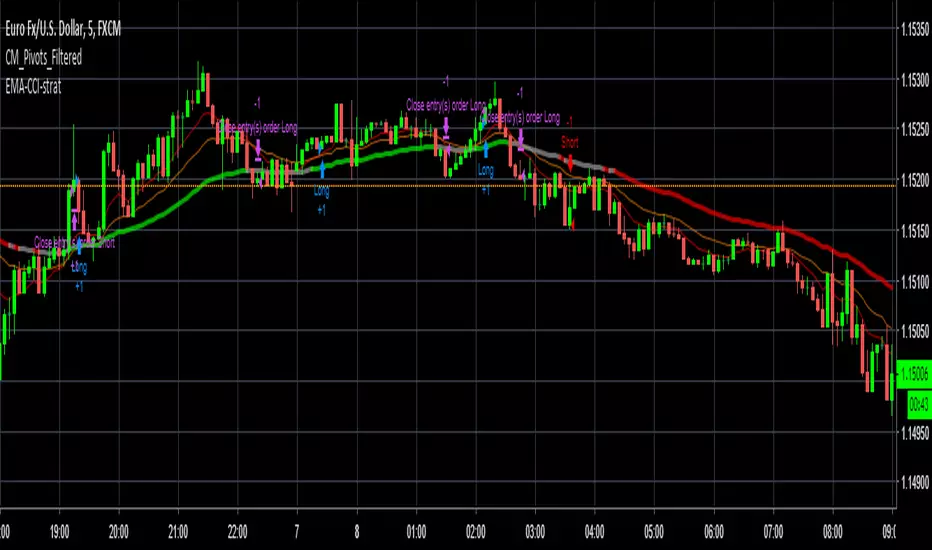
[Strategy] CCI EMA scalping [DEV]Recommended timeframe: 5M or higher
Based on EMA crosses and CCI levels.
Take profit can be also at Pivot levels like Daily/Weekly
Stop loss should be between 12-15 pips.
This strategy is still under development!
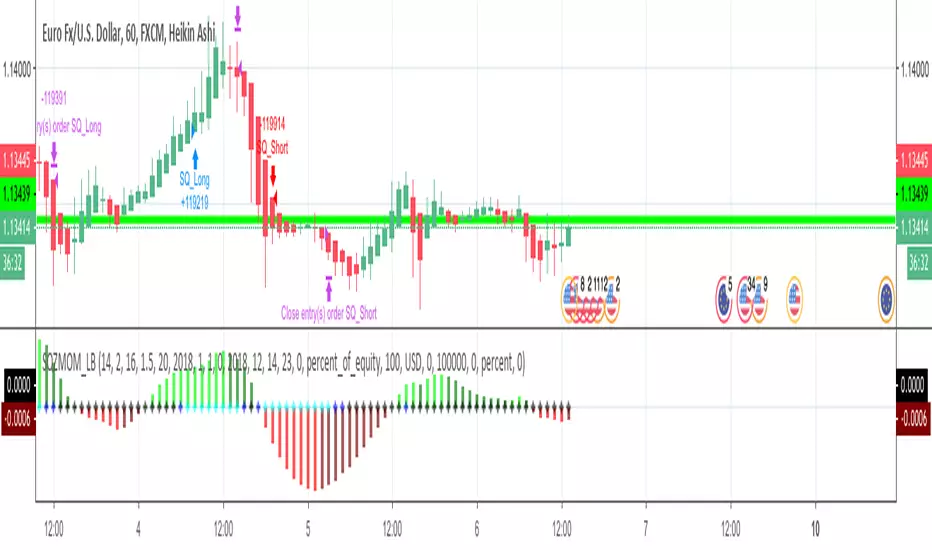
VB Strategy
VB Indicator
VB Indicator PRO (with Alarm function)
With this strategy, you can test VB indicator.
This strategy use entry and close price
entry price = (high price + low price) / 2
close price = (high price + low price) / 2
이 전략으로 VB 지표에 대해 테스트할 수 있습니다.
이 전략의 진입가와 청산가는 아래와 같이 설정합니다.
진입가 = (고점+저점) / 2
청산가 = (고점+저점) / 2

ATR Trailing Stop Bands Strategy [R] Originally based on a script by HPotter for an ATR Trailing Stop, which itself was based on an article by Sylvain Vervoort, but I adapted it to add Bands, to add extra optional Wick Protection, and have now made it a Strategy. It's not great for entries/exits, but as a Trailing Stop that can let winners ride, it's great.

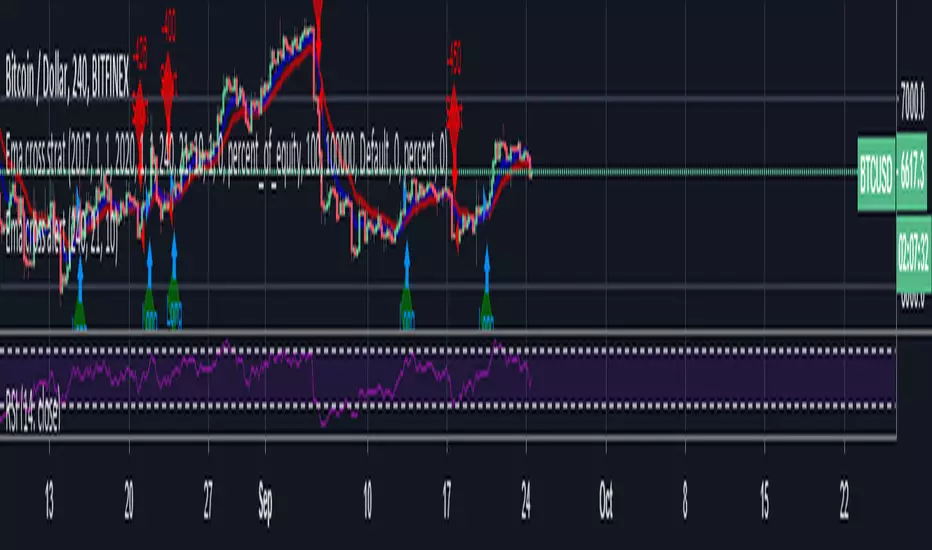
Ema cross strat / Turtle Trading This is just a simple EMA cross strategy which is meant to be similar to Turtle Trading Strategy.
It uses in default 4 Hour 21 / 10 EMA to long or short. This is not perfect but in the long run it will profit. Works best in bull market.
LINK TO ALERT :
Ergotic MACD Strategy [forked from HPotter]Ergotic MACD Strategy forked from HPotter
In addition to this fine script you will find some additional features:
- Backtester
- Alerts
- Filters: RSI, MFI, Price trend
- Trailing Stop Loss
- Other minor adjustments

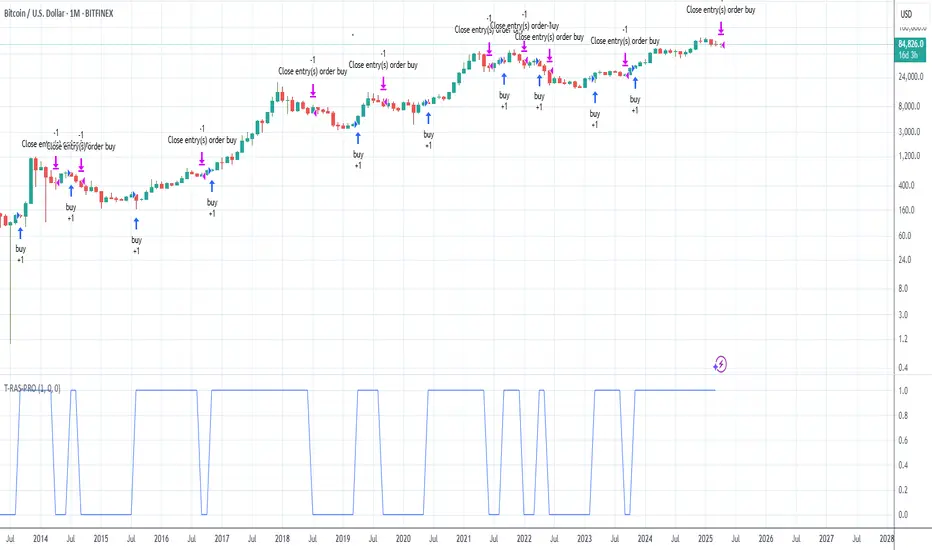
Trend Reversal Alerts Strategy [4H/3M]This is advanced version of T-R.A.S with better logic adapted for 4hour / 3month timeframes
Trend Reversal Alerts Strategy [Advanced]This is a hourly version of T-R.A.S
It's better for houry timeframes : 2h, 3h, 4h, 6h, 12h, 1d, 4d ; otherwise use version for weekly

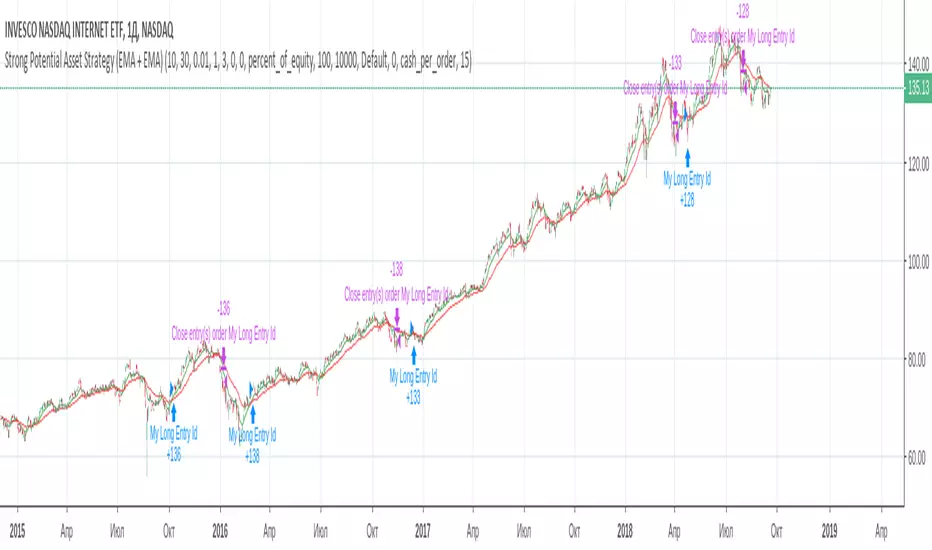
Strong Potential Asset Strategy (EMA + EMA)During experiments with the market, I found out that simple strategy is the best solution. However, I decided to bring some of my ideas on the 2 MA strategy.
- Instead of SMA - there will be 2 EMA, so the strategy will be more sensitive to the latest data;
- There is an option, which regulates the difference between those 2 EMAs, this should protect us from false trend enter;
- There is an option "Exit tolerance", which regulates how much could be the difference between 2 EMAs after crossover. This supposed to protect us from the false trend exit.
Hope this will be helpful :)