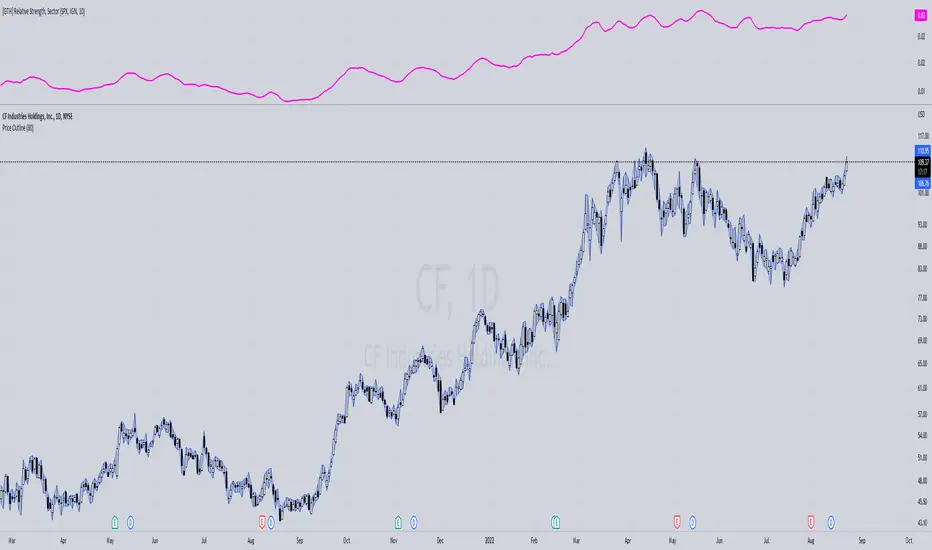
Introduction : Compared to the TIS v1.0, this "light" version is simpler to use and to understand, hence it will suits the basic needs of traders and investors looking for a clear and user friendly indicator to assess the current trend situation for continuous markets. The settings allow an adaptation for call markets, but more backtesting needed at your...
A RSI implementation tailored for a specific use case. Instead of using RSI with oversold and overbought values, I use it as a median value. If the RSI is above 50, the trend is bullish. If the RSI is below 50, the trend is bearish. This indicator is customized to help you easily identify market strength/weakness based on which side of the median value the RSI is.
Introduction : The TIS takes price action, volume and volatility, to : - provite a clear and easy to interpret global picture on the current trend siuations - give hints for good take profit and exit points (see local consolidation line) - help find support and resistance levels - assess trend strength and momentum Disclaimer : The Trend Insight System...
I created this script to compare cryptocurrencies that tend to be correlated, but it could also be used for forex or any other market. It is a fairly simple concept and compares price of each symbol to the specified period ema. This is helpful for tracking highly correlated symbols and visualizing moments when they are out of sync, perhaps signaling good times...
Trend Power Index measures the power of a given trend relative to its past strength. Increasing values indicate strengthening of an upward trend or weakening of a downward trend Decreasing values indicate strengthening of a downward trend or weakening of an upward trend. Crossing zero is a confirmation of trend initiation in the respective direction ...
Summary ========== This script plots a "momentum based" stepping Moving Average of various types - the idea is to visualize price moves in levels (or steps) to reduce "chart noise" - avoid getting caught in sideway moves - and enable better trade entry and exit decision. How does the MoStep_MA Work: ============================= - we first choose a "base MA" of...
NVME Currency Strength Pro was made to help confirm the trends, to help stay in winning positions longer and to help you get out of losing trades sooner. So why is ours unique? The answer is simple, unlike other currency strength indicators, ours loads in 2 seconds rather than 15 seconds or longer, which will cause less frustration when changing settings. Also, we...
Combines EMA + RSI indicator Dieses Script ist eine einfache Kombination aus RSI und EMA. Es erlaubt euch zu erkennen in welche Richtung der Trend in dem aktuellen TimeFrame geht und wie stark dieser aktuell ist. Außerdem zeigt es euch ob gerade eher die Bullen oder die Bären den Markt dominieren. Mit Hilfe des Indikators lassen sich Top und Bottom des...
How to use Alpha(α)? If Alpha is positive the stock outperforms, if the value is negative means the stock underperforms. α < 0: The investment has earned too little for its risk (or, was too risky for the return) α = 0: The investment has earned a return adequate for the risk taken α > 0: The investment has a return in excess of the reward for the assumed risk ...
This was the result of quite some time spent examining how much information could be gleamed by studying the interactions between Keltner Channels, STARC Bands and Bollinger Bands. I was surprised by the results. First of all, there are four fills that are black. Set the transparency of those to 0 and you'll see this indicator the way that it's meant to be seen....
Draws all sorts of useful information directly onto the Chart Moving Average Ribbon with configurable offsets Allows you to easily visualize MA Crossovers Easy to view in the Data Window RSI Indicator (Overbought, Oversold, Healthy) Stochastic RSI Volume Oscillator (Bullish, Bearish, Healthy) Rate of Change Indicator Compare Symbol without...
Compare the strength of the assets: ALTPERP MIDPERP SHITPERP ETH BTC on the FTX echange. If the timeframe is < 1hr the indicator resets every funding round (8 hrs) If the timeframe is > 1hr the indicator resets every week
This indicator consists of two lines. One is a gray line (USD) and the asset indicator is green or red. The basis of this indicator is the true strength indicator (TSI) with parameters 5,15. Both line sets are based on a TSI (5,15). The lookback period is for new highs / new lows. Default value is 200 periods. GREEN/RED LINE The first that is green and red is...
This is a quick indicator i wrote to inspect the strength of price movement and show when what i consider to be "a quality trend" has been established. the code is open and commented - the "math concept" is really simple and i'm not sure if this has already been coded before :) - my apologies if it was. my main goal was to identify opportunities to establish...
User request. A tuned version of the built-in True Strength Index (TSI) indicator with the following options included: TSI - Signal Histogram TSI/Signal Crossovers TSI/Signal Ribbon Bands breakouts highlighting Zero line crossovers background
Relative Strength line which shows a blue dot for new 52 week Relative Strength highs.
This is a strange experimental strategy WIP that I decided to upload an early version to share some of what I am working on. Just one script of a few. It combines Chande Momentum with RMI and some weird ones I am experimenting with - Triple Hull MA RSI, Double Exponential + Volume Weighted RSI, Triple Exponential RSI. And to top it off, a final oscillator that...