Golden Vector Trend Orchestrator (GVTO)Golden Vector Trend Orchestrator (GVTO) is a composite trend-following strategy specifically engineered for XAUUSD (Gold) and volatile assets on H4 (4-Hour) and Daily timeframes.
This script aims to solve a common problem in trend trading: "Whipsaws in Sideways Markets." Instead of relying on a single indicator, GVTO employs a Multi-Factor Confluence System that filters out low-probability trades by requiring alignment across Trend Structure, Momentum, and Volatility.
🛠 Methodology & Logic
The strategy executes trades only when four distinct technical conditions overlap (Confluence). If any single condition is not met, the trade is filtered out to preserve capital.
1. Market Structure Filter (200 EMA)
Indicator: Exponential Moving Average (Length 200).
Logic: The 200 EMA acts as the baseline for the long-term trend regime.
Bullish Regime: Price must close above the 200 EMA.
Bearish Regime: Price must close below the 200 EMA.
Purpose: Prevents counter-trend trading against the macro direction.
2. Signal Trigger & Trailing Stop (Supertrend)
Indicator: Supertrend (ATR Length 14, Factor 3.5).
Logic: Uses Average True Range (ATR) to detect trend reversals while accounting for volatility.
Purpose: Provides the specific entry signal and acts as a dynamic trailing stop-loss to let profits run while cutting losses when the trend invalidates.
3. Volatility Gatekeeper (ADX Filter)
Indicator: Average Directional Index (Length 14).
Threshold: > 25.
Logic: A high ADX value indicates a strong trend presence, regardless of direction.
Purpose: This is the most critical filter. It prevents the strategy from entering trades during "choppy" or ranging markets (consolidation zones) where trend-following systems typically fail.
4. Momentum Confirmation (DMI)
Indicator: Directional Movement Index (DI+ and DI-).
Logic: Checks if the buying pressure (DI+) is physically stronger than selling pressure (DI-), or vice versa.
Purpose: Ensures that the price movement is backed by genuine momentum, not just a momentary price spike.
📋 How to Use This Strategy
🟢 LONG (BUY) Setup
A Buy signal is generated only when ALL of the following occur simultaneously:
Price Action: Price closes ABOVE the 200 EMA (Orange Line).
Trigger: Supertrend flips to GREEN (Bullish).
Strength: ADX is greater than 25 (Strong Trend).
Momentum: DI+ (Plus Directional Indicator) is greater than DI- (Minus).
🔴 SHORT (SELL) Setup
A Sell signal is generated only when ALL of the following occur simultaneously:
Price Action: Price closes BELOW the 200 EMA (Orange Line).
Trigger: Supertrend flips to RED (Bearish).
Strength: ADX is greater than 25 (Strong Trend).
Momentum: DI- (Minus Directional Indicator) is greater than DI+ (Plus).
🛡 Exit Strategy
Stop Loss / Take Profit: The strategy utilizes the Supertrend Line as a dynamic Trailing Stop.
Exit Long: When Supertrend turns Red.
Exit Short: When Supertrend turns Green.
Note: Traders can also use the real-time P/L Dashboard included in the script to manually secure profits based on their personal Risk:Reward ratio.
📊 Included Features
Real-Time P/L Dashboard: A table in the top-right corner displays the current trend status, ADX strength, and the Unrealized Profit/Loss % of the current active position.
Smart Labeling: Buy/Sell labels are coded to appear only on the initial entry trigger. They do not repaint and do not spam the chart if the trend continues (no pyramiding visualization).
Visual Aids: Background color changes (Green/Red) to visually represent the active trend based on the Supertrend status.
⚠️ Risk Warning & Best Practices
Asset Class: Optimized for XAUUSD (Gold) due to its high volatility nature. It also works well on Crypto (BTC, ETH) and Major Forex Pairs.
Timeframe: Highly recommended for H4 (4 Hours) or D1 (Daily). Using this on lower timeframes (M5, M15) may result in false signals due to market noise.
News Events: Automated strategies cannot predict economic news (CPI, NFP). Exercise caution or pause trading during high-impact economic releases.
Supertrend

SuperSqueeze 2.0 - Supertrend Indicator with Buy/Sell SignalsSuperSqueeze 2.0 — Supertrend Indicator with Buy/Sell Signals
A clean, customizable Supertrend indicator for identifying trend direction and reversal points. Uses ATR-based dynamic support/resistance levels that trail price action.
HOW IT WORKS:
- Green line = Uptrend (price above support)
- Red line = Downtrend (price below resistance)
- Buy/Sell labels appear on trend flips
FEATURES:
- Adjustable ATR period and multiplier (default: 10, 3.0)
- Two ATR calculation methods (standard or SMA-based)
- Optional trend highlighting fill
- Built-in alerts for trend changes
BEST FOR:
- Trend following entries and exits
- Trailing stop-loss placement
- Filtering trades in the dominant direction
- Works on any timeframe and instrument (futures, stocks, crypto, forex)
DEFAULT SETTINGS: ATR 10, Multiplier 3.0 — adjust multiplier higher for fewer signals, lower for more sensitivity.
DM for access

SuperSqueeze - Supertrend & Squeeze Momentum Strategy for MNQA systematic day trading strategy combining two powerful indicators: Supertrend (ATR-based trend following) and Squeeze Momentum (Bollinger Bands/Keltner Channel compression). Designed for MNQ, NQ, and other futures contracts seeking consistent daily profits.
Core Strategy Logic: Entries trigger on Supertrend flips when confirmed by strong directional momentum (customizable threshold, default ±30). A built-in 5-point scoring system filters setups by quality—only high-probability trades (Score 4-5) execute by default.
Key Features:
* Momentum Threshold Filter — Blocks weak, choppy signals below your minimum momentum requirement
* Session Time Filter — Trade only during your preferred market hours with timezone offset support
* Midday Chop Filter — Automatically blocks entries during low-conviction lunch hours (12:00–1:30 PM EST)
* Daily Profit Target — Auto-closes positions and stops trading when session target is reached
* Session Start Entry — Enters immediately if trend is already established at session open
* Debug Mode — Visual labels explain exactly why entries were blocked (momentum, time, score, etc.)
* Squeeze Detection — Plots squeeze status (in squeeze, released, none) for visual confirmation
Optimized Settings: Supertrend: ATR 10, Multiplier 3.0 Squeeze: BB Length 20, KC Length 20 Fully customizable via inputs.
Best For:
* Futures day traders (MNQ, NQ, ES, MES)
* Momentum-based systematic trading
* Traders seeking rule-based entries with clear stop-loss (Supertrend line)
* Prop firm traders managing daily drawdown limits
Execution Notes: Entries execute on candle close (not intrabar) for realistic backtesting. Exits occur on opposing Supertrend flip, session end, or profit target—whichever comes first.

Next Candle PredictorAdvanced TradingView Indicator for Precise Buy and Sell Signals
Overview:
The Predicta Futures - Next Candle Predictor is a cutting-edge TradingView indicator designed to forecast the next candle's direction in futures and cryptocurrency markets. Leveraging a multi-indicator confluence strategy, this tool provides traders with actionable long and short prediction percentages, enhanced by dynamic ADX-based thresholds and visual projection candles. Ideal for scalping, day trading, or swing trading on platforms like MEXC or Binance futures, it combines Supertrend, MACD, RSI, Stochastic, ADX, and volume analysis to deliver high-probability buy and sell signals while minimizing false positives.
Key Features:
• Multi-Indicator Confluence Scoring:
Integrates Supertrend for trend direction, EMAs (8, 21, 50) for alignment, MACD for momentum crossovers, RSI for overbought/oversold conditions, Stochastic for divergence detection, ADX for trend strength, and volume ratios for confirmation. A customizable confluence score (0-6) ensures signals meet user-defined criteria, reducing whipsaws in volatile markets.
• Dynamic Prediction Thresholds:
ADX-driven adjustments lower the required prediction percentage (e.g., 60% in strong trends) for "PERFECT TIME" entries, adapting to market conditions like ranging or trending phases.
• Visual Analysis Table:
A sleek, color-coded dashboard displays progress bars for each indicator, prediction percentages, and status (e.g., "PERFECT TIME" or "WAIT"). Supports long and short analyses with intuitive ASCII bars for quick scans.
• Projection Candles:
Simulates potential next-candle outcomes with volatility-scaled (via Bollinger Bands width) green long and red short candles, aiding in visualizing price targets.
• Buy/Sell Signals and Alerts:
Generates labeled "BUY" and "SELL" arrows on EMA crossovers within confirmed trends, with separate alerts for basic signals and high-confluence "PERFECT TIME" opportunities.
• Customizable Inputs:
Adjust ATR periods, Supertrend factors, minimum confluence scores, and volume ratios to tailor the indicator for stocks, forex, or crypto perpetual futures.
How It Works:
This TradingView script calculates long and short scores using weighted contributions from key indicators, normalizing them into prediction percentages. A confluence check—factoring trend, EMA alignment, MACD, Stochastic, volume, and ADX—triggers "PERFECT TIME" only when conditions align robustly. For example:
• In a downtrend (Supertrend red), with bearish MACD and Stochastic, and sufficient volume, the indicator highlights short opportunities.
• Dynamic thresholds ensure aggressive entries in strong trends (ADX >25) and conservative ones in weak trends.
• Backtested for reliability, it excels in identifying reversals and continuations, making it a must-have for traders seeking an edge in futures trading strategies.
Usage Instructions:
1. Add the indicator to your TradingView chart. (Search: Next Candle Predictor)
2. Customize settings via the inputs panel (e.g., set minConfluence to 5 for stricter signals).
3. Monitor the analysis table for predictions and confluence scores.
4. Act on "BUY/SELL" labels or "PERFECT TIME" alerts, combining with your risk management.
5. Enable projection candles for visual forecasting of the next bar.
Compatible with all timeframes, from 1-minute scalping to daily swings. Note: This is not financial advice; always verify signals with additional analysis.
Join thousands of traders enhancing their strategies—add it to your charts today and elevate your trading performance!
Please rate and review if it boosts your trades!
Thank you!

SuperBandsThis script combines two of the most powerful trading tools into a single indicator: Supertrend for trend following and Bollinger Bands for volatility analysis. This combo allows you to save your limited indicator slots on TradingView while keeping your chart clean.

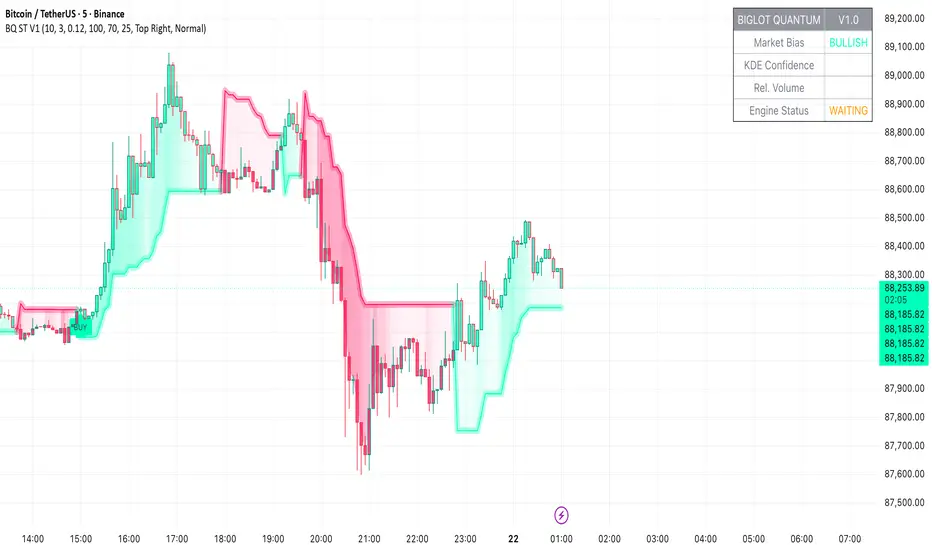
BigLot Quantum SuperTrend V1BigLot Quantum SuperTrend V1 is a trend-following indicator that enhances the traditional SuperTrend by integrating statistical volume analysis.
The script combines an ATR-based SuperTrend engine with Kernel Density Estimation (KDE) applied to relative buy and sell volume. Volume behavior is modeled statistically, allowing the indicator to filter breakout signals and activate only when volume conditions show high probability compared to historical data.
Bullish and bearish signals are generated when price crosses the SuperTrend line and the corresponding volume probability exceeds a user-defined threshold. This approach helps reduce false signals during low-liquidity or sideways market conditions.
The script includes visual trend highlighting, probability-based confidence filtering, and a real-time dashboard displaying trend direction, volume strength, and signal status. It is designed to work across all markets and timeframes without repainting.
AI Chakra for Global Markets by Pooja🔮 AI Chakra for Global Markets — by Pooja
Invite-Only | Rule-Based Market Structure & Momentum Indicator
🔹 What this indicator actually does
AI Chakra is a rule-based indicator that generates Auto Buy / Auto Sell signals
only when predefined rules across trend, momentum, volatility and structure are satisfied together.
It is not a simple RSI, EMA or SMC indicator, and it is not a visual mash-up.
Each component has a fixed role, and no signal is allowed unless all required rules pass.
🟢 AUTO BUY / 🔴 AUTO SELL — How signals are generated
BUY signal is allowed ONLY when ALL rules below are true on candle close:
Trend Rule
Price above EMA trend structure
EMA alignment confirms bullish bias
Fair-Price Rule
Price above VWAP (no buy below VWAP)
Momentum Rule
RSI above its moving average
RSI–RSI-MA distance above minimum threshold
RSI-MA slope positive (flat momentum blocked)
Volatility Rule
ADX confirms market strength
ATR confirms sufficient price movement
Low-energy / sideways markets are ignored
Structure Rule
Market structure is valid (BOS or active CHoCH context)
No buy allowed against recent structure shift
Candle Confirmation Rule
Signal triggers only after candle close
No intrabar or repaint signals
If any single rule fails → NO BUY SIGNAL.
SELL signal follows the same rules in the opposite direction.
🧠 What “AI” means here (no hype, no prediction)
“AI” in this indicator does NOT mean machine learning or prediction.
It refers to:
Multi-rule decision logic
State-based signal control
Conditional signal rejection
Context-aware validation instead of single-condition triggers
👉 The indicator decides whether a signal is allowed or rejected, similar to a rule engine.
📉 Fake Breakout Protection (Core Purpose)
This indicator is specifically designed to avoid fake breakouts.
Fake signals are blocked using:
RSI distance + slope filter
ADX strength validation
ATR volatility requirement
VWAP position filter
Structure (BOS / CHoCH) alignment
Low-volume, sideways and weak momentum moves are intentionally ignored.
🧱 Market Structure (SMC) — How it is used
Break of Structure (BOS)
Detected using swing highs / lows
Confirms continuation of current trend
Used as structure validation, not as a trade trigger
Change of Character (CHoCH)
Detected when price breaks previous structure
Marks possible trend shift
Remains valid only for limited bars
⚠️ BOS / CHoCH do not generate trades alone.
They only allow or block signals from the main engine.
🔁 Partial Signals — Why they exist
Instead of only final Buy/Sell, the indicator shows Partial Signals:
CHoCH + RSI
EMA + VWAP + RSI
EMA + VWAP + Supertrend + RSI
Breakout structure (RSI intentionally excluded)
Partial signals:
Do not mean trade entry
Show which rules are already satisfied
Help traders track setup development
📍 Support & Resistance (Context Only)
Traditional Pivot Points
Multi-timeframe calculation (Daily / Weekly / Monthly)
Optional price labels
Pivot levels:
Never generate signals
Used only as support / resistance reference
📐 Trendline Module (Optional)
Trendlines drawn from swing points
ATR / Std-Dev / Regression-based slope
Extended forward for interaction zones
Trendlines are contextual, not breakout triggers.
⚙️ Trading Modes (Different rule handling)
Intraday Mode
Direction resets daily
Prevents repeated same-side signals in one session
Positional Mode
Direction stays active until opposite structure appears
No daily reset
Logic is different internally — not cosmetic.
🔔 Alerts
Auto Buy / Auto Sell alerts
Partial alerts available
Candle-close only
Non-repainting
Webhook compatible
🔒 Why Invite-Only
The script uses:
Stateful signal logic
Multi-rule validation
Structure-based filters
Partial-to-confirmed signal flow
Source is restricted to protect these mechanisms.
⚠️ Disclaimer
This indicator is for educational and analytical use only.
It does not provide financial advice or trade recommendations.
Risk management is the user’s responsibility.

AI Intraday Astra by Pooja v27📘 AI Intraday Astra v27
Invite-Only Intraday Indicator for Option Traders
🔍 What this indicator does (Purpose)
AI Intraday Astra v27 is a rule-based intraday signal-filtering indicator designed to reduce false breakouts, repeated entries, and low-energy trades commonly faced by option traders.
Unlike traditional indicators that generate frequent signals, this script focuses on signal validation and rejection, producing trades only when multiple market conditions align on the same confirmed candle.
⭐ What makes this indicator ORIGINAL
This script is not a simple combination of indicators.
It uses a state-based decision architecture, where signals are allowed only after passing multiple sequential checks and internal reset rules.
Key originality points:
Independent BUY and SELL engines (no shared oscillator state)
State tracking to control signal eligibility
Reset-based logic after every signal
Multi-layer filtering instead of single-condition triggers
This design differentiates it from standard RSI, EMA, or Supertrend-based scripts.
⚙️ Core Features (Explained Clearly)
🔹 Auto BUY / SELL Signals (Confirmed Only)
Signals trigger only after candle close and only when all filters align.
No intrabar repainting or blinking signals.
🔹 Dual RSI Engine (Buy & Sell Separation)
Separate RSI + RSI-MA logic for Buy and Sell
Minimum RSI-MA distance filter
Directional slope validation
Signal gap control
➡️ Prevents mixed or weak momentum signals.
🔹 ADX + ATR Volatility Filter
ADX confirms directional strength
ATR confirms sufficient intraday volatility
➡️ Blocks signals during sideways or low-energy markets.
🔹 EMA + VWAP Trend Alignment
BUY only above EMA & VWAP
SELL only below EMA & VWAP
➡️ Avoids counter-trend option entries.
🔹 Trendline-Based Structure Filter
Dynamic trendlines derived from swing highs/lows
Optional slope modes (ATR / Stdev / Linear Regression)
Signals allowed only near relevant structure
➡️ Prevents chasing overextended prices.
🔹 Pivot Points (Support & Resistance Context)
Traditional pivot levels
Multi-timeframe calculation
Optional price labels
➡️ Used for context, not direct signal generation.
🔹 Reset & Anti-Overtrading Logic
After a signal:
Price must break and re-accept across EMA
Minimum bars enforced between same-side signals
➡️ Controls over-trading in strong trends.
🔹 Session Filter
Optional disabling of signals during selected intraday time windows
(e.g. noisy market open).
🧠 About “AI”
This script does not use machine learning or prediction models.
“AI” refers to a rule-based decision system that evaluates multiple market conditions together and allows a signal only when all rules remain valid until candle close.
🔔 Alerts
BUY / SELL alerts on confirmed signals only
Webhook-compatible
No repaint behavior
👤 Who this is for
Intraday option traders
Traders who prefer quality over quantity
Rule-based and confirmation-driven setups
🔒 Why Invite-Only
The script contains internal state management, reset logic, and independent signal engines that go beyond standard indicator combinations.
Source access is restricted to protect this implementation.
⚠️ Disclaimer
This indicator is for educational and analytical purposes only.
It does not provide financial advice or profit guarantees.
Users are responsible for their own risk management.

SIDD EMA RSI Supertrend Signal Table🔥 SIDD EMA RSI SuperTrend Multi-Timeframe Signal Table
**SIDD EMA RSI SuperTrend Signal Table** is a **clean, powerful multi-timeframe trend confirmation dashboard** designed for traders who want **clarity, confluence, and speed** — all in one glance.
This indicator **does NOT repaint** and uses **industry-standard trend logic** combining **EMA structure, RSI momentum, and SuperTrend direction** across **6 different timeframes**.
---
## 🧠 Core Logic Behind the Indicator
This script works on **three independent trend engines**, displayed together in a compact table:
### ✅ 1️⃣ EMA Trend (Structure Based)
* Uses **EMA 50 vs EMA 200**
* **Bullish** → EMA 50 above EMA 200
* **Bearish** → EMA 50 below EMA 200
* Captures **primary market structure**
### ✅ 2️⃣ RSI Trend (Momentum Based)
* RSI Length: **14**
* **Bullish** → RSI > **55**
* **Bearish** → RSI ≤ **55**
* Helps confirm **trend strength & momentum**
### ✅ 3️⃣ SuperTrend (Price Action Based)
* ATR Length: **10**
* Factor: **3.0**
* Clearly defines **trend direction & trailing bias**
* Excellent for **entry & exit alignment**
---
## ⏱️ Multi-Timeframe Coverage
The table analyzes trends across **6 configurable timeframes**:
* Intraday → **5m, 15m, 1H**
* Swing → **4H, Daily**
* Positional → **Weekly**
Each timeframe shows:
* 📈 EMA Trend
* 📊 RSI Trend
* 🔁 SuperTrend Direction
Color-coded for instant readability:
* 🟢 Bullish
* 🔴 Bearish
* ⚪ Neutral
---
## 🎯 How to Use This Indicator
✔ **Trend Trading**
Trade only when **EMA + RSI + SuperTrend align** across higher & lower timeframes.
✔ **Intraday Confirmation**
Use higher TF (1H / 4H) bias and take entries on lower TF.
✔ **Avoid Chop & False Signals**
If signals are mixed → market is likely **sideways or risky**.
✔ **Swing & Positional Trades**
Daily + Weekly alignment gives **high-probability setups**.
---
## ⚙️ Customization Options
* Adjustable **timeframes**
* Table **position** (Top/Bottom – Left/Right)
* Table **size** (Extra Small / Small / Normal)
* Custom **colors, borders & text**
* Optimized for **minimal chart clutter**
---
## ⚠️ Disclaimer
This indicator is a **trend confirmation & decision-support tool**.
Always combine with **price action, support/resistance, and proper risk management**.

Trend Fusion Indicator🎯 Trend Fusion Indicator🎯
Professional trading indicator combining EMA momentum with Supertrend volatility for high-probability signals.
📊KEY FEATURES:
• 9 EMA & Supertrend (10,3) crossover signals
• Visual trend direction with colored fills
• Buy/Sell arrows at crossover points
• Real-time trend tracking
• Clean, professional interface
⚡SIGNAL LOGIC:
✅ BUY: When EMA crosses ABOVE Supertrend
✅ SELL: When EMA crosses BELOW Supertrend
🎨VISUAL INDICATORS:
• Green Zone/Fill: Bullish trend (EMA > Supertrend)
• Red Zone/Fill: Bearish trend (EMA < Supertrend)
• Triangle Arrows: Entry signals
• Background Colors: Trend confirmation
⚙️CUSTOMIZABLE SETTINGS:
• EMA Length (Default: 9)
• Supertrend ATR Length (Default: 10)
• Supertrend Factor (Default: 3.0)
🔔ALERTS INCLUDED:
• Buy Alert: EMA crosses above Supertrend
• Sell Alert: EMA crosses below Supertrend
📈 BEST FOR:
• Swing Trading
• Day Trading
• Trend Following
• Market Reversals
⚠️ DISCLAIMER: This indicator is for educational purposes only.
Trading involves risk. Not financial advice. Use at your own risk.

SuperLazyTradeSuperLazyTrade transforms SuperTrend into a professional day-trading system with intelligent quality filtering.
Instead of showing every signal, it rates each setup on a 100-point scale analyzing:
- Signal Freshness - Catch moves early
- Volume Strength - Confirm momentum
- VWAP Alignment - Trade with institutions
- Volatility Regime - Optimal market conditions
- RSI Confirmation - Momentum validation
The system blocks 35-40% of low-quality signals automatically, enforcing discipline with clear verdicts:
✅ JUMP (80+) - Best setups
⚡ TRADE (65-79) - Strong entries
⚠️ CAUTION (55-64) - Proceed carefully
🟡 TREND (45-54) - Mid-trend opportunities
🔴 AVOID (0-44) - Skip it
Features live P&L tracking, professional 11-row dashboard, and anti-repainting architecture. Perfect for traders who value quality over quantity.
⚠️ DISCLAIMER
This indicator does not guarantee profits. Trading involves substantial risk of loss. Past performance is not indicative of future results. Use at your own risk.

Supertrend + MACD + HMAIndicator Description: Supertrend + MACD + HMA
General Summary
It is a composite technical indicator that combines three analysis tools to generate buy and sell signals in institutional trading. It uses confirmation from multiple indicators to increase the precision of market entries.
Components
1. Supertrend (ST)
Function: Identifies the main market trend (bullish or bearish)
Parameters: ATR Length 10, Factor 3.0
Visualization:
Green line = Bullish trend
Red line = Bearish trend
Semi-transparent green/red background that fills the area according to direction
How it works: Uses ATR (Average True Range) to calculate dynamic support and resistance bands
2. MACD (Moving Average Convergence Divergence)
Function: Measures price momentum and direction
Parameters: Fast 18, Slow 144, Signal Smoothing 9
Components:
MACD Line (orange): Difference between two EMAs
Signal Line (purple): EMA of the MACD
Histogram (green/red columns): Difference between MACD and its signal
Green = Positive histogram (bullish momentum)
Red = Negative histogram (bearish momentum)
3. HMA 100 (Hull Moving Average)
Function: Identifies support/resistance level and price direction
Parameters: Length 100
Visualization: Blue thick line
Characteristics:
Less lag than traditional moving averages
Price > HMA = Bullish trend
Price < HMA = Bearish trend
Signal Logic
🟢 BUY SIGNAL
Generated when ANY of these conditions is met:
Total Confluence:
MACD positive (histogram > 0)
Price above HMA 100
Supertrend in Bullish mode
Supertrend Change:
Supertrend changes from Bearish to Bullish
MACD remains positive
Price above HMA
Price Crossover:
Price crosses above HMA (at candle close)
Supertrend is in Bullish mode
MACD is positive
🔴 SELL SIGNAL
Generated when ANY of these conditions is met:
Total Confluence:
MACD negative (histogram < 0)
Price below HMA 100
Supertrend in Bearish mode
Supertrend Change:
Supertrend changes from Bullish to Bearish
MACD remains negative
Price Crossover:
Price crosses below HMA (at candle close)
Supertrend is in Bearish mode
MACD is negative
Important Features
✅ Single Signal Per Type
Once a BUY is generated, no other BUY is generated until a SELL appears
Avoids multiple entries in the same direction
✅ Crossover Detection
The indicator generates signals at candle close when price crosses HMA
Allows capturing quick market moves
✅ Trend Changes
Detects when Supertrend changes direction
Provides early exits from the market
✅ Automatic Alerts
Push notifications when BUY or SELL is generated
Ideal for automated trading

Trend Tracer [AlgoAlpha]🟠 OVERVIEW
This tool builds a two-stage trend model that reacts to structure shifts while also showing how strong or weak the move is. It uses a mid-price band (from the highest high and lowest low over a lookback) and applies two Supertrend passes on top of it. The first pass smoothens the basis. The second pass refines that direction and produces the final trail used for signals. A gradient fill between the two trails uses RSI of price-to-trail distance to show when price is stretched or cooling off. The aim is to give traders a simple way to read trend alignment, pressure, and early turns without guessing.
🟠 CONCEPTS
The script starts with a mid-range basis. This is the average of the rolling highest high and lowest low. It acts as a stable structure reference instead of raw close or typical price. From there, two Supertrend layers are applied:
• The first Supertrend uses a shorter ATR period and lower factor. It reacts faster and sets the main regime.
• The second Supertrend uses a slightly longer ATR and higher factor. It filters noise, waits for confirmed continuation, and generates the signal line.
The interaction between these trails matters. The outer Supertrend provides context by defining the broader regime. The inner Supertrend provides timing by flipping earlier and marking possible shifts. The gradient fill uses RSI of (close − supertrend value) to display when price stretches away from the trail. This shows strength, exhaustion, or compression within the trend.
🟠 FEATURES
Bullish and bearish flip markers placed at recent highs/lows
Rejection signals off the trend tracer line
Alerts for bullish and bearish trend changes
🟠 USAGE
Setup : Add the script to your chart. Timeframe is flexible; lower timeframes show more flips while higher ones give cleaner swings. Adjust Length to change how wide the basis range is. Use the two ATR settings and factors to match the volatility of the market you trade.
Read the chart : When the refined trail (stv_) sits above price the regime is bearish; when below, it is bullish. The wide trail (stv) confirms the larger move. Watch the gradient fill: darker colors appear when price is stretched from the trail and lighter colors appear when the move is weakening. Flip markers ▲ or ▼ highlight the first clean shift of the refined trail.
Settings that matter : Increasing the Main Factor slows main-trend flips and filters chop. Increasing the Signal Factor delays the timing trail but reduces noise. Shortening Length makes the basis more reactive. ATR periods change how sensitive each Supertrend pass is to volatility.

JP7FX Signals ProJP7FX Signals Pro
Smart session signals based on structure, liquidity shifts and volatility filters.
Designed for use on the 1 minute timeframe.
What this tool does
This indicator builds signals around three things traders track every day.
• session ranges for Asia, Frankfurt, London and New York
• Fair Value Gap behaviour
• Supertrend shifts with volatility confirmation
The script draws each session range on your chart. It tracks when price breaks a session high or low, then checks if the market is above or below the daily open. These conditions help filter trades by direction during different sessions.
It also detects bullish and bearish Fair Value Gaps. The script tracks when an FVG forms, when price enters the imbalance and when it gets mitigated. These checks create part of the signal logic.
Supertrend is used as an extra filter. A crossover above or below the Supertrend gives a directional bias. When combined with session behaviour and FVG conditions, the script can mark possible long or short signals during London or New York.
How the signals form
A signal only prints when the script has all conditions in place.
This includes:
• a session range break in the correct direction
• a price position relative to the daily open
• confirmation from Supertrend
• FVG creation or mitigation on the right side of price
• liquidity taken in previous sessions
These rules reduce noise and avoid signals that appear in weak conditions.
What the indicator is for
• understanding how sessions behave on the 1 minute chart
• tracking liquidity behaviour
• seeing when a clean break and trend shift takes place
• getting notified when the market forms the conditions you set
This is not a buy or sell system on its own
Signals do not replace analysis. You still need market structure, higher timeframe direction, orderblocks or your own trade model.
A signal is only a prompt to look at the chart, not a confirmation to enter a trade.
Price can shift quickly around sessions, so check the context before acting on any alert.
Important notes
• designed for the 1 minute timeframe
• signals do not guarantee trend continuation
• conditions can form in strong or weak market phases
• use your own risk rules and validation before entering trades
JP7FX Signals Pro helps you track session behaviour and FVG interaction more efficiently, but trading decisions still need your full chart process.

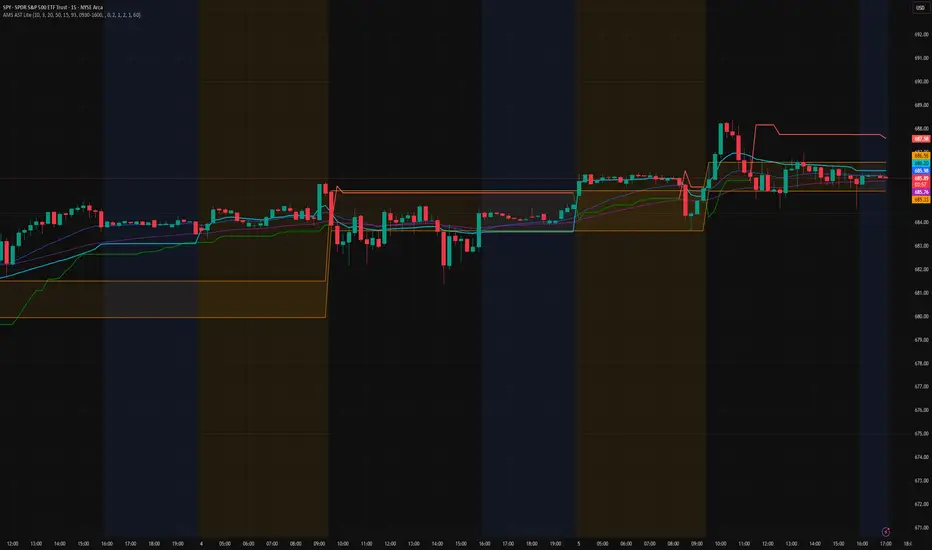
AMS Adaptive Supertrend Lite – ORB + VWAP 1.0AMS Adaptive Supertrend Lite – ORB + VWAP
This indicator focuses on providing a clean read of trend, structure, and opening range context without unnecessary complexity. It’s designed for traders who prefer straightforward visual tools that support their own decision-making process.
Consider this a small multi-tool for your basic ORB needs.
Included:
-Supertrend
A simple ATR-based Supertrend for directional context.
You can edit colors, line width, ATR settings, etc.
No signals or automation, just a clear trend reference.
-EMAs
Optional fast and slow EMAs for structural context.
Useful for gauging short-term momentum and slope.
-VWAP
A standard session VWAP.
You can style it however you like (solid, dashed, colored) in the Style tab.
-Opening Range (ORB)
Configurable ORB band including:
ORB duration (in minutes)
Optional RTH-only logic
Adjustable session window
Choice of timeframe used to build the ORB
Automatic hiding on higher timeframes (optional)
The ORB high/low are built on the selected lower timeframe and then displayed on the active chart.
-HTF Bias Shading (Optional)
A simple background tint based on EMA structure on a higher timeframe.
Meant to give gentle context, not trading signals.
Alerts
Two alerts are included:
Supertrend flipping bullish
Supertrend flipping bearish
These are notifications, not calls to action.
Intended Use
This is a visual tool for traders who want clear structure and context on their chart.
It does not provide entries, exits, strategies, or automated logic.
Disclaimer
This script is for educational and informational purposes only.
It is not financial advice, and no performance is guaranteed.
Always test tools for yourself and use proper risk management.
Strategy: HMA 50 + Supertrend SniperHMA 50 + Supertrend Confluence Strategy (Trend Following with Noise Filtering)
Description:
Introduction and Concept This strategy is designed to solve a common problem in trend-following trading: Lag vs. False Signals. Standard Moving Averages often lag too much, while price action indicators can generate false signals during choppy markets. This script combines the speed of the Hull Moving Average (HMA) with the volatility-based filtering of the Supertrend indicator to create a robust "Confluence System."
The primary goal of this script is not just to overlay two indicators, but to enforce a strict rule where a trade is only taken when Momentum (HMA) and Volatility Direction (Supertrend) are in perfect agreement.
Why this combination? (The Logic Behind the Mashup)
Hull Moving Average (HMA 50): We use the HMA because it significantly reduces lag compared to SMA or EMA by using weighted calculations. It acts as our primary Trend Direction detector. However, HMA can be too sensitive and "whipsaw" during sideways markets.
Supertrend (ATR-based): We use the Supertrend (Factor 3.0, Period 10) as our Volatility Filter. It uses Average True Range (ATR) to determine the significant trend boundary.
How it Works (Methodology) The strategy uses a boolean logic system to filter out low-quality trades:
Bullish Confluence: The HMA must be rising (Slope > 0) AND the Close Price must be above the Supertrend line (Uptrend).
Bearish Confluence: The HMA must be falling (Slope < 0) AND the Close Price must be below the Supertrend line (Downtrend).
The "Choppy Zone" (Noise Filter): This is a unique feature of this script. If the HMA indicates one direction (e.g., Rising) but the Supertrend indicates the opposite (e.g., Downtrend), the market is considered "Choppy" or indecisive. In this state, the script paints the candles or HMA line Gray and exits all positions (optional setting) to preserve capital.
Visual Guide & Signals To make the script easy to interpret for traders who do not read Pine Script, I have implemented specific visual cues:
Green Cross (+): Indicates a LONG entry signal. Both HMA and Supertrend align bullishly.
Red Cross (X): Indicates a SHORT entry signal. Both HMA and Supertrend align bearishly.
Thick Line (HMA): The main line changes color based on the trend.
Green: Bullish Confluence.
Red: Bearish Confluence.
Gray: Divergence/Choppy (No Trade Zone).
Thin Step Line: This is the Supertrend line, serving as your dynamic Trailing Stop Loss.
Strategy Settings
HMA Length: Default is 50 (Mid-term trend).
ATR Factor/Period: Default is 3.0/10 (Standard for trend catching).
Exit on Choppy: A toggle switch allowing users to decide whether to hold through noise or exit immediately when indicators disagree.
Risk Warning This strategy performs best in trending markets (Forex, Crypto, Indices). Like all trend-following systems, it may experience drawdown during prolonged accumulation/distribution phases. Please backtest with your specific asset before using it with real capital.

Hash SupertrendHash Supertrend is a visually enhanced Supertrend-based indicator designed by Hash Capital Research, tuned specifically for crypto trend trading on Solana (SOL) and Bitcoin (BTC). It combines institutional-style color coding, an optional session time filter, and production-ready alerts for systematic and discretionary traders alike.
What This Indicator Is
Hash Supertrend is a trend-following volatility band indicator built on TradingView’s native ta.supertrend() function.
It’s optimized and visually styled for:
High-volatility crypto pairs (especially SOL/USDT, SOL/USD, BTC/USDT, BTC/USD)
Timeframes typically used by crypto traders (from 5m scalping to 4H swing and 1D trend following)
The script is an indicator, not a strategy:
It does not place trades or show backtest results.
It provides clear trend states, flips, and alerts that you can plug into your own execution stack or manual trading.
Key Features
✅ Tuned for Crypto (Solana & Bitcoin)
Parameters are chosen to respond well to the volatility profile of SOL and BTC, reducing noise while still catching strong moves.
✅ Non-repainting Supertrend Core
Uses TradingView’s built-in ta.supertrend — values may move intrabar as the bar forms, but once a bar closes, the historical line and signals do not repaint.
✅ Fluorescent Trend Visualization
Bright green for bullish phases
Bright red for bearish phases
Adaptive color intensity based on user setting
✅ Glow Layer & Trend Zones
Glow effect around the Supertrend line for instant visual recognition
Optional filled zones between price and line for “trend cloud” style visualization
✅ Time Filter (Session Control)
Option to only mark signals during specific hours for those wanting to integrate with webhooks
Designed for traders who avoid certain sessions (e.g., low-liquidity hours)
✅ Signal Dots & Alerts
Tiny green dots for bullish flips
Tiny red dots for bearish flips
Professional, preconfigured alerts for:
Long Entry
Short Entry
Any Trend Change
Filtered signals outside trading hours (for monitoring only)
The core logic is built on:
ATR Length (ATR Length) Default: 16
Lower values (7–10): more sensitive, more signals, more noise
Higher values (12–20): smoother, fewer but stronger trend signals
Factor (Factor) Default: 3.11
Lower values (1.5–2.5): tighter bands, earlier entries, higher whipsaws
Higher values (3.0–4.0+): wider bands, later entries, stronger trend confirmation
The indicator reads direction from ta.supertrend and classifies:
Bullish Trend: direction < 0
Bearish Trend: direction > 0
A trend flip happens when direction changes sign:
longSignal: Supertrend flips from above price to below price (bearish → bullish)
shortSignal: Supertrend flips from below price to above price (bullish → bearish)

AMS Adaptive Supertrend - v1.0The ATMOS MARKET SUITE (AMS) Adaptive Supertrend is a volatility-responsive trend framework designed to keep structural context clear across changing market conditions. It expands on the traditional Supertrend by incorporating ATR percentiles, regime detection, and optional higher-timeframe and VWAP overlays.
Instead of issuing buy/sell signals, this tool helps traders understand trend direction, structural stability, volatility environment, and potential transitions. Its adaptive architecture allows the Supertrend to remain steady during chop while responding more dynamically during strong expansions.
Best Uses
• Identifying clear structural trend during intraday trading
• Filtering for aligned conditions before trend continuation setups
• Understanding volatility regimes (compressed vs expanding)
• Monitoring HTF structural influence on lower-timeframe trades
• Using as a standalone trend backbone or as part of the full ATMOS MARKET SUITE suite
This indicator provides context, not predictions. It is fully functional on its own and also integrates naturally with the Momentum Engine, Consensus Strip, and Cx3 ORB system.

SuperTrend Oscillator [ChartPrime]⯁ OVERVIEW
The SuperTrend Oscillator is a hybrid momentum–trend indicator that transforms the classic SuperTrend into a full-strength oscillator.
Instead of simply plotting SuperTrend direction on the chart, this tool measures the distance between price and SuperTrend, normalizes it by volatility, and converts it into a dynamic oscillator that highlights trend strength, momentum extremes, and high-precision reversal points.
⯁ CONCEPTS
SuperTrend Engine: The indicator extracts the SuperTrend baseline and direction using ATR-based volatility. This acts as the core structure from which the oscillator is built.
Volatility-Adjusted Oscillation: (close − SuperTrend) is divided by ATR to standardize momentum across all markets and timeframes.
Adaptive Oscillator Types: The signal can be transformed using HMA, EMA, or SMA smoothing for varying responsiveness.
Momentum Extremes: Values above +1.7 or below −1.7 signal stretched price conditions where reversals are more likely.
Reversal Logic: The oscillator compares its current value with its value three bars ago. Large positive or negative pivots indicate momentum shifts.
⯁ FEATURES
Trend-Colored SuperTrend Line
The SuperTrend line shifts color based on direction, giving immediate context for oscillator readings.
Full Oscillator Transformation
Converts price–SuperTrend distance into a normalized oscillator, showing when momentum is expanding, contracting, or reaching exhaustion.
Gradient Momentum Coloring
The oscillator line and candles are colored using a two-sided gradient:
• Red tones for bearish momentum
• Orange/cream tones for bullish momentum
• Gray tones for low momentum
This makes strength visually intuitive.
Extreme Zones (±1.7 Bands)
Built-in upper and lower thresholds highlight zones where price is statistically overextended.
Dual Fill Layers
The area above/below zero is filled in different colors to emphasize bullish or bearish oscillator regime.
Reversal Diamonds
The script highlights significant reversals when:
• Momentum shifts downward from high values (bearish pivot)
• Momentum shifts upward from deep lows (bullish pivot)
These diamonds help pinpoint exhaustion-based turning points.
⯁ HOW TO USE
Identify Trend Strength:
A rising oscillator above 0 confirms bullish SuperTrend conditions; falling below 0 confirms bearish ones.
Spot Momentum Extremes:
Readings above +1.7 or below −1.7 often signal overextended price moves.
Use Reversal Diamonds as Pivot Alerts:
Diamond markers indicate high-probability turning points when momentum sharply reverses from extreme zones.
Confirm Trend Shifts with Color Changes:
Candle and oscillator colors shift based on momentum direction, providing clean visual alignment with SuperTrend direction.
Combine with Structure or OB Zones:
Reversal signals become more reliable when they occur at key S/R, order blocks, or liquidity sweeps.
⯁ CONCLUSION
The SuperTrend Oscillator modernizes the SuperTrend by transforming it into a volatility-aware oscillator with clear reversal markers, trend coloring, and momentum normalization.
This tool is ideal for traders who want both trend context and precise timing signals, blending SuperTrend’s reliability with the dynamics of a professional-grade momentum oscillator.

TrendSight📌 TrendSight — The All-in-One Multi-Timeframe Trend Engine
Key Features & Logic
Multi-Timeframe Trend Confirmation:
Entries are filtered by confirming bullish/bearish alignment across three distinct Supertrend timeframes (e.g., 5-min, 15-min, 45-min, etc.), combined with an EMA and volatility filter, to ensure high-conviction trades that's a powerful combination! Designing the entire strategy around the 15-minute timeframe (M15) and focusing on high-volatility coins maximizes the strategy's effectiveness .
Guaranteed Single-Entry per Signal:
The strategy uses a powerful manual flag and counter system to ensure trades fire only once when a new signal begins. It absolutely prevents immediate re-entry if the signal remains true, waiting instead for the entire trend condition to reset to false.
Dynamic Trailing Stop Loss:
The Stop Loss is set to a moving Supertrend line (current_supertrend), ensuring tight risk management that trails the price as the trade moves into profit.Guaranteed Take Profit (4% Run-up): Uses a precise Limit Order via strategy.exit() to capture profits instantly at a 4% run-up. This ensures accurate profit capture, even on sudden spikes (wicks).
Automated Risk Management:
Position size is dynamically calculated based on a fixed risk percentage (default 2% of equity) relative to the distance to the trailing stop.
🔥 Core Components
1. Adaptive Multi-Timeframe SuperTrend Dashboard
The backbone of mTrendSight is a fully customizable SuperTrend system, enhanced with a multi-timeframe confirmation table displaying ST direction & value.
This compact “Trend Dashboard” provides instant clarity on higher-timeframe direction, trend strength, and market bias.
2. Dynamic Support & Resistance Channels
Automatically detects the strongest support/resistance zones using pivot clustering.
Key Features:
Clustered S/R Channels instead of thin lines
Adaptive width based on recent swings
Breakout markers (optional) for continuation signals
Helps identify structural zones, retest areas, and liquidity pockets
3. Multi-Timeframe Color-Coded EMAs
Plot up to three EMAs, each optionally pulled from a higher timeframe.
Benefits:
Instant visual trend alignment
Bullish/Bearish dynamic color shifts
Precision EMA value table for trade planning
Works perfectly with ST & RSI for multi-layer confirmation
4. Linear Regression Trend Channel
A statistically driven trend channel that measures the most probable path of price action.
Highlights:
Uses Pearson’s R to determine trend reliability
Provides a Confidence Level to judge whether trend slope is credible
Ideal for determining over-extension and mean-reversion zones
5. ATR Volatility Analyzer
A lightweight but powerful volatility classifier using ATR.
Features:
Detects High, Low, or Normal volatility
Clean table display
Helps filter entries during low-energy markets
Strengthens trend-following filters when volatility expands
6. RSI Momentum & Trend Classifier
A significantly improved RSI with multi-layer smoothing and structure-based classification.
Provides:
Bullish / Bearish / Neutral momentum states
Short-term momentum vs long-term RSI trend
Perfect for early trend shifts, pullback entries, and momentum confirmation
⚙️ How the Strategy Works (Execution Logic)
📌 Multi-Timeframe Supertrend + EMA + Volatility Confirmation
Entries are only triggered when:
Multiple Supertrend timeframes align (e.g., 5m + 15m + 45m)
EMA direction aligns with the trend
Volatility conditions (ATR filter) is not Low allow high-probability moves
This ensures strong directional confluence before every trade.
📌 Guaranteed Single-Entry Logic
The strategy uses a flag + counter system to ensure:
Only one entry is allowed per trend signal
Re-entries do not happen until the entire trend condition resets
The Strategy Tester remains clean, without duplicate overlapping trades
This eliminates revenge trades, repeated fills, and choppy overtrading.
📌 Dynamic Supertrend Trailing Stop
Stop Loss is anchored to current Supertrend value, creating:
Automatic trailing
Tight downside control
Protection against deep pullbacks
High responsiveness during volatility expansions
📌 Precision Take-Profit (4% Run-Up Capture)
A dedicated global exit block ensures:
Take Profit triggers exactly at 4% price run-up
Uses strategy.exit() with limit orders to catch spikes (wicks)
Works consistently on all timeframes & assets
📌 Automated Position Sizing (2% Risk Default)
Position size is dynamically calculated based on:
Account Equity
Distance to trailing stop
Configured risk %
This enforces proper risk management without manual adjustments.
📈 How to Interpret Results
Reliable Exits: All exits are globally managed, so stops and take profits trigger accurately on every bar.
Clean Trade History: Because of single-entry logic, backtests show one trade per valid signal.
Consistency: Multi-timeframe logic ensures only high-quality, structured trades.

Super-AO Engine - Sentiment Ribbon - 11-29-25Super-AO Sentiment Ribbon by Signal Lynx
Overview:
The Super-AO Sentiment Ribbon is the visual companion to the Super-AO Strategy Suite.
While the main strategy handles the complex mathematics of entries and risk management, this tool provides a simple "Traffic Light" visual at the top of your chart to gauge the overall health of the market.
How It Works:
This indicator takes the core components of the Super-AO strategy (The SuperTrend and the Awesome Oscillator), calculates the spread between them and the current price, and generates a normalized "Sentiment Score."
Reading the Colors:
🟢 Lime / Green: Strong Upward Momentum. Ideally, you only want to take Longs here.
🟤 Olive / Yellow: Trend is weakening. Be careful with new entries, or consider taking profit.
⚪ Gray: The "Kill Zone." The market is chopping sideways. Automated strategies usually suffer here.
🟠 Orange / Red: Strong Downward Momentum. Ideally, you only want to take Shorts here.
Integration:
This script uses the same default inputs as our Super-AO Strategy Template and Alerts Template. Use them together to confirm your automated entries visually.
About Signal Lynx:
Free Scripts supporting Automation for the Night-Shift Nation 🌙
(www.signallynx.com)

Super-AO with Risk Management Alerts Template - 11-29-25Super-AO with Risk Management: ALERTS & AUTOMATION Edition
Signal Lynx | Free Scripts supporting Automation for the Night-Shift Nation 🌙
1. Overview
This is the Indicator / Alerts companion to the Super-AO Strategy.
While the Strategy version is built for backtesting (verifying profitability and checking historical performance), this Indicator version is built for Live Execution.
We understand the frustration of finding a great strategy, only to realize you can't easily hook it up to your trading bot. This script solves that. It contains the exact same "Super-AO" logic and "Risk Management Engine" as the strategy version, but it is optimized to send signals to automation platforms like Signal Lynx, 3Commas, or any Webhook listener.
2. Quick Action Guide (TL;DR)
Purpose: Live Signal Generation & Automation.
Workflow:
Use the Strategy Version to find profitable settings.
Copy those settings into this Indicator Version.
Set a TradingView Alert using the "Any Alert() function call" condition.
Best Timeframe: 4 Hours (H4) and above.
Compatibility: Works with any webhook-based automation service.
3. Why Two Scripts?
Pine Script operates in two distinct modes:
Strategy Mode: Calculates equity, drawdowns, and simulates orders. Great for research, but sometimes complex to automate.
Indicator Mode: Plots visual data on the chart. This is the preferred method for setting up robust alerts because it is lighter weight and plots specific values that automation services can read easily.
The Golden Rule: Always backtest on the Strategy, but trade on the Indicator. This ensures that what you see in your history matches what you execute in real-time.
4. How to Automate This Script
This script uses a "Visual Spike" method to trigger alerts. Instead of drawing equity curves, it plots numerical values at the bottom of your chart when a trade event occurs.
The Signal Map:
Blue Spike (2 / -2): Entry Signal (Long / Short).
Yellow Spike (1 / -1): Risk Management Close (Stop Loss / Trend Reversal).
Green Spikes (1, 2, 3): Take Profit Levels 1, 2, and 3.
Setup Instructions:
Add this indicator to your chart.
Open your TradingView "Alerts" tab.
Create a new Alert.
Condition: Select SAO - RM Alerts Template.
Trigger: Select Any Alert() function call.
Message: Paste your JSON webhook message (provided by your bot service).
5. The Logic Under the Hood
Just like the Strategy version, this indicator utilizes:
SuperTrend + Awesome Oscillator: High-probability swing trading logic.
Non-Repainting Engine: Calculates signals based on confirmed candle closes to ensure the alert you get matches the chart reality.
Advanced Adaptive Trailing Stop (AATS): Internally calculates volatility to determine when to send a "Close" signal.
6. About Signal Lynx
Automation for the Night-Shift Nation 🌙
We are providing this code open source to help traders bridge the gap between manual backtesting and live automation. This code has been in action since 2022.
If you are looking to automate your strategies, please take a look at Signal Lynx in your search.
License: Mozilla Public License 2.0 (Open Source). If you make beneficial modifications, please release them back to the community!

Super-AO with Risk Management Strategy Template - 11-29-25Super-AO Strategy with Advanced Risk Management Template
Signal Lynx | Free Scripts supporting Automation for the Night-Shift Nation 🌙
1. Overview
Welcome to the Super-AO Strategy. This is more than just a buy/sell indicator; it is a complete, open-source Risk Management (RM) Template designed for the Pine Script community.
At its core, this script implements a robust swing-trading strategy combining the SuperTrend (for macro direction) and the Awesome Oscillator (for momentum). However, the real power lies under the hood: a custom-built Risk Management Engine that handles trade states, prevents repainting, and manages complex exit conditions like Staged Take Profits and Advanced Adaptive Trailing Stops (AATS).
We are releasing this code to help traders transition from simple indicators to professional-grade strategy structures.
2. Quick Action Guide (TL;DR)
Best Timeframe: 4 Hours (H4) and above. Designed for Swing Trading.
Best Assets: "Well-behaved" assets with clear liquidity (Major Forex pairs, BTC, ETH, Indices).
Strategy Type: Trend Following + Momentum Confirmation.
Key Feature: The Risk Management Engine is modular. You can strip out the "Super-AO" logic and insert your own strategy logic into the template easily.
Repainting: Strictly Non-Repainting. The engine calculates logic based on confirmed candle closes.
3. Detailed Report: How It Works
A. The Strategy Logic: Super-AO
The entry logic is based on the convergence of two classic indicators:
SuperTrend: Determines the overall trend bias (Green/Red).
Awesome Oscillator (AO): Measures market momentum.
The Signal:
LONG (+2): SuperTrend is Green AND AO is above the Zero Line AND AO is Rising.
SHORT (-2): SuperTrend is Red AND AO is below the Zero Line AND AO is Falling.
By requiring momentum to agree with the trend, this system filters out many false signals found in ranging markets.
B. The Risk Management (RM) Engine
This script features a proprietary State Machine designed by Signal Lynx. Unlike standard strategies that simply fire orders, this engine separates the Signal from the Execution.
Logic Injection: The engine listens for a specific integer signal: +2 (Buy) or -2 (Sell). This makes the code a Template. You can delete the Super-AO section, write your own logic, and simply pass a +2 or -2 to the RM_EngineInput variable. The engine handles the rest.
Trade States: The engine tracks the state of the trade (Entry, In-Trade, Exiting) to prevent signal spamming.
Aggressive vs. Conservative:
Conservative Mode: Waits for a full trend reversal before taking a new trade.
Aggressive Mode: Allows for re-entries if the trend is strong and valid conditions present themselves again (Pyramiding Type 1).
C. Advanced Exit Protocols
The strategy does not rely on a single exit point. It employs a "Layered Defense" approach:
Hard Stop Loss: A fixed percentage safety net.
Staged Take Profits (Scaling Out): The script allows you to set 3 distinct Take Profit levels. For example, you can close 10% of your position at TP1, 10% at TP2, and let the remaining 80% ride the trend.
Trailing Stop: A standard percentage-based trailer.
Advanced Adaptive Trailing Stop (AATS): This is a highly sophisticated volatility stop. It calculates market structure using Hirashima Sugita (HSRS) levels and Bollinger Bands to determine the "floor" and "ceiling" of price action.
If volatility is high: The stop loosens to prevent wicking out.
If volatility is low: The stop tightens to protect profit.
D. Repainting Protection
Many Pine Script strategies look great in backtesting but fail in live trading because they rely on "real-time" price data that disappears when the candle closes.
This Risk Management engine explicitly pulls data from the previous candle close (close , high , low ) for its calculations. This ensures that the backtest results you see match the reality of live execution.
4. For Developers & Modders
We encourage you to tear this code apart!
Look for the section titled // Super-AO Strategy Logic.
Replace that block with your own RSI, MACD, or Price Action logic.
Ensure your logic outputs a 2 for Buy and -2 for Sell.
Connect it to RM_EngineInput.
You now have a fully functioning Risk Management system for your custom strategy.
5. About Signal Lynx
Automation for the Night-Shift Nation 🌙
This code has been in action since 2022 and is a known performer in PineScript v5. We provide this open source to help the community build better, safer automated systems.
If you are looking to automate your strategies, please take a look at Signal Lynx in your search.
License: Mozilla Public License 2.0 (Open Source). If you make beneficial modifications, please release them back to the community!
