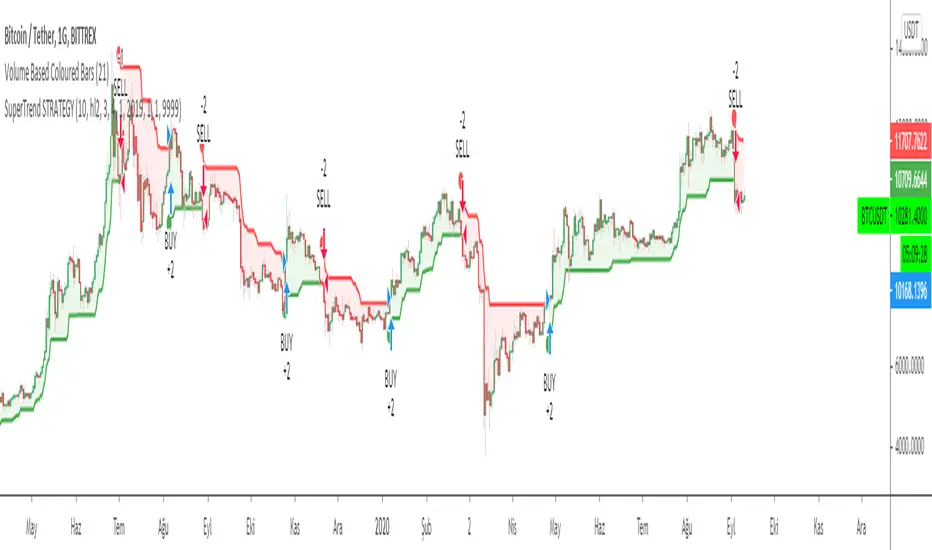
SuperTrend STRATEGYSTRATEGY version of SuperTrend Indicator:
SuperTrend is one of the most common ATR based trailing stop indicators.
In this version you can change the ATR calculation method from the settings. Default method is RMA, when the alternative method is SMA .
The indicator is easy to use and gives an accurate reading about an ongoing trend. It is constructed with two parameters, namely period and multiplier. The default values used while constructing a superindicator are 10 for average true range or trading period and three for its multiplier.
The average true range (ATR) plays an important role in 'Supertrend' as the indicator uses ATR to calculate its value. The ATR indicator signals the degree of price volatility .
The buy and sell signals are generated when the indicator starts plotting either on top of the closing price or below the closing price. A buy signal is generated when the ‘Supertrend’ closes above the price and a sell signal is generated when it closes below the closing price.
It also suggests that the trend is shifting from descending mode to ascending mode. Contrary to this, when a ‘Supertrend’ closes above the price, it generates a sell signal as the colour of the indicator changes into red.
A ‘Supertrend’ indicator can be used on equities, futures or forex, or even crypto markets and also on daily, weekly and hourly charts as well, but generally, it fails in a sideways-moving market.
Source function added to use the indicator as the ATR Trailing Stop indicator.
Just change source type hl2 to close.
different variations might be useful.
Supertrend
SupterTrend I created this script for basically two reasons
1. there is not simple suptertrend indicator available on tv rather you will find many fancy suptrend indicators with confusing other indicators and absurd background colors i dont know why some of the trader coders are obsessed with is using over the top color and designing phenomena.
2. I want to let people know about the accuracy of suptertrend indicator on multiple time frames i am plaining to create a backtesting tool for almost all Famous indicators so that specially new folks know what should they expect from any particular Indicator
Also i added intraday filter to check the results for intrday signals . the sqaure off timings are for Indian markets only but you can edit the hours and minutes in the code for using other than indian markets. No need to do anything if you only want positional trading trading results

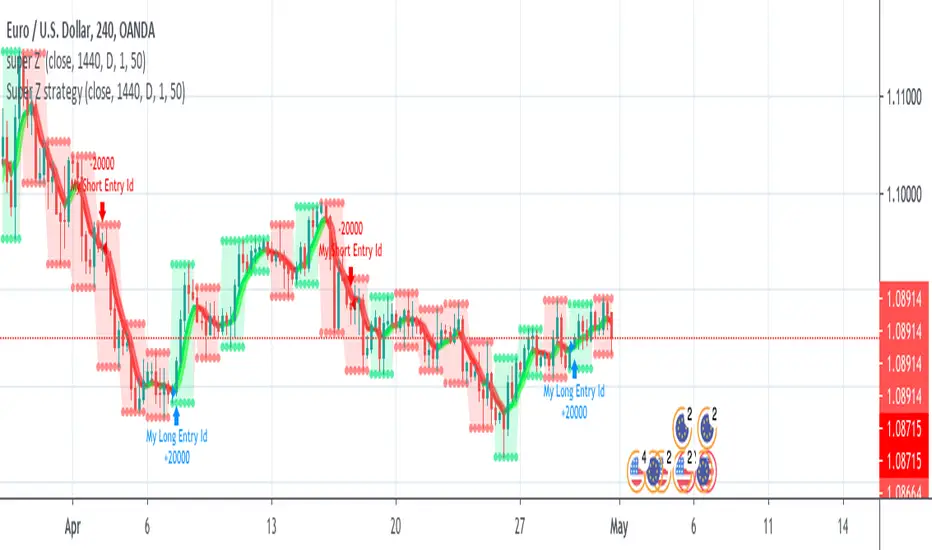
Super Z strategy - Thanks to Rafael Zioni//Original script
//https://www.tradingview.com/script/wYknDlLx-super-Z/
This is a test for verifying if this interesting study works well.
The author, thanks to him!!!, advise a possible repaint because the script uses security function.
Refer to tradingview.com for more info on repainting:
www.tradingview.com
QUOTE:
We can see repainting in the following cases:
1- Strategies using calc_on_every_tick=true. A strategy with parameter calc_on_every_tick = false may also be prone to repainting, but to a lesser degree.
(this is not the case, ndr).
2- Using security for requesting data from a resolution higher than the resolution of the chart’s main symbol (i.e. do not use ion weelky chart if you set 1440 (1Day) in inputs)
NOTE: Thanks again to Rafael Zioni. If he requires to delete this strategy, I'll do immediately.
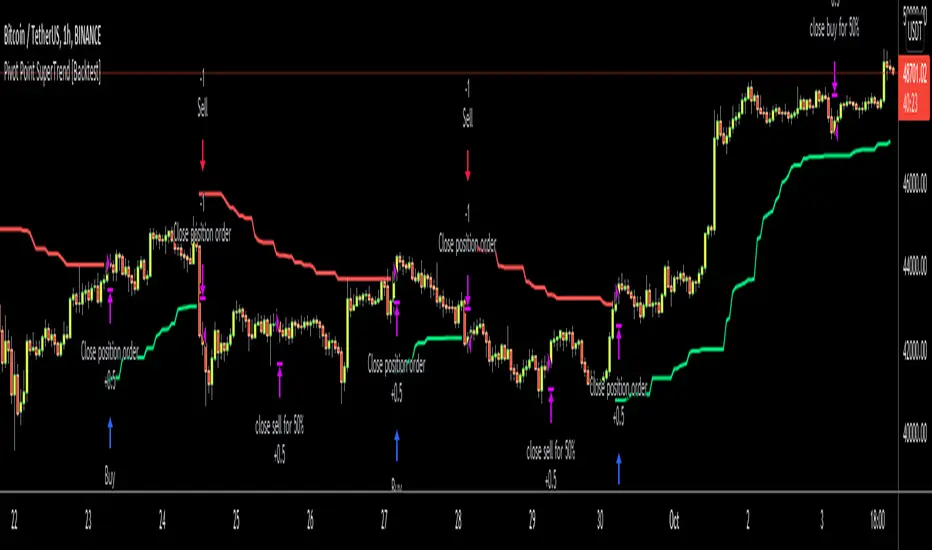
Pivot Point SuperTrend [Backtest]Hello All,
This is backtesting result of following indicator/strategy. I didn't work on adding other indicators. maybe in the future I can try to combine this with other indicators.
You can visit following link to see "Pivot Point SuperTrend" . by using this backtesting tool, you can test&find better options
There is option "Use Center Line to Close Entry for 50%" . by default it's not enabled. if you enable this option, pivot point center line may push you to close your entry for 50% (can be used as early stoploss/take profit line if you think it's risky)
Enjoy!
FRAMA - Supertrend strategyFRAMA Strategy
I found this strategy on internet, in a well-known forex forum.
I have translated the two indicators mentioned in that strategy (originally in mq4) in pine script.
Thanks to Fractured and Shizaru for the FRAMA snippets, to mejialucas for Supertrend snippet, to JayRogers for trade management snippet and to Trost for backtesting snippet.
I also added some code to have FRAME with a deiiferent timeframe
Indicators set-up:
FRAMA period 24 (it was originally 25 but it's better to use an even number)
FRAMA timefarme lower then chart timeframe (e.g. daily chart and weekly FRAMA)
Supertrend indicator as it is.
Of course, it is better to adapt above setting to traded instrument.
Long/Buy rules:
1 - Enter at crossover between FRAMA and its signal
2 - Option to filter entries based on supertrend signal
3 - Exit when Supertrend change direction;
4 - Exit long when short signal occurs;
Short/Sell rules:
1 - Enter at crossunder between FRAMA and its signal
2 - Option to filter entries based on supertrend signal
3 - Exit when Supertrend change direction;
4 - Exit short when long signal occurs;
VERY IMPORTANT NOTE: this is a trend following strategy, so the target is to stay in the trade as much as possible (drawdown my be high). If your trading style is more focused on scalping and/or pullbaks, this strategy is not for you.
Credits to who developed this startegy (google it).
Thanks to all pinescripters mentined in the code for their snippets.
I have also a study with alerts.
Please use comment section for any feedback or contact me if you need support.

Best Supertrend CCI StrategyHello traders
Someone requested the strategy version of the Supertrend CCI indicator
It's a Supertrend not based on candle close but based on a CCI ( Commodity Channel Index )
How does it work?
Bull event: CCI crossing over the 0 line
Bear event: CCI crossing below the 0 line
When the event is triggered, the script will plot the Supertrend as follow
UP Trend = High + ATR * Factor
DOWN Trend = Low - ATR * Factor
This is an alternative of the classical Supertrend based on candle close being above/beyond the previous Supertrend level.
Hope you'll enjoy it and it will improve your trading making you a better trader
Dave

[LunaOwl] 超級趨勢2 (SuperTrend2)It is very similar to the previous version. I changed the function from study to a strategy, and added the Average true range to RMA again.
I don't know the academic suitability, but using this strategy to trade the Altcoins market may have a good effect.
refer to Binance for 0.1% of fees, starting from Q4 2017.
跟以前的版本變化不大,我將腳本函數從"study"更改為"strategy",然後將平均真實範圍再次用遞迴平均線均化數值。
不知道學術上的適不適合這麼做...但是,直到目前交易小幣現貨市場,效果還算不錯,用用看。
交易手續費參考幣安小幣,0.1%,從2017年第四季開始測。
Updated:
--1. use RMA to reduce ATR noise.
--2. for the highly volatile Altcions market, strategy should focus on reducing noise.
--3. the Street commonly used alpha filtering for Random Walk.
--4. compared to other MAs, the performance is not outstanding, but the advantage is stability.
--5. I choose the 4H time frame to test the Altcoins (ex: ETH).
稍做更新:
--1.平均真實區間利用了遞迴均線減少雜訊
--2.針對高波動率的小幣市場,中期順勢策略應該以減少雜訊為重點
--3.研究國外交易策略後,它們常用平滑因子過濾隨機走勢
--4.績效上和其它平均法比較並沒有突出,但優點是參數變動穩定性
--5.我選擇四小時線回測小幣市場,並且選擇經歷過牛熊市的以太坊
The purpose of publishing Chinese Scripts is to make Pine close to more Chinese user.
發布中文腳本的目的,是希望可以讓 Pine 親近更多中文圈的使用者。

BEST Supertrend StrategyHello traders
Sharing a sample Supertrend strategy to illustrate how to calculate a convergence and using it in a strategy
I based the setup as follow:
- Entries on Supertrend MTF breakout + moving average cross. Entering whenever there is a convergence
- exit whenever a Simple Moving Averages cross in the opposite direction happen
- possibility to filter only Longs/Shorts or both
All the best
Dave

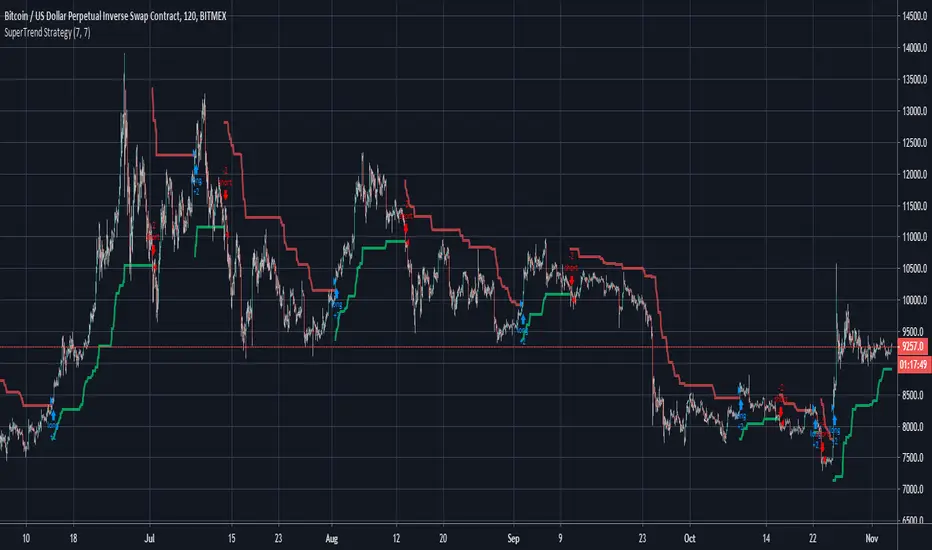
SuperTrend Strategy This is almost the same strategy that Alex Orekhov (everget) sells to unnoticed newbies... The only thing he added was a tool that analyses the better performance of the indicator, that is the difference from his script, and i dont have it here, what i have is what is freely distributed in many communities... But as i follow him for more than 1 year i saw that theese configs. In more than 95% of the time range betweern 7.2-6.8 with the most common settings the 7-7
So i made a description of each part of the code that i WRITED and is free and i am just using the configs that are public in Alex Orekhov (everget) profile. If it is public the configs he use in his charts and he is not the owner of the code right? Also the code is very easy to find in google in the MQL5 community or in a lot of videos in youtube.
He charges $10 for a 4 day trial (LOL) and $100 for this shit.
Here is a strategy that has a correlation with 95% of the time of the Profitable Strategy that he sells.
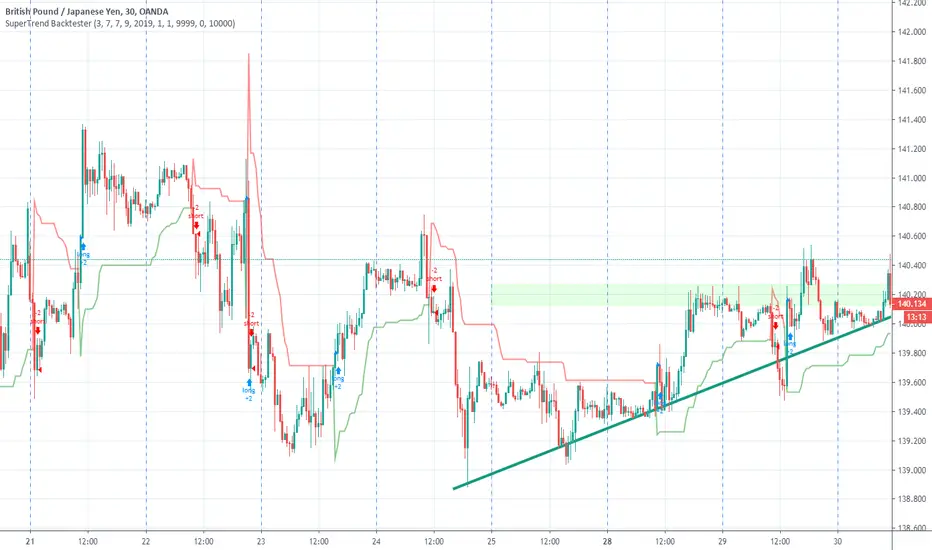
SuperTrend BacktesterThis is a backtesting script for the famous Super Trend.
Features
- Custom Date Range
- Custom Targets and Risks
Requested by Dlatrella
Super Trend Daily 2.0 BFThis is my Super Trend Daily strategy but with one important difference. You can now adjust settings for long or short signals individually and separately. For example, the condition for a long signal may require a different parameter setting than the condition for a short signal. Each parameter in the signal generation can be tuned. You can also decide what kind of stop loss you want for each side - you could have a fixed stop loss for longs and an ATR derived stop loss for shorts, or whatever.
We also have the option to choose if we want longs, shorts or both.
INISTRUCTIONS
Look at the background colors:
Green line = long signal
Red line = short signal
Aqua = No long trades
White = No short trades
Yellow dotted line = stop loss for long
Orange dotted line = stop loss for short
The aqua and white backgrounds mean the conditions are choppy/sideways according to our settings we applied to the rate of change function for a long/short signal respectively. It is possible to get a long signal in a white background, but not a short signal. Similarly, it is possible to get a short signal in an aqua background, but not a long signal.
This is a work in progress so any suggestions for improvements are welcome.

Super Trend Daily BF 🚀Super Trend is based on volatility and attempts to show the overall greater trend of a market. Thanks to everget for the idea of improving the Super Trend code. Thanks to kiasaki for ROC code.
The idea here is to enter a trade upon trend reversal (unless we have a white background - this indicates choppy/sideways market).
INSTRUCTIONS
Follow the background color for signals of a trend reversal.
Bright green = long
Bright red = short
White = no trade
We use a fixed stop loss here of 6% but I have included the option to apply an ATR based stop loss in Settings. No take profit. No re-entering until we get an opposing signal.
I use a Rate of Change function to detect when we should stay out due to choppy sideways price action.
This strategy was optimised for XBT/USD on Bitmex 1 day chart, ideal settings for other pairs will differ.

SuperC BF 🚀Based on some code from noro and kiasaki - thank you.
A Super Trend is a trend over a long period of time. There are lots of existing scripts that generate signals based on the overall direction of an instrument. What if we combined this idea with a measure of Money Flow and added a filter to try to avoid choppy sideways action?
I started with a super trend foundation and added an MFI calculation to account for volume flowing into and out of the asset. Then added a Rate of Change function to stay out of trades when there is not much up/down movement.
INSTRUCTIONS
Bright green background = go long
Bright red background = go short
COLOR OVERVIEW
A white background means we don't trade
A green background means we have a long condition
A red background means we have a short condition
The cloud is green when we have a long condition, red when we have a short condition.
The cloud is yellow if we should be in a long already but the current candle is not satisfying all long conditions.
The cloud is orange if we should be in a short already but the current candle is not satisfying all short conditions.
The line at the bottom is MFI - this is green when the current candle is greater than the last, red when it is less than the last.
SIGNAL GENERATION
A long condition is when MFI > MFI AND we are not in a choppy market AND when price is above the super trend.
A short condition is when MFI < MFI AND we are not in a choppy market AND when price is below the super trend.
We use a fixed Stop Loss of 2% here on the daily timeframe for XBT/USD.
If we get stopped out from a long and we still have the conditions for a long, we re-enter. Same for short.

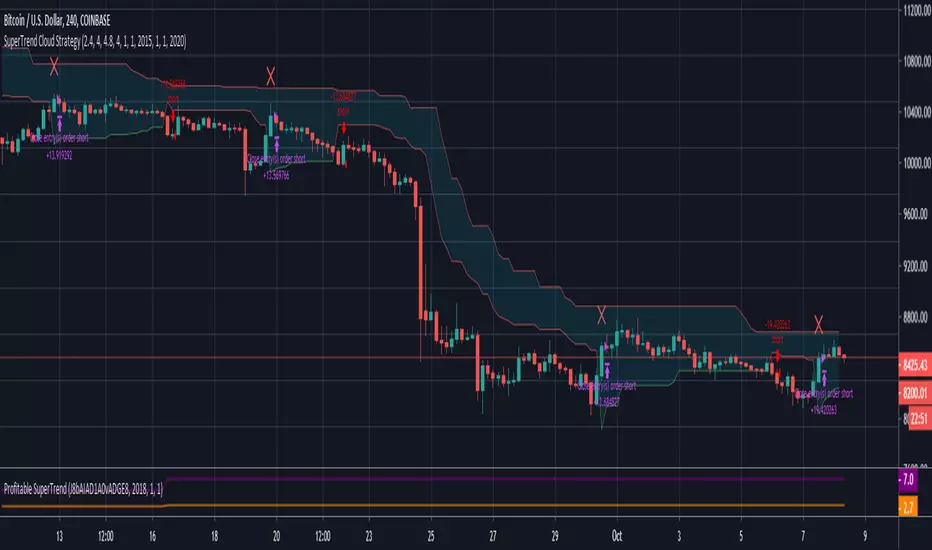
SuperTrend Cloud StrategyExperimental strategy to improve accuracy of SuperTrend Cloud. I am attempting to use STD deviation to manipulate the multiplier of the SuperTrend cloud. Greater STD Deviation = Oscillation in price action which can be applied to multiplier of SuperTrend to filter out bad trades and improve accuracy.
SUPERTREND ATR WITH TRAILING STOP LOSS## THIS SCRIPT IS ON GITHUB
## MORE BACKTEST
SuperTrend is a moving stop and reversal line based on the volatility (ATR).
The strategy will ride up your stop loss when price moviment 1%.
The strategy will close your operation when the market price crossed the stop loss.
The strategy will close operation when the line based on the volatility will crossed
The strategy has the following parameters:
+ **ATR PERIOD** - To select number of bars back to execute calculation
+ **ATR MULTPLIER** - To add a multplier factor on volatility
+ **INITIAL STOP LOSS** - Where can isert the value to first stop.
+ **POSITION TYPE** - Where can to select trade position.
+ **BACKTEST PERIOD** - To select range.
## DISCLAIMER
1. I am not licensed financial advisors or broker dealers. I do not tell you when or what to buy or sell. I developed this software which enables you execute manual or automated trades multiple trades using TradingView. The software allows you to set the criteria you want for entering and exiting trades.
2. Do not trade with money you cannot afford to lose.
3. I do not guarantee consistent profits or that anyone can make money with no effort. And I am not selling the holy grail.
4. Every system can have winning and losing streaks.
5. Money management plays a large role in the results of your trading. For example: lot size, account size, broker leverage, and broker margin call rules all have an effect on results. Also, your Take Profit and Stop Loss settings for individual pair trades and for overall account equity have a major impact on results. If you are new to trading and do not understand these items, then I recommend you seek education materials to further your knowledge.
**YOU NEED TO FIND AND USE THE TRADING SYSTEM THAT WORKS BEST FOR YOU AND YOUR TRADING TOLERANCE.**
**I HAVE PROVIDED NOTHING MORE THAN A TOOL WITH OPTIONS FOR YOU TO TRADE WITH THIS PROGRAM ON TRADINGVIEW.**
## NOTE
I accept suggestions to improve the script.
If you encounter any problems i will be happy to share with me.
+ Authors: @exit490
+ Revision: v1.0.0
+ Date: 5-Aug-2019
+ Pinescript version: 4
## LICENSE
Copyright 2019 Mauricio Pimenta / exit490
SuperTrend with Trailing Stop Loss script may be freely distributed under the (../LICENSE).

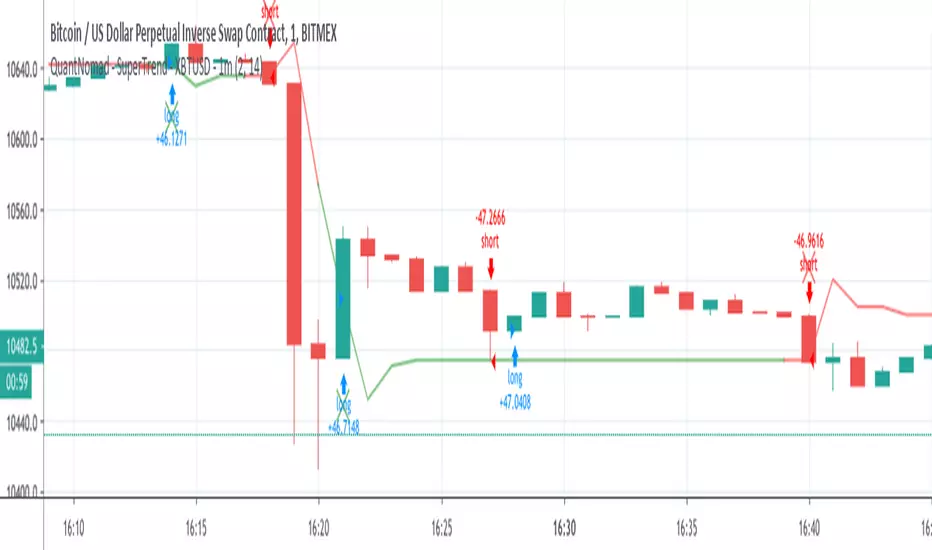
QuantNomad - SuperTrend - XBTUSD - 1mInteresting performance for Super Trend strategy for XBTUSD 1m chart.
Params: ST Mult: 2, ST Period 14.
Performance: 144% profit, 1988 trades, only 41% prof, 2.04% dd , 2.51 Sharpe.
On its own, it might be not a very good strategy, but the big amount of trades allows you to add more filters and improve it.
And remember:
Past performance does not guarantee future results.
QuantNomad - SuperTrend - TSLA - 1mInteresting performance for Super Trend strategy for Tesla ( TSLA ) 1m chart.
Params: ST Mult: 3, ST Period 120.
Performance:61% profit, 637 trades, only 33% prof, 4.84% dd , 0.4 Sharpe.
On its own, it might be not a very good strategy, but the big amount of trades allows you to add more filters and improve it.
The strategy is not bad both with "when" params when strategy executed on open of next bar and with stop orders when strategy enters on exact Super Trend level.
You can comment/uncomment lines in the code and switch from one approach to another.
And remember:
Past performance does not guarantee future results.

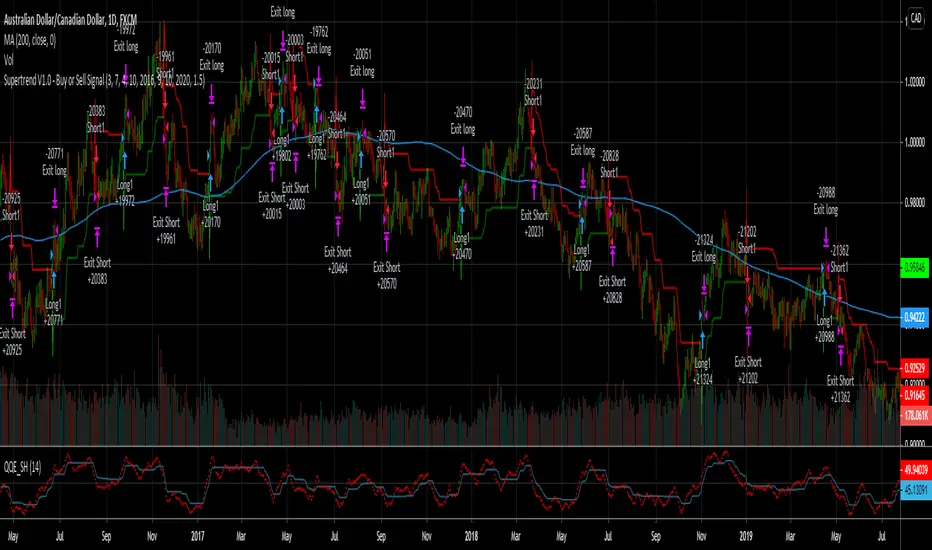
Supertrend V1.0 - Buy or Sell SignalA test of the Supertrend Indicator. If I have made any mischaracterizations and mistakes, please let me know in the comments.
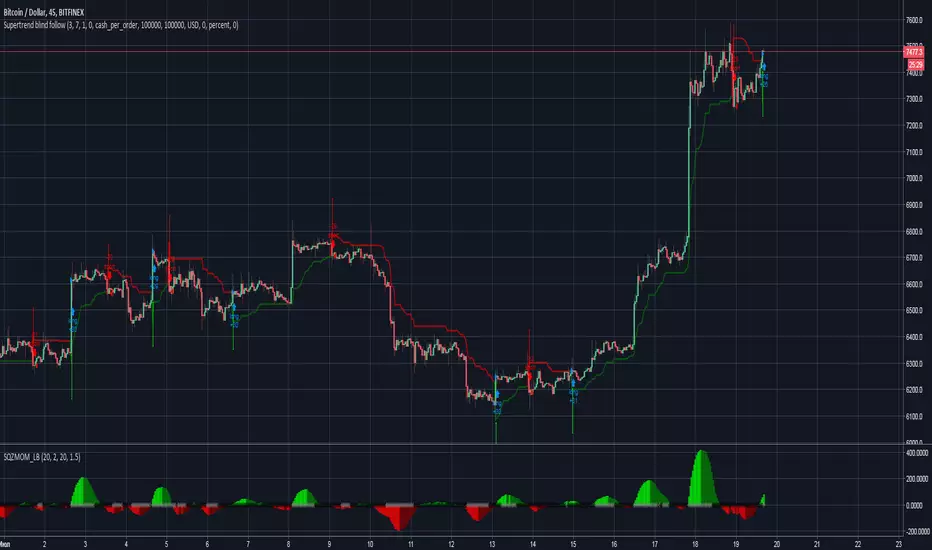
Supertrend blind followingThis strategy is showing what would be if you just follow supertrand indicator. As we know, supertrand doesn't appear immediately and we need to wait the next bar for decision about entering. So you can see what will happen if you take position after supertrend finally formed. This indicator is extremely dangerous without another tools and can give very serious drawdown. Take care of yourself...