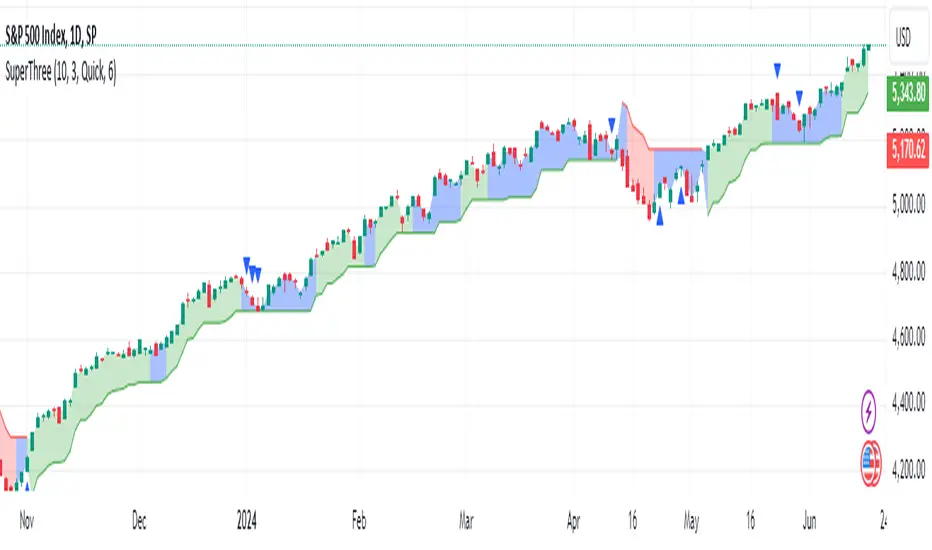
SuperThreeThe SuperThree is a comprehensive technical indicator designed to identify and visualize market trends and counter-trend momentum in trading. It uses a unique color-coding system to represent different market conditions and potential trading opportunities.
Uptrend (Green Fill) : This is indicated by a green fill. An uptrend is a period where prices are increasing overall, suggesting a strong market. It’s an ideal time for traders to consider entering long positions or exiting short positions.
Downtrend (Red Fill) : This is represented by a red fill. A downtrend is a period where prices are decreasing overall, indicating a bearish market. Traders might consider entering short positions or exiting long positions during this phase.
Sideways Trend (Blue Fill) : This is shown by a blue fill. A sideways trend, also known as a horizontal trend, is when the price is relatively stable and not making significant upward or downward movements. It’s often a period of consolidation before the price moves up or down.
Counter-Trend Momentum (Blue Arrows) : Blue arrows indicate counter-trend momentum, which can be a signal to exit trades or look for potential trend reversals. These are crucial points where the market’s momentum is shifting and may be about to move in the opposite direction.
The SuperThree indicator is an enhancement of the Supertrend indicator, providing additional features and visual cues to help traders make informed decisions. However, like all indicators, it should be used in conjunction with other forms of analysis to confirm signals and avoid potential false positives. Always consider your risk tolerance and investment goals before making trading decisions.
Happy trading! 😊
Supertrend_reversal
Pro Supertrend CalculatorThis indicator is an adapted version of Julien_Eche's 'Pro Momentum Calculator' tailored specifically for TradingView's 'Supertrend indicator'.
The "Pro Supertrend Calculator" indicator has been developed to provide traders with a data-driven perspective on price movements in financial markets. Its primary objective is to analyze historical price data and make probabilistic predictions about the future direction of price movements, specifically in terms of whether the next candlestick will be bullish (green) or bearish (red). Here's a deeper technical insight into how it accomplishes this task:
1. Supertrend Computation:
The indicator initiates by computing the Supertrend indicator, a sophisticated technical analysis tool. This calculation involves two essential parameters:
- ATR Length (Average True Range Length): This parameter determines the sensitivity of the Supertrend to price fluctuations.
- Factor: This multiplier plays a pivotal role in establishing the distance between the Supertrend line and prevailing market prices. A higher factor value results in a more significant separation.
2. Supertrend Visualization:
The Supertrend values derived from the calculation are meticulously plotted on the price chart, manifesting as two distinct lines:
- Green Line: This line represents the Supertrend when it indicates a bullish trend, signifying an anticipation of rising prices.
- Red Line: This line signifies the Supertrend in bearish market conditions, indicating an expectation of falling prices.
3. Consecutive Candle Analysis:
- The core function of the indicator revolves around tracking successive candlestick patterns concerning their relationship with the Supertrend line.
- To be included in the analysis, a candlestick must consistently close either above (green candles) or below (red candles) the Supertrend line for multiple consecutive periods.
4.Labeling and Enumeration:
- To communicate the count of consecutive candles displaying uniform trend behavior, the indicator meticulously applies labels to the price chart.
- The positioning of these labels varies based on the direction of the trend, residing either below (for bullish patterns) or above (for bearish patterns) the candlestick.
- The color scheme employed aligns with the color of the candle, using green labels for bullish candles and red labels for bearish ones.
5. Tabular Data Presentation:
- The indicator augments its graphical analysis with a customizable table prominently displayed on the chart. This table delivers comprehensive statistical insights.
- The tabular data comprises the following key elements for each consecutive period:
a. Consecutive Candles: A tally of the number of consecutive candles displaying identical trend characteristics.
b. Candles Above Supertrend: A count of candles that remained above the Supertrend during the sequential period.
3. Candles Below Supertrend: A count of candles that remained below the Supertrend during the sequential period.
4. Upcoming Green Candle: An estimation of the probability that the next candlestick will be bullish, grounded in historical data.
5. Upcoming Red Candle: An estimation of the probability that the next candlestick will be bearish, based on historical data.
6. Tailored Configuration:
To accommodate diverse trading strategies and preferences, the indicator offers extensive customization options. Traders can fine-tune parameters such as ATR length, factor, label and table placement, and table size to align with their unique trading approaches.
In summation, the "Pro Supertrend Calculator" indicator is an intricately designed tool that leverages the Supertrend indicator in conjunction with historical price data to furnish traders with an informed outlook on potential future price dynamics, with a particular emphasis on the likelihood of specific bullish or bearish candlestick patterns stemming from consecutive price behavior.

SuperTrend AI (Clustering) [LuxAlgo]The SuperTrend AI indicator is a novel take on bridging the gap between the K-means clustering machine learning method & technical indicators. In this case, we apply K-Means clustering to the famous SuperTrend indicator.
🔶 USAGE
Users can interpret the SuperTrend AI trailing stop similarly to the regular SuperTrend indicator. Using higher minimum/maximum factors will return longer-term signals.
The displayed performance metrics displayed on each signal allow for a deeper interpretation of the indicator. Whereas higher values could indicate a higher potential for the market to be heading in the direction of the trend when compared to signals with lower values such as 1 or 0 potentially indicating retracements.
In the image above, we can notice more clear examples of the performance metrics on signals indicating trends, however, these performance metrics cannot perform or predict every signal reliably.
We can see in the image above that the trailing stop and its adaptive moving average can also act as support & resistance. Using higher values of the performance memory setting allows users to obtain a longer-term adaptive moving average of the returned trailing stop.
🔶 DETAILS
🔹 K-Means Clustering
When observing data points within a specific space, we can sometimes observe that some are closer to each other, forming groups, or "Clusters". At first sight, identifying those clusters and finding their associated data points can seem easy but doing so mathematically can be more challenging. This is where cluster analysis comes into play, where we seek to group data points into various clusters such that data points within one cluster are closer to each other. This is a common branch of AI/machine learning.
Various methods exist to find clusters within data, with the one used in this script being K-Means Clustering , a simple iterative unsupervised clustering method that finds a user-set amount of clusters.
A naive form of the K-Means algorithm would perform the following steps in order to find K clusters:
(1) Determine the amount (K) of clusters to detect.
(2) Initiate our K centroids (cluster centers) with random values.
(3) Loop over the data points, and determine which is the closest centroid from each data point, then associate that data point with the centroid.
(4) Update centroids by taking the average of the data points associated with a specific centroid.
Repeat steps 3 to 4 until convergence, that is until the centroids no longer change.
To explain how K-Means works graphically let's take the example of a one-dimensional dataset (which is the dimension used in our script) with two apparent clusters:
This is of course a simple scenario, as K will generally be higher, as well the amount of data points. Do note that this method can be very sensitive to the initialization of the centroids, this is why it is generally run multiple times, keeping the run returning the best centroids.
🔹 Adaptive SuperTrend Factor Using K-Means
The proposed indicator rationale is based on the following hypothesis:
Given multiple instances of an indicator using different settings, the optimal setting choice at time t is given by the best-performing instance with setting s(t) .
Performing the calculation of the indicator using the best setting at time t would return an indicator whose characteristics adapt based on its performance. However, what if the setting of the best-performing instance and second best-performing instance of the indicator have a high degree of disparity without a high difference in performance?
Even though this specific case is rare its however not uncommon to see that performance can be similar for a group of specific settings (this could be observed in a parameter optimization heatmap), then filtering out desirable settings to only use the best-performing one can seem too strict. We can as such reformulate our first hypothesis:
Given multiple instances of an indicator using different settings, an optimal setting choice at time t is given by the average of the best-performing instances with settings s(t) .
Finding this group of best-performing instances could be done using the previously described K-Means clustering method, assuming three groups of interest (K = 3) defined as worst performing, average performing, and best performing.
We first obtain an analog of performance P(t, factor) described as:
P(t, factor) = P(t-1, factor) + α * (∆C(t) × S(t-1, factor) - P(t-1, factor))
where 1 > α > 0, which is the performance memory determining the degree to which older inputs affect the current output. C(t) is the closing price, and S(t, factor) is the SuperTrend signal generating function with multiplicative factor factor .
We run this performance function for multiple factor settings and perform K-Means clustering on the multiple obtained performances to obtain the best-performing cluster. We initiate our centroids using quartiles of the obtained performances for faster centroids convergence.
The average of the factors associated with the best-performing cluster is then used to obtain the final factor setting, which is used to compute the final SuperTrend output.
Do note that we give the liberty for the user to get the final factor from the best, average, or worst cluster for experimental purposes.
🔶 SETTINGS
ATR Length: ATR period used for the calculation of the SuperTrends.
Factor Range: Determine the minimum and maximum factor values for the calculation of the SuperTrends.
Step: Increments of the factor range.
Performance Memory: Determine the degree to which older inputs affect the current output, with higher values returning longer-term performance measurements.
From Cluster: Determine which cluster is used to obtain the final factor.
🔹 Optimization
This group of settings affects the runtime performances of the script.
Maximum Iteration Steps: Maximum number of iterations allowed for finding centroids. Excessively low values can return a better script load time but poor clustering.
Historical Bars Calculation: Calculation window of the script (in bars).

Reversal PointsHi , in this script i tried to find reversal points on big trends. For this purpose i have used Supertrend and Donchian channels. I combined both in a single indicator for finding reversal points. I am suggesting for using higher time frames like 4 hours or 1 day. It will be work in lower time frames too. But the signals will be less reliable than higher timeframes. Here is settings in this script:
New low sensitiity : this setting for donchian channels lookback. Bigger value result as less signals.
Atr Period: Period for Atr , it is for supertrend indicator in it.
Source: Source for supertrend indicator.
Atr Multiplier : Atr multiplier setting for Supertrend. Bigger value will be result as less signals.
Good luck.
Enes.

Buy/Sell SignalsThe indicator is built using Supertrend, RSI, and Ema Crossovers.
What is the best way to use the indicator?
Indicator can be used in two ways:
First : If a signal appears on the chart, you can enter immediately the stoploss is the candle's low with a Small Buffer.
Second: you will get good results if you plot additional indicators like as volume, RSI and so on for additional confirmation to get better results

SuperTrend OptimizerHello!
This indicator attempts to optimize Supertrend parameters. To achieve this, 102 parameter combinations are tested concurrently - the top three performers are listed in descending order.
Parameters,
Factor: Changes to this parameter shifts the tested factor range. For instance, increasing the factor measure from 3.00 to 3.01 (+0.01) will remove 3.00 from the tested range - this setting controls the lower threshold of the range. The upper threshold, in all instances, is the lower Factor threshold + 3.3 (i.e. 3.0(lower) - 6.3(upper), 4.0(lower) - 7.3(upper), 2.5(lower) - 5.8(upper))
ATR period: Changes to this parameter shifts the tested ATR period range. For instance, increasing the ATR measure from 10 to 11 (+1) will remove 10 from the tested range - this setting controls the lower threshold of the range. The upper threshold, in all instances, is the lower threshold + 2 (i.e. 10(lower) - 12(upper), 11(lower) - 13(upper), 9(lower), - 11(upper))
The Factor parameter is modifiable to any positive decimal number; the ATR parameter is modifiable to any positive integer. Changing either parameter shifts the tested parameter combination range. Both parameters can be changed in the settings, to which you control the lower threshold of the range. If, for instance, you were to change the Factor measurement from 3.0 to 4.1 (+1.1) the 4.0 Factor measurement, and all Factor measures less than 4.0, will be excluded from the performance test.
Consequently, a Supertrend test will be performed with a Factor of 4.1 and an ATR period of 10 (default). This test repeats at 0.1 Factor intervals and 1.0 ATR intervals.
Therefore, assume you modify the Factor lower threshold to 3.1 and the ATR lower threshold to 10. The indicator will test three Supertrend systems with a Factor of 3.1 and an ATR period of 10.. then 11.. 12, then three systems with a Factor of 3.2 and an ATR period of 10.. then 11.. 12... until (lower Factor threshold + 3.3) and (lower ATR threshold + 2) are tested... which in this example is... a Factor of 6.4 and an ATR period of 12.
The tested Factor range and ATR range are displayed in a bottom right table alongside the top performing parameter combinations.
Of course, you can change the the lower thresholds, which means you can test numerous Supertrend parameter combinations! However, no greater than 102 parameter combinations will be tested simultaneously; the best performing Supertrend parameters are plotted on the chart automatically.
I will be working on this indicator more tomorrow! Let me know if you have questions or anything you would like included!
(I of course added something fun in the script. Be sure to try it with bar replay!)

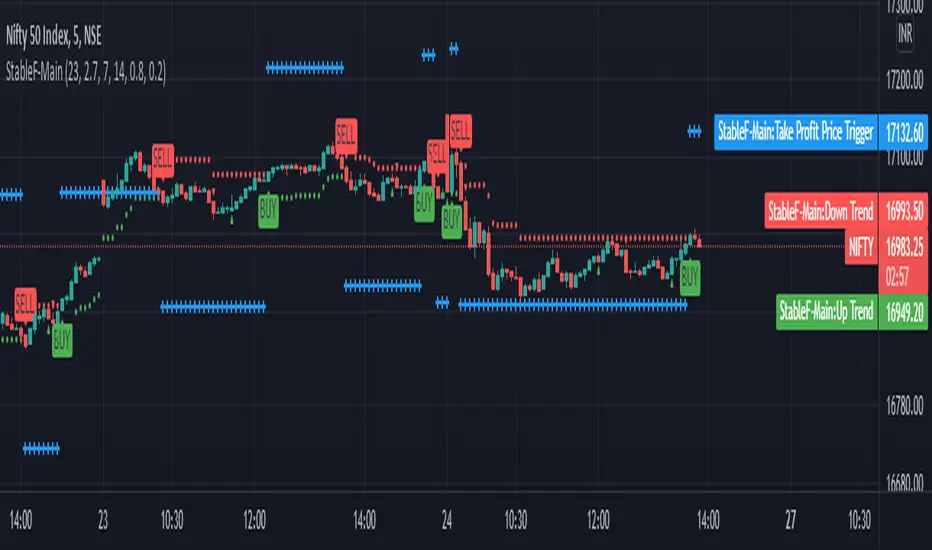
StableF-MainIt is combination of Built in Super trend and Adx with take profit
uptrend is considered when +dmi is above -dmi and +dmi is above 25 and adx is above 25 and supertrend gives Buy
downtrend is considered when -dmi is above +dmi and -dmi is above 25 and adx is above 25 and supertrend give sell
use fibo for target by taking as previous swing high and swing low
-supertrend crossover is referred as buy plotshape
-supertrend cross under is referred as Sell plotshape
-keep stoploss at dot line of supertrend
-adx-dmi crossover (+dmi crossed above -dmi) is shown by Triangle Up symbol
-adx-dmi crossunder( -dmi crosses below +dmi) is shown by Triangle down symbol
--Cross symbol with blue line with linewidth 2 is referred as Take profit
--combine this with adx -dmi setting with 7 and 14
----disclaimer-----
used free built in supertrend and adx so u can use same setting in other broker or in trading view
not responsible for any loss or gain
-only for educational purpose
Close to SupertrendMany a times, we have seen that the price closing in towards supertrend reverses.
This indicator gives signal that identifies high / low of any candle if near the down / up supertrend line by a defined margin using arrow signals.
I've simply re-used readily available supertrend indicator source code and just modified it to these signals. So, almost all of the source code is not mine.
Enter the short / long position when arrow signal appears.
SL / trend reversal will be mandatorily at close of a candle above or below the supertrend line, and the supertrend changes direction.
Hope this indicator comes handy for you.

Momentum Trading Strategy (Weekly Chart)The strategy will open position when there is momentum in the stock
The strategy will ride up your stop loss based on the super trend.
The strategy will close your operation when the market price crossed the stop loss.
The strategy will close operation when the line based on the volatility will crossed

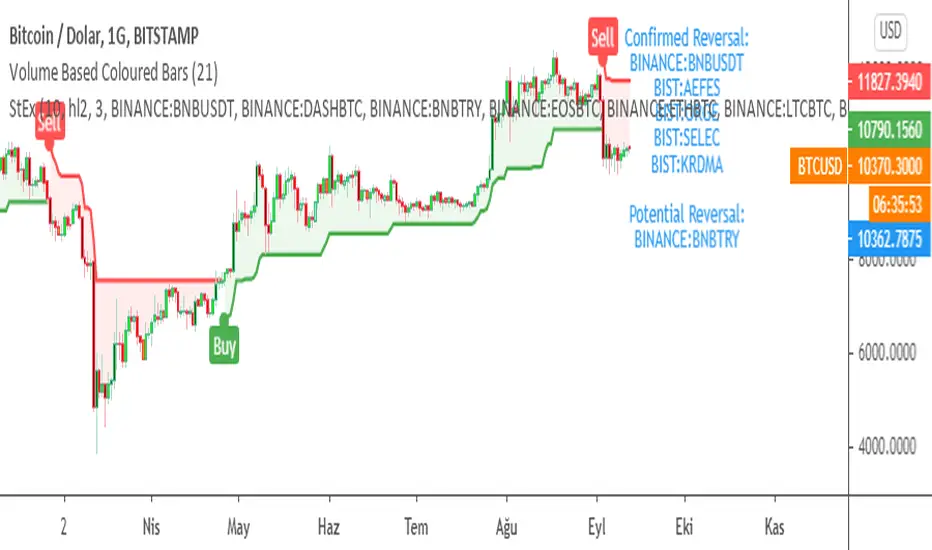
SuperTrend EXPLORER / SCREENERSUPERTREND EXPLORER / SCREENER screens the BUY and SELL signals (trend reversals) for 38 user defined different tickers in Tradingview charts.
Simply input the short name of the ticker in Tradingview that you want to screen.
Script is derived from zzzcrypto123 's work. Thanks for the permission letting me to use his logic.
Terminology explanation:
Confirmed Reversal: Supertrend reversal that happened in the last bar and cannot be repainted.
Potential Reversal: Supertrend reversal that might happen in the current bar but can also not happen depending upon the timeframe closing price.
Screener has also got a built in SuperTrend indicator which users can confirm the reversals on graphs.
Screener explores the 38 tickers in current graph's time frame and also in desired parameters of the SuperTrend indicator.
SUPERTREND INDICATOR:
STRATEGY version of SuperTrend Indicator:
SuperTrend is one of the most common ATR based trailing stop indicators.
In this version you can change the ATR calculation method from the settings. Default method is RMA, when the alternative method is SMA .
The indicator is easy to use and gives an accurate reading about an ongoing trend. It is constructed with two parameters, namely period and multiplier. The default values used while constructing a superindicator are 10 for average true range or trading period and three for its multiplier.
The average true range (ATR) plays an important role in 'Supertrend' as the indicator uses ATR to calculate its value. The ATR indicator signals the degree of price volatility .
The buy and sell signals are generated when the indicator starts plotting either on top of the closing price or below the closing price. A buy signal is generated when the ‘Supertrend’ closes above the price and a sell signal is generated when it closes below the closing price.
It also suggests that the trend is shifting from descending mode to ascending mode. Contrary to this, when a ‘Supertrend’ closes above the price, it generates a sell signal as the colour of the indicator changes into red.
A ‘Supertrend’ indicator can be used on equities, futures or forex, or even crypto markets and also on daily, weekly and hourly charts as well, but generally, it fails in a sideways-moving market.
Source function added to use the indicator as the ATR Trailing Stop indicator.
Just change source type hl2 to close.
different variations might be useful.