Supply and Demand Deluxe (Stock Justice)Introducing " Supply and Demand Deluxe (Stock Justice) " - the ultimate TradingView indicator that revolutionizes how traders identify crucial supply and demand levels. With its unrivaled capabilities across multiple timeframes, this indicator offers a comprehensive toolkit for traders seeking an edge in the market.
To fully harness the power of "Supply and Demand Deluxe," traders can fine-tune the indicator's input parameters to suit their preferences and trading strategies. Let's delve into the key components and functionalities that make this indicator truly exceptional:
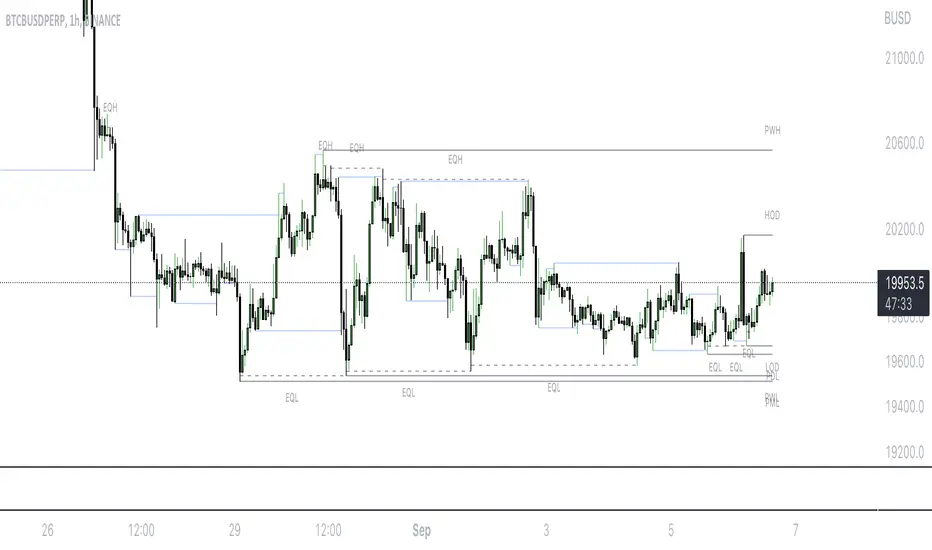
Daily and Weekly Pivots :
The indicator empowers you to plot vital reference points, including the previous week's high and low, yesterday's high and low, and the midpoint of yesterday's range. These plots provide invaluable insights into market sentiment and potential turning points.
Weekly Supply and Demand Levels :
Regardless of what timeframe you are looking at, this indicator allows you to unlock the ability to plot weekly supply and demand levels directly on your chart. Enjoy the freedom to customize the number of levels to plot, choose line colors and styles, and decide whether to extend the lines. For a more comprehensive analysis, enable the "Show Price" option to view the associated prices.
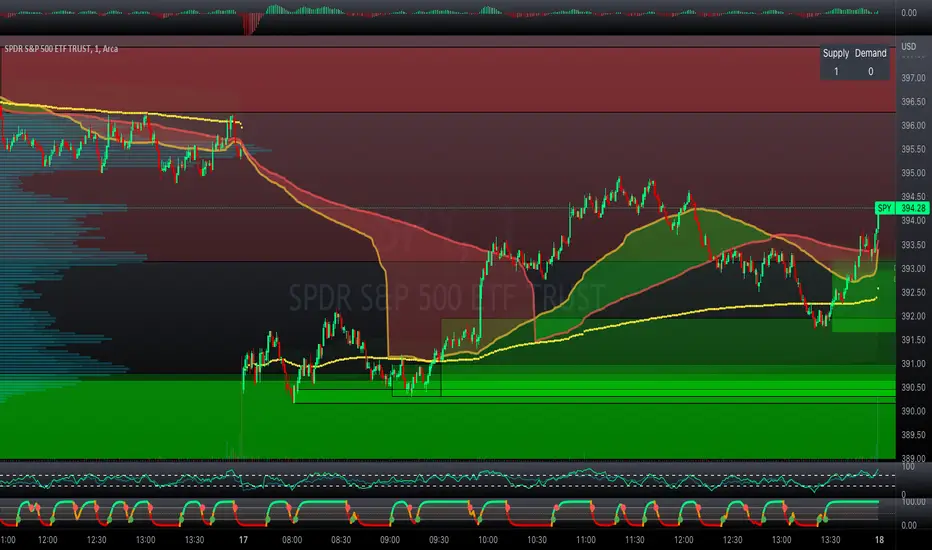
Daily Supply and Demand Levels :
Similar to the weekly levels, this feature allows you to plot daily supply and demand levels with ease. Tailor the number of levels, line colors, and styles to your preferences. The "Extend Left" and "Extend Right" options provide flexibility in determining whether the lines extend to the left, right, or both. Enable the "Show Price" option to display the corresponding prices, enhancing your decision-making process.
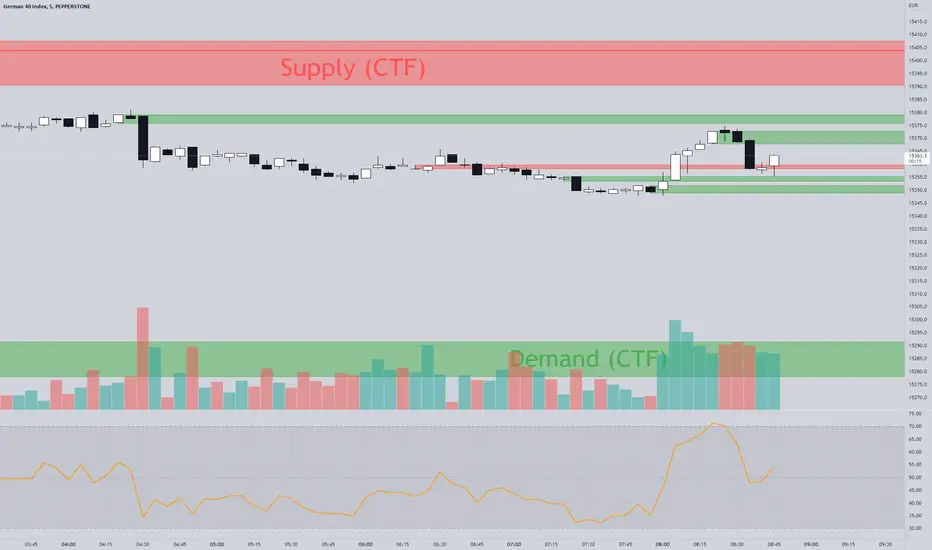
Hourly Supply and Demand Levels :
Effortlessly plot hourly supply and demand levels on your chart. The indicator automatically identifies these levels based on the highest and lowest values of previous ranges. Customize the number of levels, line colors, and styles to match your visual preferences. As with the previous features, you can display prices associated with these levels, amplifying your trading insights.
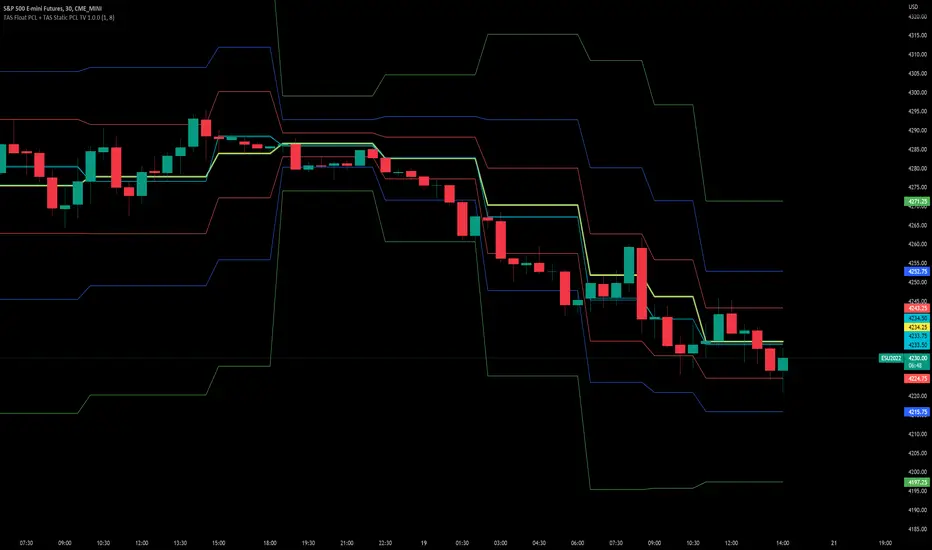
ATR Expected Moves :
Gain a deeper understanding of potential price moves with the ATR Expected Moves feature. Based on the Average True Range (ATR), this functionality allows you to plot expected price ranges. Adjust the lookback length and multipliers to fine-tune the calculation according to your trading style. With the flexibility to extend lines, choose colors and line styles, and display prices, you can adapt the indicator to your specific needs.
Futures Levels :
For futures traders, "Supply and Demand Deluxe" provides specific levels for the Midnight Open, London Open, Asian Open, and the 8:30am EST level. These pre-defined levels act as valuable reference points, enabling you to navigate futures markets with confidence.
By incorporating these cutting-edge features, the Supply and Demand Deluxe indicator by Stock Justice empowers traders to identify key supply and demand levels across various timeframes. Its customizable visual elements and adaptable parameters allow traders to align the indicator with their unique trading strategies, amplifying their potential for success.
////////////////////////
UNIQUENESS
////////////////////////
This one-of-a-kind indicator stands out from existing tools in the market due to its unparalleled combination of features and customization options. While other indicators may focus on specific aspects of supply and demand analysis, "Supply and Demand Deluxe (Stock Justice)" brings together a comprehensive suite of tools that cater to traders across various timeframes. From daily and weekly pivots to hourly supply and demand levels, this indicator covers a wide range of trading scenarios, allowing users to gain a holistic view of market dynamics.
What truly sets "Supply and Demand Deluxe" apart is the fact that it is its emphasis on customization. Traders have the freedom to fine-tune every aspect of the indicator, from the number of plotted levels to the colors, line styles, and extension options. By providing such extensive customization capabilities, this indicator enables traders to align it precisely with their unique trading strategies and preferences. Whether you're an aggressive short-term trader or a patient long-term investor, "Supply and Demand Deluxe" adapts to your individual style, empowering you to make well-informed trading decisions.
Furthermore, the incorporation of the ATR Expected Moves feature adds an extra layer of sophistication to this indicator. By leveraging the Average True Range, traders can gain insights into expected price ranges, enhancing their risk management and trade planning. The ability to adjust the lookback length and multipliers ensures that traders can adapt the ATR calculations to suit their desired level of precision. This feature, combined with the indicator's visual plots and customizable elements, sets "Supply and Demand Deluxe (Stock Justice)" in a league of its own, providing traders with an edge in understanding and navigating the market.
In summary, the uniqueness of "Supply and Demand Deluxe (Stock Justice)" lies in its comprehensive approach to supply and demand analysis, its extensive customization options, and the incorporation of the ATR Expected Moves feature. With its ability to cater to traders across various timeframes and adapt to individual trading styles, this indicator empowers users to unlock the full potential of supply and demand analysis and make informed trading decisions with confidence.
////////////////////////
Embrace the future of trading with "Supply and Demand Deluxe (Stock Justice)" and unleash the full potential of supply and demand analysis in your trading endeavors. Elevate your trading journey with this game-changing indicator.
Indicatore Pine Script®