3D VWAP With Standard Deviation BandsThis indicator is free to all Oasis Trading Group members.
The 3D VWAP uses the VWAP calculation, but instead of 1 day worth of data it uses 3 days to continuously calculate and allow for use of longer time frames while trading. This indicator will also mark the 3D VWAP close as a support and resistance line to use in future trading.
The VWAP line will turn green when ascending and red when descending.
The top and bottom blue lines are standard deviations of the 3D VWAP, you can change how many deviations it uses in the inputs.
For Access or Questions: Private message us. Thank you.
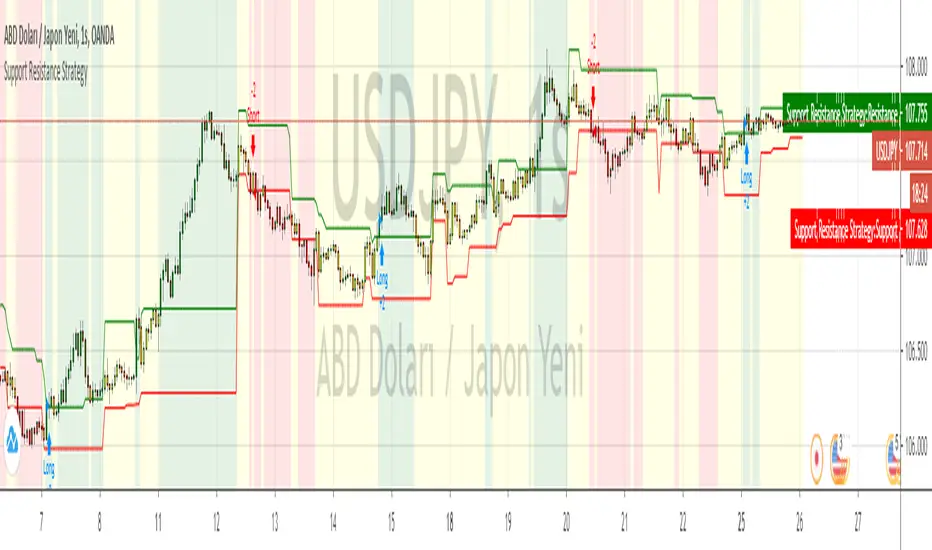
Support
Orderblocks [CosmonautC]Orderblock script, automatically finds orderblocks and then marks them out.
There are 3 inputs:
length == lookback length
Sensitivity == How small/big moves are needed to plot a new orderblock
levels == How many pairs of Orderblock levels to plot. 1 pair = 1 orderblock from a down move and 1 orderblock from an up move
I hope you enjoy it and hopefully can make some better decisions with it :D
#freeα

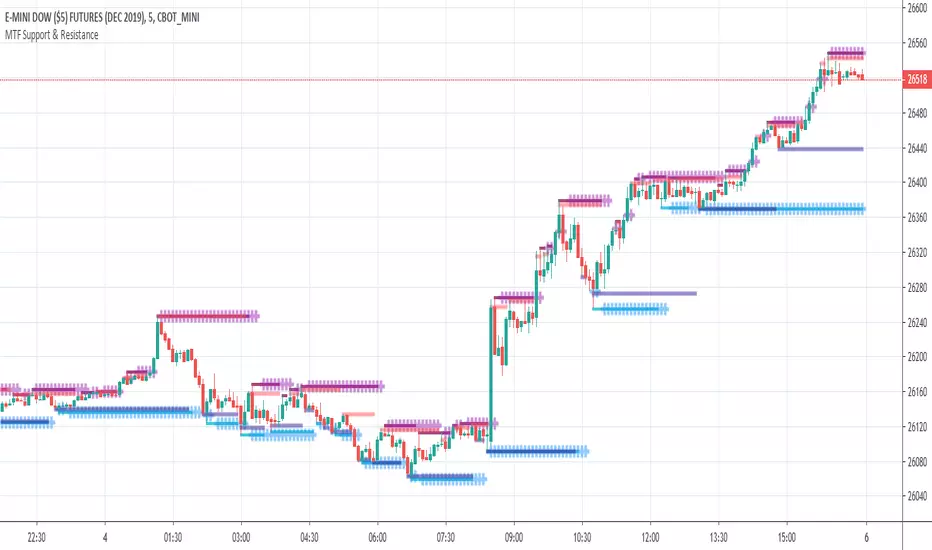
THD MTF Support & ResistanceThe TradersHelpDesk MTF support and resistance identifies the support or resistance on multiple timeframes.
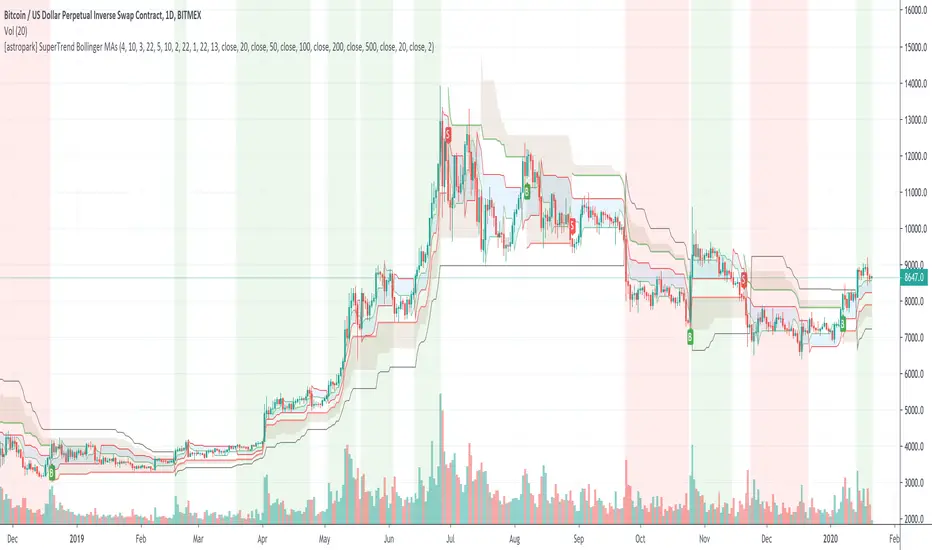
[astropark] SuperTrend Bollinger MAsHi Followers,
here it is a new script, based on SuperTrend indicator!
As plus you will be able to activate Bollinger Bands and 6 simple moving averages.
What's the SuperTrend?
As you can see from the chart, the SuperTrend Indicator
defines moving support & resistance levels for price action with its clouds and trendlines
catches trend changes when black line (the Slow SuperTrend) switches from staying upper price action to down and viceversa
shows you on background bearish momentum in red
shows you on background bullish momentum in green
This is not a free indicator, so send me a private message in order to get access to this script.
Do you like my scripts? Offer me a coffee, a beer, a pizza or whatever :)
BTC jar: 1K5kuYQPEqoNo6GRmJbHWMPmqwKM5S3oRR
ETH jar: 0x091b541a6dd6fe08c4e7bd909baafb2fce9b975e
LTC jar: LSVoAChsZrVsvbNyUfdpxtFpDAUSaUTUig
XRP jar: (XRP deposit tag) 103997763 (XRP deposit address) rEb8TK3gBgk5auZkwc6sHnwrGVJH8DuaLh
PS: Do you need a customization or do you need a dev who implements your strategy? send me a private message ;-)
SWING POINTS HOUNDTry's to find possible swing points and reversal points using mutli time frame moving averages and Fibonacci retracement with multiple lengths. Can be used to gauge trends and find potential entry points for trend following strategies. Can also be used to find potential price reversal points and areas of heavy resistance/support.

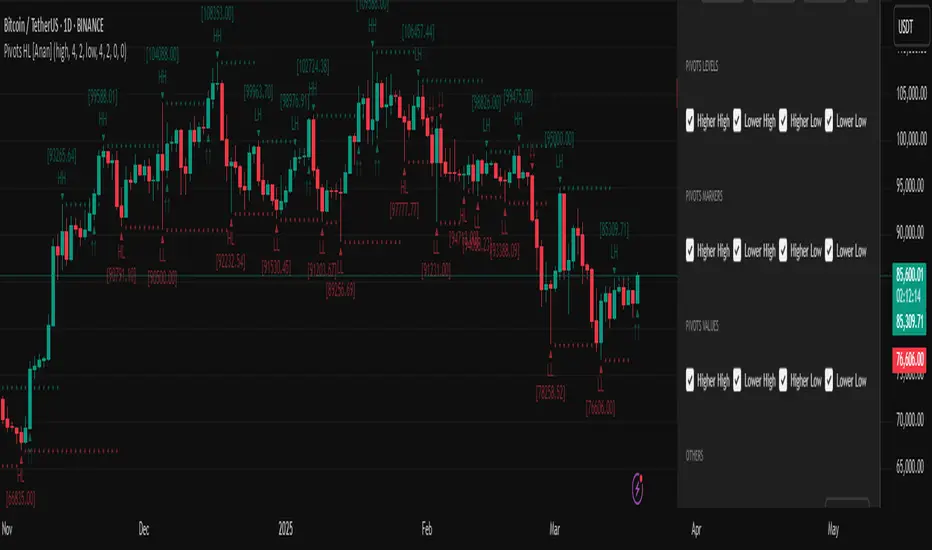
Pivot Points High Low (HH/HL/LH/LL) [Anan]Hello Friends,
This is my own version of ( Pivot Hilo Support n Resistance Levels R3-3 by JustUncleL )
- V4 Pinescript
- Removed MA dependency filters
- Add some arrows
Auto Fibonacci Retracement Levels A Fibonacci retracement is a popular tool that traders can use to identify support and resistance levels, and place stop-loss orders or target prices.
The indicator connects any two points that are relevant, a high and low point.
The percentage levels provided are areas where the price could stall or reverse.
Levels should not be relied on exclusively. For example, it is dangerous to assume the price will reverse after hitting a specific Fibonacci level. It may, but it also may not.
Fibonacci retracement levels are most frequently used to provide potential areas of interest. If a trader wants to buy, they watch for the price to stall at a Fibonacci level and then bounce off that level before buying.
The most commonly used ratios include 23.6%, 38.2%, 50%, 61.8% and 78.6%. These represent how much of a prior move the price has corrected or retraced.

Trend Direction Helper (ZigZag and S/R and HH/LL labels)Hey everyone
First of all, I'd like to thank Ricardo Santos, Backtest Rookies for the inspiration for this script.
Actually, most of it is coming from them and I only mixed them up (and added my secret sauce ^^). If some of you are not thinking about a trading secret sauce, please get serious for a moment :)
Some of you asked me how I do to set the trend direction. You all understood that if you get an UP label, then the price should go up and vice-versa for down.
But it's not so easy to define the good signals for each asset and each timeframe. I'm going to repeat what I said yesterday because ... well... that's what trading is about
So quoting myself here "The inputs set by default will have to be changed for your asset/timeframe and can't be generic for everything. You have to play with the inputs until the signals will make sense to you
The indicator/strategy with a unique configuration that you'll never check or update according to the market condition DOES NOT exit. "
BUT... a bit of patience and practice and you might do wonders.
The Method
I never realized until now but by connecting the higher highs/lower lows, I was drawing zigzag lines.
The Zig Zag Master is Ricardo Santos . Please give him a follow, he's awesome
For those who don't want to draw on the chart or (my preferred choice) need some inspiration to define your trend directions, this script is for YOU (and your family, your pet, your girlfriend/boyfriend, ...)
I think that each asset/timeframe chart has its own history. What worked in a post could work in the future.
In that regard, if a trend direction worked in the past, that's the parameter that I'll use to trade with it in a demo account and make sure it's relevant. If not then I will adjust
If you're trading with new indicators or a new method right away on your real trading account, you're gonna have a bad time imgflip.com
Lines EVERYWHERE
The script draws the classical horizontal pivots + the zig zag lines + the Higher Highs/Lower Lows label in just 1 script. I'm very excited to share a script (on which I coded 100 lines out of 500) but no one else did it
The horizontal pivots part are coming from Backtest Rookies
For more security, you can add a pullback on a moving average after getting a signal. Pullbacks are necessary to limit any eventual loss or maximize your gains by getting in the trend sooner.
I really give you a solid method and a great script in my opinion. 6 years of experience given away for FREE :p (when Dave will start thinking as a business man instead :O)
Does it repaint ?
Getting this question twice a day. You guys are obsessed with the repainting :)
Short answer, yes because it will calculate the pivots and zig zags whenever new higher highs/lower lows will be formed.
However, the trend direction code is based on the candle close so it shouldn't repaint. If it does, please let me know
See you all on Monday
Love you all
Dave
____________________________________________________________
Be sure to hit the thumbs up. Building those indicators take a lot of time and likes are always rewarding for me :) (tips are accepted too)
- If you want to suggest some indicators that I can develop and share with the community, please use my personal TRELLO board
- I'm an officially approved PineEditor/LUA/MT4 approved mentor on codementor. You can request a coaching with me if you want and I'll teach you how to build kick-ass indicators and strategies
Jump on a 1 to 1 coaching with me
- You can also hire for a custom dev of your indicator/strategy/bot/chrome extension/python
Disclaimer:
Trading involves a high level of financial risk, and may not be appropriate because you may experience losses greater than your deposit. Leverage can be against you.
Do not trade with capital that you can not afford to lose. You must be aware and have a complete understanding of all the risks associated with the market and trading. We can not be held responsible for any loss you incur.
Trading also involves risks of gambling addiction.
Please notice I do not provide financial advice - my indicators, strategies, educational ideas are intended to provide only some source code for anyone interested in improving their trading
The proprietary indicators and strategies developed by Best Trading Indicator, the object of intellectual property rights are and remain the exclusive property of Best Trading Indicator, at the exclusion of images and videos and texts free of rights or provided by the Company or external legal or physical person.
No assignment of intellectual property rights is carried out through these Terms and Conditions.
Any total or partial reproduction, modification or use of these properties for any reason whatsoever is strictly prohibited without the express written authorization of the Company.

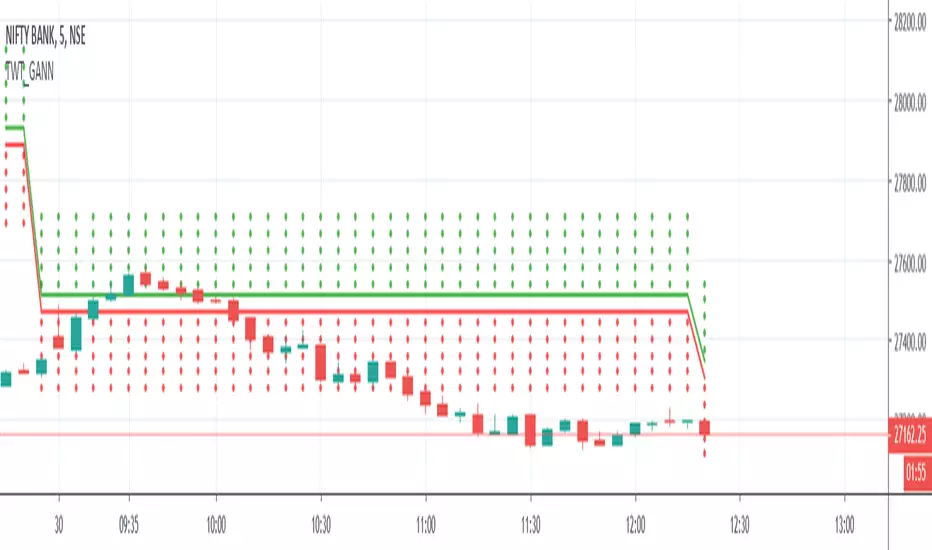
TWT_GANNGann Square of 9 is being calculated in this script and plotted
Price which is being considered for calculation is :: Session Open Price ( It means everyday Open Price)
BUY near/above GREEN Straight Line
SELL near/below RED straight line
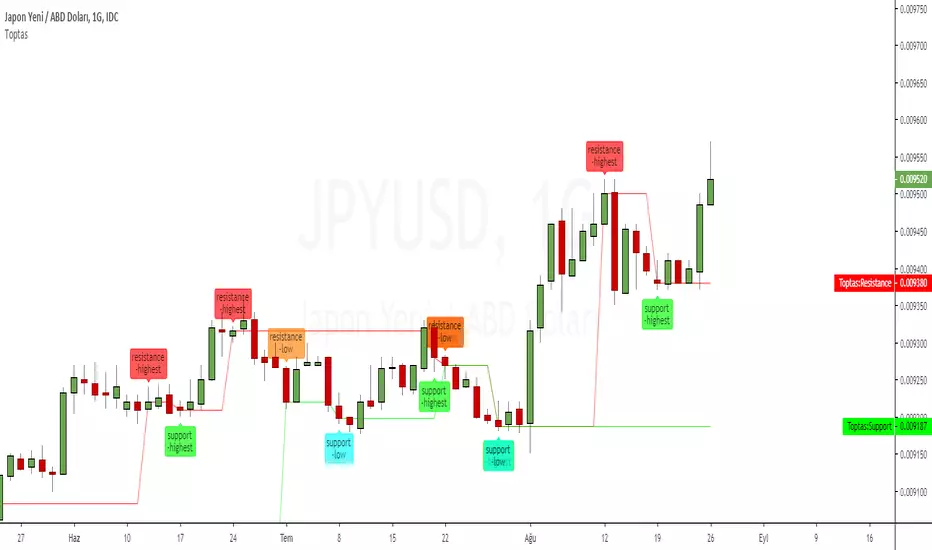
ToptasToptas
I wanted to share "script" of Toptas with you. Very easy to use this script
You can select short and long days
You can choose time (Daily, 4 hours, 1 week etc.)
This script will show you - ( Low Support , High Support - Low Resistance , High Resistance)
All I ask is that you choose the TIME well. ( long-term investors should keep time high ; 1 week , 1 month. if If you are a short term investor; 1 hours, 4 hours etc.)
Plenty of earnings for everyone.
[PX] MTF Fractal Level This script identifies multi-timeframe fractal level, which can be used as support and resistance.
If you are looking for someone to develop your own indicator or trading strategy, don't hesitate to get in touch with me here on TradingView or below.
Contact:
www.pascal-simon.de
info@pascal-simon.de

[PX] Level & TrendlinesThe indicator identifies the intermediate fractal pattern, where neighboring fractals are either higher or lower. It plots horizontal level and trendlines based on those fractals and comes with a variety of settings.
If you are looking for someone to develop your on indicator or trading strategy, don't hesitate to get in touch with me here on TradingView or below.
Contact:
www.pascal-simon.de
info@pascal-simon.de

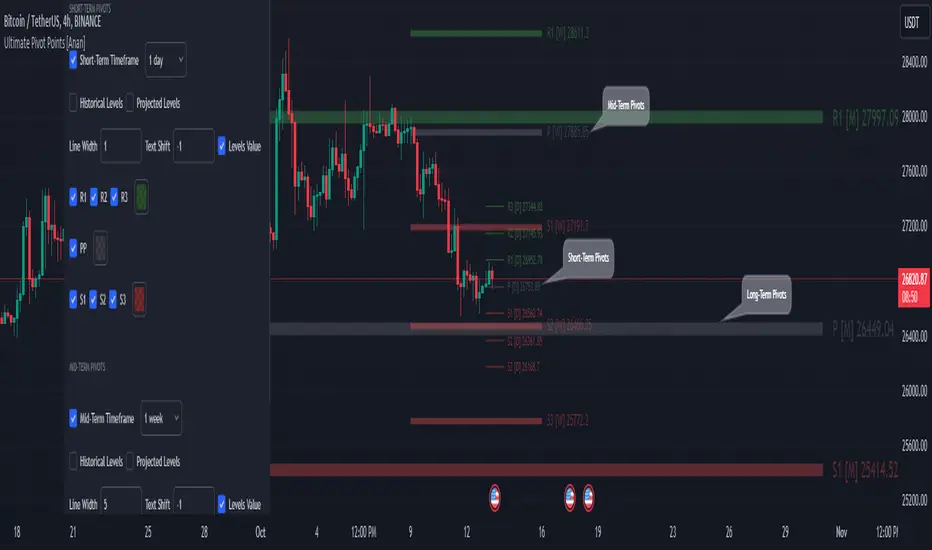
Ultimate Pivot Points [MTF/3in1/4Types/Projection/Alerts]-[Anan]Ultimate Pivot Points !
- V4 Pinescript.
- 4 Types of Pivot Points (Traditional , Fibonacci , Woodie , Camarilla ).
- Multi-time Frame: you can select Pivots Timeframe (1m, 3m ,5m,15m,30m,45m,1h,2h,3h,4h,1D,1W,1M).
- Three Pivot Points in one chart, I called them and they all have option to show or hide.
- Unlimited Number Of Pivots Back for all periods.
- Projection Pivot Points Levels.
- Each Pivot line have a label and value with period .
- Control with Line Width.
- Control with labels location with Text Shift Factor.
- Separate alerts for every Pivot Points levels.
Thanks QuantNomad for the inspiration.
[CE]LevelsThis indicator is designed to show you simple Support & Resistance levels, it also has VWAP built in.

Support/Resistance (Rupprecht)Set the maximum data points to look back for a support resistance line, then set the pivot point threshold and your off to the races.
Very effective solution to have your support resistance points automatically show up on your chart. A good tip is to include 2 or 3 of this indicator on your chart with varying levels of degree for support and resistance categorized by color.
Best of luck :)

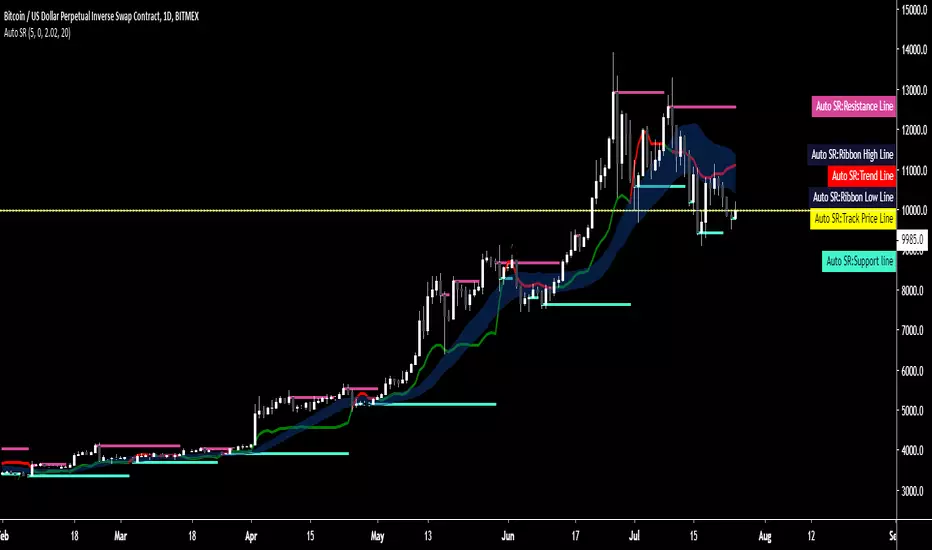
Auto SR - Automatic Support & ResistanceAuto SR is an indicator for TradingView™ which automatically searches and prints key support and resistance levels.
Its strength lies within its ability to provide visualization in real-time to aid in your trading.
It's a versatile indicator suitable for both short or long time frames and has a precision of 8 decimal points, therefore making it suitable for any market type.
A trend line shows a shift in major trends while a ribbon shows you shifts in smaller trends and indications are given for break and re-entry of both support and resistance levels.
All conditions are coupled with their own alerts, giving you the option to integrate it into your trading system or receive alerts on-the-fly.
Tried, true and tested for over one year, Auto SR has already become a trusted staple of those who've experienced it.
As a standalone system or an addition to your existing strategy, Auto SR has what it takes to elevate your trading to the next level.
Key Features:
- Automatic charting of support and resistance lines charted in real-time, no repainting.
- Major and minor trend detection
- Full alerts for support and resistance forming, price exiting or re-entering lines, trend shifts and more.
Ichimoku Compass(Ichimoku Cloud)Ichimoku Cloud Indicator for visualizing support/resistance levels. Candles turn from green to white when negative trend is detected.

Support/Resistance LevelsThis script will show lines of support/resistance in each period you set (default is 1week). It shows 6 levels with the difference you can set too (default is 5%). The reason why I set default as 5% because as I notice the market will get bounced when it reach 5% up/down and hold that level for some time before it start moving up/down again. Hope this script will help you decide whether it's time to buy/sell when it reached the levels. Thank you.
Automatic Support & ResistanceThe indicator attempts at automatic detection of support and resistance levels by identifying large swings/pivots in historical price action. These tops and bottoms in price action show where lots of buyers or sellers came into the market and might act as future levels of support or resistance. By default, the code detects the last 3 significant swing highs and the last 3 swing lows. It then places lines on the chart to highlight those levels.
Once you are comfortable with the code base and how the indicator operates, you may wish to expand upon it. One obvious addition to make would be inputs for the "Left Bars", "Right Bars" and "Quick Right" variables so that you can tune the indicator according to your own taste.
Feel free to tweak the code and let everyone know in the comment section if you are able to improvise it.
Happy trading:-)

MarketSpy S/RMarketSpy trading suite was designed to sniff out momentum swings and allow you to profit riding the wave. No matter what market, no matter the timeframe - this is all you need, from here on out this is your trading desk.
It's made up of three main components (with future add-ons in development):
1. MarketSpy X - MSX is the ultimate entry and exit tool that is built using custom momentum algorithm to find exact moments of reversals - without a fail. It's the one on the bottom with "green pulse dot" buy signals and "blood diamond" sell indicators. With a little bit of common sense, this alone will turn your trades into profit instantly.
2. MarketSpy ARmageddon (Augmented Reality) - price action overlay that analyses trends and is a confirmation tool for MarketSpy X. Can show confluence from top 5 market indicators, gives signals of reversals or chop zones, predicts prices(!) and is fully dynamic that reacts to market conditions LIVE.
3. MarketSpy S/R - This thing sniffs out and draws support and resistance based on math, not human eye. This means that MarketSpy effectively can go head to head with bots and algorithms and see right through the market to give you incredibly accurate points of interest where machines and humans sell and buy - ride the way together with the whales. Sounds cliche until you try it.
For more - visit our discord.

[RD] VLC - Variable Line Channels==================================================================
July 7 2019 - VLC - Variable Line Channels © RootDuk
==================================================================
Easy draw gann or fibb lines based on the variables you find in the input
screen. Use the barsback input to define the highs and lows in a given
amount of bars
===================================================================
Updates
===================================================================
V1:
release
===================================================================
Support appreciated, thanks (keeps me motivated :)
===================================================================
BTC: 1C7sk3x8o2sX5eBV5HSz3KAgXJJ3FsF2Mo
ETH: 0xa14f3059EcDAE4aEe2E17826033E1D2C7e83233e
BNB: bnb1kwe3hqp4e8ch02ruhpclau4tvf0enzzh5tc2e3
===================================================================