Techindicator

SlopeUtilsLibrary "SlopeUtils"
calcSlope(src, atr_series, length)
Calculates a normalized slope based on price change relative to ATR.
Parameters:
src (float) : (series float) The source input (e.g., close).
atr_series (float) : (series float) The ATR value for normalization.
length (simple int) : (simple int) The lookback period for the slope calculation.
Returns: (float) The normalized slope value.


LuxyEnergyIndexThe Luxy Energy Index (LEI) library provides functions to measure price movement exhaustion by analyzing three dimensions: Extension (distance from fair value), Velocity (speed of movement), and Volume (confirmation level).
LEI answers a different question than traditional momentum indicators: instead of "how far has price gone?" (like RSI), LEI asks "how tired is this move?"
This library allows Pine Script developers to integrate LEI calculations into their own indicators and strategies.
How to Import
//@version=6
indicator("My Indicator")
import OrenLuxy/LuxyEnergyIndex/1 as LEI
Main Functions
`lei(src)` → float
Returns the LEI value on a 0-100 scale.
src (optional): Price source, default is `close`
Returns : LEI value (0-100) or `na` if insufficient data (first 50 bars)
leiValue = LEI.lei()
leiValue = LEI.lei(hlc3) // custom source
`leiDetailed(src)` → tuple
Returns LEI with all component values for detailed analysis.
= LEI.leiDetailed()
Returns:
`lei` - Final LEI value (0-100)
`extension` - Distance from VWAP in ATR units
`velocity` - 5-bar price change in ATR units
`volumeZ` - Volume Z-Score
`volumeModifier` - Applied modifier (1.0 = neutral)
`vwap` - VWAP value used
Component Functions
| Function | Description | Returns |
|-----------------------------------|---------------------------------|---------------|
| `calcExtension(src, vwap)` | Distance from VWAP / ATR | float |
| `calcVelocity(src)` | 5-bar price change / ATR | float |
| `calcVolumeZ()` | Volume Z-Score | float |
| `calcVolumeModifier(volZ)` | Volume modifier | float (≥1.0) |
| `getVWAP()` | Auto-detects asset type | float |
Signal Functions
| Function | Description | Returns |
|---------------------------------------------|----------------------------------|-----------|
| `isExhausted(lei, threshold)` | LEI ≥ threshold (default 70) | bool |
| `isSafe(lei, threshold)` | LEI ≤ threshold (default 30) | bool |
| `crossedExhaustion(lei, threshold)` | Crossed into exhaustion | bool |
| `crossedSafe(lei, threshold)` | Crossed into safe zone | bool |
Utility Functions
| Function | Description | Returns |
|----------------------------|-------------------------|-----------|
| `getZone(lei)` | Zone name | string |
| `getColor(lei)` | Recommended color | color |
| `hasEnoughHistory()` | Data check | bool |
| `minBarsRequired()` | Required bars | int (50) |
| `version()` | Library version | string |
Interpretation Guide
| LEI Range | Zone | Meaning |
|-------------|--------------|--------------------------------------------------|
| 0-30 | Safe | Low exhaustion, move may continue |
| 30-50 | Caution | Moderate exhaustion |
| 50-70 | Warning | Elevated exhaustion |
| 70-100 | Exhaustion | High exhaustion, increased reversal risk |
Example: Basic Usage
//@version=6
indicator("LEI Example", overlay=false)
import OrenLuxy/LuxyEnergyIndex/1 as LEI
// Get LEI value
leiValue = LEI.lei()
// Plot with dynamic color
plot(leiValue, "LEI", LEI.getColor(leiValue), 2)
// Reference lines
hline(70, "High", color.red)
hline(30, "Low", color.green)
// Alert on exhaustion
if LEI.crossedExhaustion(leiValue) and barstate.isconfirmed
alert("LEI crossed into exhaustion zone")
Technical Details
Fixed Parameters (by design):
Velocity Period: 5 bars
Volume Period: 20 bars
Z-Score Period: 50 bars
ATR Period: 14
Extension/Velocity Weights: 50/50
Asset Support:
Stocks/Forex: Uses Session VWAP (daily reset)
Crypto: Uses Rolling VWAP (50-bar window) - auto-detected
Edge Cases:
Returns `na` until 50 bars of history
Zero volume: Volume modifier defaults to 1.0 (neutral)
Credits and Acknowledgments
This library builds upon established technical analysis concepts:
VWAP - Industry standard volume-weighted price measure
ATR by J. Welles Wilder Jr. (1978) - Volatility normalization
Z-Score - Statistical normalization method
Volume analysis principles from Volume Spread Analysis (VSA) methodology
Disclaimer
This library is provided for **educational and informational purposes only**. It does not constitute financial advice. Past performance does not guarantee future results. The exhaustion readings are probabilistic indicators, not guarantees of price reversal. Always conduct your own research and use proper risk management when trading.

MLExtensionsLibrary "MLExtensions"
A set of extension methods for a novel implementation of a Approximate Nearest Neighbors (ANN) algorithm in Lorentzian space.
normalizeDeriv(src, quadraticMeanLength)
Returns the smoothed hyperbolic tangent of the input series.
Parameters:
src (float) : The input series (i.e., the first-order derivative for price).
quadraticMeanLength (int) : The length of the quadratic mean (RMS).
Returns: nDeriv The normalized derivative of the input series.
normalize(src, min, max)
Rescales a source value with an unbounded range to a target range.
Parameters:
src (float) : The input series
min (float) : The minimum value of the unbounded range
max (float) : The maximum value of the unbounded range
Returns: The normalized series
rescale(src, oldMin, oldMax, newMin, newMax)
Rescales a source value with a bounded range to anther bounded range
Parameters:
src (float) : The input series
oldMin (float) : The minimum value of the range to rescale from
oldMax (float) : The maximum value of the range to rescale from
newMin (float) : The minimum value of the range to rescale to
newMax (float) : The maximum value of the range to rescale to
Returns: The rescaled series
getColorShades(color)
Creates an array of colors with varying shades of the input color
Parameters:
color (color) : The color to create shades of
Returns: An array of colors with varying shades of the input color
getPredictionColor(prediction, neighborsCount, shadesArr)
Determines the color shade based on prediction percentile
Parameters:
prediction (float) : Value of the prediction
neighborsCount (int) : The number of neighbors used in a nearest neighbors classification
shadesArr (array) : An array of colors with varying shades of the input color
Returns: shade Color shade based on prediction percentile
color_green(prediction)
Assigns varying shades of the color green based on the KNN classification
Parameters:
prediction (float) : Value (int|float) of the prediction
Returns: color
color_red(prediction)
Assigns varying shades of the color red based on the KNN classification
Parameters:
prediction (float) : Value of the prediction
Returns: color
tanh(src)
Returns the the hyperbolic tangent of the input series. The sigmoid-like hyperbolic tangent function is used to compress the input to a value between -1 and 1.
Parameters:
src (float) : The input series (i.e., the normalized derivative).
Returns: tanh The hyperbolic tangent of the input series.
dualPoleFilter(src, lookback)
Returns the smoothed hyperbolic tangent of the input series.
Parameters:
src (float) : The input series (i.e., the hyperbolic tangent).
lookback (int) : The lookback window for the smoothing.
Returns: filter The smoothed hyperbolic tangent of the input series.
tanhTransform(src, smoothingFrequency, quadraticMeanLength)
Returns the tanh transform of the input series.
Parameters:
src (float) : The input series (i.e., the result of the tanh calculation).
smoothingFrequency (int)
quadraticMeanLength (int)
Returns: signal The smoothed hyperbolic tangent transform of the input series.
n_rsi(src, n1, n2)
Returns the normalized RSI ideal for use in ML algorithms.
Parameters:
src (float) : The input series (i.e., the result of the RSI calculation).
n1 (simple int) : The length of the RSI.
n2 (simple int) : The smoothing length of the RSI.
Returns: signal The normalized RSI.
n_cci(src, n1, n2)
Returns the normalized CCI ideal for use in ML algorithms.
Parameters:
src (float) : The input series (i.e., the result of the CCI calculation).
n1 (simple int) : The length of the CCI.
n2 (simple int) : The smoothing length of the CCI.
Returns: signal The normalized CCI.
n_wt(src, n1, n2)
Returns the normalized WaveTrend Classic series ideal for use in ML algorithms.
Parameters:
src (float) : The input series (i.e., the result of the WaveTrend Classic calculation).
n1 (simple int)
n2 (simple int)
Returns: signal The normalized WaveTrend Classic series.
n_adx(highSrc, lowSrc, closeSrc, n1)
Returns the normalized ADX ideal for use in ML algorithms.
Parameters:
highSrc (float) : The input series for the high price.
lowSrc (float) : The input series for the low price.
closeSrc (float) : The input series for the close price.
n1 (simple int) : The length of the ADX.
regime_filter(src, threshold, useRegimeFilter)
Parameters:
src (float)
threshold (float)
useRegimeFilter (bool)
filter_adx(src, length, adxThreshold, useAdxFilter)
filter_adx
Parameters:
src (float) : The source series.
length (simple int) : The length of the ADX.
adxThreshold (int) : The ADX threshold.
useAdxFilter (bool) : Whether to use the ADX filter.
Returns: The ADX.
filter_volatility(minLength, maxLength, useVolatilityFilter)
filter_volatility
Parameters:
minLength (simple int) : The minimum length of the ATR.
maxLength (simple int) : The maximum length of the ATR.
useVolatilityFilter (bool) : Whether to use the volatility filter.
Returns: Boolean indicating whether or not to let the signal pass through the filter.
backtest(high, low, open, startLongTrade, endLongTrade, startShortTrade, endShortTrade, isEarlySignalFlip, maxBarsBackIndex, thisBarIndex, src, useWorstCase)
Performs a basic backtest using the specified parameters and conditions.
Parameters:
high (float) : The input series for the high price.
low (float) : The input series for the low price.
open (float) : The input series for the open price.
startLongTrade (bool) : The series of conditions that indicate the start of a long trade.
endLongTrade (bool) : The series of conditions that indicate the end of a long trade.
startShortTrade (bool) : The series of conditions that indicate the start of a short trade.
endShortTrade (bool) : The series of conditions that indicate the end of a short trade.
isEarlySignalFlip (bool) : Whether or not the signal flip is early.
maxBarsBackIndex (int) : The maximum number of bars to go back in the backtest.
thisBarIndex (int) : The current bar index.
src (float) : The source series.
useWorstCase (bool) : Whether to use the worst case scenario for the backtest.
Returns: A tuple containing backtest values
init_table()
init_table()
Returns: tbl The backtest results.
update_table(tbl, tradeStatsHeader, totalTrades, totalWins, totalLosses, winLossRatio, winrate, earlySignalFlips)
update_table(tbl, tradeStats)
Parameters:
tbl (table) : The backtest results table.
tradeStatsHeader (string) : The trade stats header.
totalTrades (float) : The total number of trades.
totalWins (float) : The total number of wins.
totalLosses (float) : The total number of losses.
winLossRatio (float) : The win loss ratio.
winrate (float) : The winrate.
earlySignalFlips (float) : The total number of early signal flips.
Returns: Updated backtest results table.

ZigZagCoreZigZagCore
ZigZagCore is a generic ZigZag engine that works with any user-defined threshold (ATR-based, volatility-based, fixed ticks, etc.).
API
import ReflexSignals/ZigZagCore/ as zz
var zz.ZzState state = zz.zz_new()
float thr = ... // your threshold in price units
state := zz.zz_update(state, thr)
zz_update(state, thr)
Parameters:
state (ZzState)
thr (float)
ZzState
Fields:
dir (series int)
highSinceLow (series float)
lowSinceHigh (series float)
lastHighLevel (series float)
lastLowLevel (series float)
lastHighIndex (series int)
lastLowIndex (series int)
highSinceLowIndex (series int)
lowSinceHighIndex (series int)
isNewHigh (series bool)
isNewLow (series bool)
Directional State
dir = 1 → market is in an upswing
dir = -1 → market is in a downswing
dir = na → initial undecided state
Live Swing Tracking (Unconfirmed Leg)
Continuously updated swing extremes:
highSinceLow — highest price since the last confirmed low
lowSinceHigh — lowest price since the last confirmed high
Their corresponding bar indices
These fields describe the current active swing leg, which updates every bar until a pivot is confirmed.
Pivot Detection
A pivot confirms only when price moves beyond the prior swing extreme by more than threshold. When this occurs, the library sets:
isNewHigh = true (on the detection bar only) and updates lastHighLevel, lastHighIndex
isNewLow = true and updates lastLowLevel, lastLowIndex

CoreMACDHTF [CHE]Library "CoreMACDHTF"
calc_macd_htf(src, preset_str, smooth_len)
Parameters:
src (float)
preset_str (simple string)
smooth_len (int)
is_hist_rising(src, preset_str, smooth_len)
Parameters:
src (float)
preset_str (simple string)
smooth_len (int)
hist_rising_01(src, preset_str, smooth_len)
Parameters:
src (float)
preset_str (simple string)
smooth_len (int)
CoreMACDHTF — Hardcoded HTF MACD Presets with Smoothed Histogram Regime Flags
Summary
CoreMACDHTF provides a reusable MACD engine that approximates higher-timeframe behavior by selecting hardcoded EMA lengths based on the current chart timeframe, then optionally smoothing the resulting histogram with a stateful filter. It is published as a Pine v6 library but intentionally includes a minimal demo plot so you can validate behavior directly on a chart. The primary exported outputs are MACD, signal, a smoothed histogram, and the resolved lengths plus a timeframe tag. In addition, it exposes a histogram rising condition so importing scripts can reuse the same regime logic instead of re-implementing it.
Motivation: Why this design?
Classic MACD settings are often tuned to one timeframe. When you apply the same parameters to very different chart intervals, the histogram can become either too noisy or too sluggish. This script addresses that by using a fixed mapping from the chart timeframe into a precomputed set of EMA lengths, aiming for more consistent “tempo” across intervals. A second problem is histogram micro-chop around turning points; the included smoother reduces short-run flips so regime-style conditions can be more stable for alerts and filters.
What’s different vs. standard approaches?
Reference baseline: a standard MACD using fixed fast, slow, and signal lengths on the current chart timeframe.
Architecture differences:
Automatic timeframe bucketing that selects a hardcoded length set for the chosen preset.
Two preset families: one labeled A with lengths three, ten, sixteen; one labeled B with lengths twelve, twenty-six, nine.
A custom, stateful histogram smoother intended to damp noisy transitions.
Library exports that return both signals and metadata, plus a dedicated “histogram rising” boolean.
Practical effect:
The MACD lengths change when the chart timeframe changes, so the oscillator’s responsiveness is not constant across intervals by design.
The rising-flag logic is based on the smoothed histogram, which typically reduces single-bar flip noise compared to using the raw histogram directly.
How it works (technical)
1. The script reads the chart timeframe and converts it into milliseconds using built-in timeframe helpers.
2. It assigns the timeframe into a bucket label, such as an intraday bucket or a daily-and-above bucket, using fixed thresholds.
3. It resolves a hardcoded fast, slow, and signal length triplet based on:
The selected preset family.
The bucket label.
In some cases, the current minute multiplier for finer mapping.
4. It computes fast and slow EMAs on the selected source and subtracts them to obtain MACD, then computes an EMA of MACD for the signal line.
5. The histogram is derived from the difference between MACD and signal, then passed through a custom smoother.
6. The smoother uses persistent internal state to carry forward its intermediate values from bar to bar. This is intentional and means the smoothing output depends on contiguous bar history.
7. The histogram rising flag compares the current smoothed histogram to its prior value. On the first comparable bar it defaults to “rising” to avoid a missing prior reference.
8. Exports:
A function that returns MACD, signal, smoothed histogram, the resolved lengths, and a text tag.
A function that returns the boolean rising state.
A function that returns a numeric one-or-zero series for direct plotting or downstream numeric logic.
HTF note: this is not a true higher-timeframe request. It does not fetch higher-timeframe candles. It approximates HTF feel by selecting different lengths on the current timeframe.
Parameter Guide
Source — Input price series used for EMA calculations — Default close — Trade-offs/Tips
Preset — Selects the hardcoded mapping family — Default preset A — Preset A is more reactive than preset B in typical use
Table Position — Anchor for an information table — Default top right — Present but not wired in the provided code (Unknown/Optional)
Table Size — Text size for the information table — Default normal — Present but not wired in the provided code (Unknown/Optional)
Dark Mode — Theme toggle for the table — Default enabled — Present but not wired in the provided code (Unknown/Optional)
Show Table — Visibility toggle for the table — Default enabled — Present but not wired in the provided code (Unknown/Optional)
Zero dead-band (epsilon) — Intended neutral band around zero for regime classification — Default zero — Present but not used in the provided code (Unknown/Optional)
Acceptance bars (n) — Intended debounce count for regime confirmation — Default three — Present but not used in the provided code (Unknown/Optional)
Smoothing length — Length controlling the histogram smoother’s responsiveness — Default nine — Smaller values react faster but can reintroduce flip noise
Reading & Interpretation
Smoothed histogram: use it as the momentum core. A positive value implies MACD is above signal, a negative value implies the opposite.
Histogram rising flag:
True means the smoothed histogram increased compared to the prior bar.
False means it did not increase compared to the prior bar.
Demo plot:
The included plot outputs one when rising is true and zero otherwise. It is a diagnostic-style signal line, not a scaled oscillator display.
Practical Workflows & Combinations
Trend following:
Use rising as a momentum confirmation filter after structural direction is established by higher highs and higher lows, or lower highs and lower lows.
Combine with a simple trend filter such as a higher-timeframe moving average from your main script (Unknown/Optional).
Exits and risk management:
If you use rising to stay in trends, consider exiting or reducing exposure when rising turns false for multiple consecutive bars rather than reacting to a single flip.
If you build alerts, evaluate on closed bars to avoid intra-bar flicker in live candles.
Multi-asset and multi-timeframe:
Because the mapping is hardcoded, validate on each asset class you trade. Volatility regimes differ and the perceived “equivalence” across timeframes is not guaranteed.
For consistent behavior, keep the smoothing length aligned across assets and adjust only when flip frequency becomes problematic.
Behavior, Constraints & Performance
Repaint and confirmation:
There is no forward-looking indexing. The logic uses current and prior values only.
Live-bar values can change until the bar closes, so rising can flicker intra-bar if you evaluate it in real time.
security and HTF:
No higher-timeframe candle requests are used. Length mapping is internal and deterministic per chart timeframe.
Resources:
No loops and no arrays in the core calculation path.
The smoother maintains persistent state, which is lightweight but means results depend on uninterrupted history.
Known limits:
Length mappings are fixed. If your chart timeframe is unusual, the bucket choice may not represent what you expect.
Several table and regime-related inputs are declared but not used in the provided code (Unknown/Optional).
The smoother is stateful; resetting chart history or changing symbol can alter early bars until state settles.
Sensible Defaults & Quick Tuning
S tarting point:
Preset A
Smoothing length nine
Source close
Tuning recipes:
Too many flips: increase smoothing length and evaluate rising only on closed bars.
Too sluggish: reduce smoothing length, but expect more short-run reversals.
Different timeframe feel after switching intervals: keep preset fixed and adjust smoothing length first before changing preset.
Want a clean plot signal: use the exported numeric rising series and apply your own display rules in the importing script.
What this indicator is—and isn’t
This is a momentum and regime utility layer built around a MACD-style backbone with hardcoded timeframe-dependent parameters and an optional smoother. It is not a complete trading system, not a risk model, and not predictive. Use it in context with market structure, execution rules, and risk controls.
Disclaimer
The content provided, including all code and materials, is strictly for educational and informational purposes only. It is not intended as, and should not be interpreted as, financial advice, a recommendation to buy or sell any financial instrument, or an offer of any financial product or service. All strategies, tools, and examples discussed are provided for illustrative purposes to demonstrate coding techniques and the functionality of Pine Script within a trading context.
Any results from strategies or tools provided are hypothetical, and past performance is not indicative of future results. Trading and investing involve high risk, including the potential loss of principal, and may not be suitable for all individuals. Before making any trading decisions, please consult with a qualified financial professional to understand the risks involved.
By using this script, you acknowledge and agree that any trading decisions are made solely at your discretion and risk.
Do not use this indicator on Heikin-Ashi, Renko, Kagi, Point-and-Figure, or Range charts, as these chart types can produce unrealistic results for signal markers and alerts.
Best regards and happy trading
Chervolino

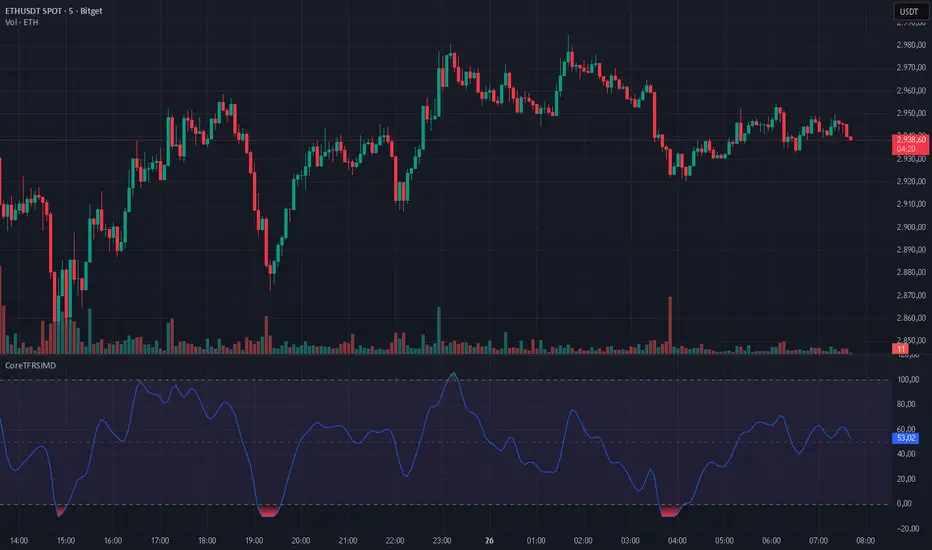
CoreTFRSIMD CoreTFRSIMD library — Reusable TFRSI core for consistent momentum inputs across scripts
The library provides a reusable exported function such as calcTfrsi(src, len, signalLen) so you can compute TFRSI in your own indicators or strategies, e.g. tfrsi = CoreTFRSIMD.calcTfrsi(close, 6, 2)
Summary
CoreTFRSIMD is a Pine Script v6 library that implements a TFRSI-style oscillator core and exposes it as a reusable exported function. It is designed for authors who want the same TFRSI calculation across multiple indicators or strategies without duplicating logic. The library includes a simple demo plot and band styling so you can visually sanity-check the output. No higher-timeframe sampling is used, and there are no loops or arrays, so runtime cost is minimal for typical chart usage.
Motivation: Why this design?
When you reuse an oscillator across different tools, small implementation differences create inconsistent signals and hard-to-debug results. This library isolates the signal path into one exported function so that every dependent script consumes the exact same oscillator output. The design combines filtering, normalization, and a final smoothing pass to produce a stable, RSI-like readout intended for momentum and regime context.
What’s different vs. standard approaches?
Baseline: Traditional RSI computed directly from gains and losses with standard smoothing.
Architecture differences:
A high-pass stage to attenuate slower components before the main smoothing.
A multi-pole smoothing stage implemented with persistent state to reduce noise.
A running peak-tracker style normalization that adapts to changing signal amplitude.
A final signal smoothing layer using a simple moving average.
Practical effect:
The oscillator output tends to be less dominated by raw volatility spikes and more consistent across changing conditions.
The normalization step helps keep the output in an RSI-like reading space without relying on fixed scaling.
How it works (technical)
1. Input source: The exported function accepts a source series and two integer parameters controlling responsiveness and final smoothing.
2. High-pass stage: A recursive filter is applied to the source to emphasize shorter-term movement. This stage uses persistent storage so it can reference prior internal states across bars.
3. Smoothing stage: The filtered stream is passed through a SuperSmoother-like recursive smoother derived from the chosen length. This again uses persistent state and prior values for continuity.
4. Adaptive normalization: The absolute magnitude of the smoothed stream is compared to a slowly decaying reference level. If the current magnitude exceeds the reference, the reference is updated. This acts like a “peak hold with decay” so the oscillator scales relative to recent conditions.
5. Oscillator mapping: The normalized value is mapped into an RSI-like reading range.
6. Signal smoothing: A simple moving average is applied over the requested signal length to reduce bar-to-bar chatter.
7. Demo rendering: The library script plots the oscillator, draws horizontal guide levels, and applies background plus gradient fills for overbought and oversold regions.
Parameter Guide
Parameter — Effect — Default — Trade-offs/Tips
src — Input series used by the oscillator — close in demo — Use close for general momentum, or a derived series if you want to emphasize a specific behavior.
len — Controls the responsiveness of internal filtering and smoothing — six in demo — Smaller values react faster but can increase short-term noise; larger values smooth more but can lag turns.
signalLen — Controls the final smoothing of the mapped oscillator — two in demo — Smaller values preserve detail but can flicker; larger values reduce flicker but can delay transitions.
Reading & Interpretation
The plot is an oscillator intended to be read similarly to an RSI-style momentum gauge.
The demo includes three reference levels: upper at one hundred, mid at fifty, and lower at zero.
The fills visually emphasize zones above the midline and below the midline. Treat these as context, not as standalone entries.
If the oscillator appears unusually compressed or unusually jumpy, the normalization reference may be adapting to an abrupt change in amplitude. That is expected behavior for adaptive normalization.
Practical Workflows & Combinations
Trend following:
Use structure first, then confirm with oscillator behavior around the midline.
Prefer signals aligned with higher-high higher-low or lower-low lower-high context from price.
Exits/Stops:
Use oscillator loss of momentum as a caution flag rather than an automatic exit trigger.
In strong trends, consider keeping risk rules price-based and use the oscillator mainly to avoid adding into exhaustion.
Multi-asset/Multi-timeframe:
Start with the demo defaults when you want a responsive oscillator.
If an asset is noisier, increase the main length or the signal smoothing length to reduce false flips.
Behavior, Constraints & Performance
Repaint/confirmation: No higher-timeframe sampling is used. Output updates on the live bar like any normal series. There is no explicit closed-bar gating in the library.
security or HTF: Not used, so there is no HTF synchronization risk.
Resources: No loops, no arrays, no large history buffers. Persistent variables are used for filter state.
Known limits: Like any filtered oscillator, sharp gaps and extreme one-bar events can produce transient distortions. The adaptive normalization can also make early bars unstable until enough history has accumulated.
Sensible Defaults & Quick Tuning
Starting values: length six, signal smoothing two.
Too many flips: Increase signal smoothing length, or increase the main length.
Too sluggish: Reduce the main length, or reduce signal smoothing length.
Choppy around midline: Increase signal smoothing length slightly and rely more on price structure filters.
What this indicator is—and isn’t
This library is a reusable signal component and visualization aid. It is not a complete trading system, not predictive, and not a substitute for market structure, execution rules, and risk controls. Use it as a momentum and regime context layer, and validate behavior per asset and timeframe before relying on it.
Disclaimer
The content provided, including all code and materials, is strictly for educational and informational purposes only. It is not intended as, and should not be interpreted as, financial advice, a recommendation to buy or sell any financial instrument, or an offer of any financial product or service. All strategies, tools, and examples discussed are provided for illustrative purposes to demonstrate coding techniques and the functionality of Pine Script within a trading context.
Any results from strategies or tools provided are hypothetical, and past performance is not indicative of future results. Trading and investing involve high risk, including the potential loss of principal, and may not be suitable for all individuals. Before making any trading decisions, please consult with a qualified financial professional to understand the risks involved.
By using this script, you acknowledge and agree that any trading decisions are made solely at your discretion and risk.
Do not use this indicator on Heikin-Ashi, Renko, Kagi, Point-and-Figure, or Range charts, as these chart types can produce unrealistic results for signal markers and alerts.
Best regards and happy trading
Chervolino
reversalLibrary "reversals"
psar(af_start, af_increment, af_max)
Calculates Parabolic Stop And Reverse (SAR)
Parameters:
af_start (simple float) : Initial acceleration factor (Wilder's original: 0.02)
af_increment (simple float) : Acceleration factor increment per new extreme (Wilder's original: 0.02)
af_max (simple float) : Maximum acceleration factor (Wilder's original: 0.20)
Returns: SAR value (stop level for current trend)
fractals()
Detects Williams Fractal patterns (5-bar pattern)
Returns: Tuple with fractal values (na if no fractal)
swings(lookback, source_high, source_low)
Detects swing highs and swing lows using lookback period
Parameters:
lookback (simple int) : Number of bars on each side to confirm swing point
source_high (float) : Price series for swing high detection (typically high)
source_low (float) : Price series for swing low detection (typically low)
Returns: Tuple with swing point values (na if no swing)
pivot(tf)
Calculates classic/standard/floor pivot points
Parameters:
tf (simple string) : Timeframe for pivot calculation ("D", "W", "M")
Returns: Tuple with pivot levels
pivotcam(tf)
Calculates Camarilla pivot points with 8 levels for short-term trading
Parameters:
tf (simple string) : Timeframe for pivot calculation ("D", "W", "M")
Returns: Tuple with pivot levels
pivotdem(tf)
Calculates d-mark pivot points with conditional open/close logic
Parameters:
tf (simple string) : Timeframe for pivot calculation ("D", "W", "M")
Returns: Tuple with pivot levels (only 3 levels)
pivotext(tf)
Calculates extended traditional pivot points with R4-R5 and S4-S5 levels
Parameters:
tf (simple string) : Timeframe for pivot calculation ("D", "W", "M")
Returns: Tuple with pivot levels
pivotfib(tf)
Calculates Fibonacci pivot points using Fibonacci ratios
Parameters:
tf (simple string) : Timeframe for pivot calculation ("D", "W", "M")
Returns: Tuple with pivot levels
pivotwood(tf)
Calculates Woodie's pivot points with weighted closing price
Parameters:
tf (simple string) : Timeframe for pivot calculation ("D", "W", "M")
Returns: Tuple with pivot levels

libpublicLibrary "libpublic"
sma(src, len)
Simple Moving Average
Parameters:
src (float) : Series to use
len (int) : Filtering length
Returns: Filtered series
ema(src, len)
Exponential Moving Average
Parameters:
src (float) : Series to use
len (int) : Filtering length
Returns: Filtered series
rma(src, len)
Wilder's Smoothing (Running Moving Average)
Parameters:
src (float) : Series to use
len (int) : Filtering length
Returns: Filtered series
hma(src, len)
Hull Moving Average
Parameters:
src (float) : Series to use
len (int) : Filtering length
Returns: Filtered series
vwma(src, len)
Volume Weighted Moving Average
Parameters:
src (float) : Series to use
len (int) : Filtering length
Returns: Filtered series
jma(src, len, phase)
Jurik MA
Parameters:
src (float) : Series to use
len (int) : Filtering length
phase (int) : JMA Phase
Returns: Filtered series
c_Ema(_src, _length)
Parameters:
_src (float)
_length (int)
c_zlema(_src, _length)
Parameters:
_src (float)
_length (int)
to_pips(_v)
Convert price to pips.
Parameters:
_v (float) : Price
Returns: Pips
toPips(_v)
Parameters:
_v (float)
get_day(_n)
Get the day of the week
Parameters:
_n (int) : Number of day of week
clear_lines(_arr, _min)
Deletes the lines included in the array.
Parameters:
_arr (array) : Array of lines
_min (int) : Deletes the lines included in the array.
clear_labels(_arr, _min)
Deletes the labels included in the array.
Parameters:
_arr (array) : Array of labels
_min (int) : Deletes the labels included in the array.
clear_boxes(_arr, _min)
Deletes the boxes included in the array.
Parameters:
_arr (array) : Array of boxes
_min (int) : Deletes the boxes included in the array.
tfToInt(_timeframe)
Parameters:
_timeframe (string)
tfCurrentView(_tf)
Parameters:
_tf (float)
f_round(_val, _decimals)
Parameters:
_val (float)
_decimals (int)
getTablePos(_switch)
Parameters:
_switch (string)
getTxtSize(_switch)
Parameters:
_switch (string)
getTendChar(_trendChar)
Parameters:
_trendChar (string)
blueWaves(src, chlLen, avgLen)
Parameters:
src (float)
chlLen (int)
avgLen (int)
candleType(_candle)
Parameters:
_candle (int)
normalizeVolume(_vol, _precision)
Parameters:
_vol (float)
_precision (string)
InSession(sessionTime, sessionTimeZone)
Parameters:
sessionTime (string)
sessionTimeZone (string)
IsSessionStart(sessionTime, sessionTimeZone)
Parameters:
sessionTime (string)
sessionTimeZone (string)
createSessionTime(_timeOffsetStart, _timeOffsetEnd, _offsetTypeStart, _offsetTypeEnd, sessionTimeZone)
Parameters:
_timeOffsetStart (int)
_timeOffsetEnd (int)
_offsetTypeStart (string)
_offsetTypeEnd (string)
sessionTimeZone (string)
oct25libLibrary of technical indicators for use in scripts.
1) salmav3(src, length, smooth, mult, sd_len)
Parameters:
src (float)
length (int)
smooth (simple int)
mult(float)
sd_len(int)
2) boltzman(src, length, T, alpha, smoothLen)
Parameters:
src (float)
length (int)
T(float)
Alpha(float)
smoothLen (simple int)
3) shannon(src, vol, len, bc, vc, smooth)
Parameters:
src (float)
vol (float)
len (int)
bc (bool)
vc (bool)
smooth (simple int)
4) vama(src, baseLen, volLen, beta)
Parameters:
src (float)
baseLen (int)
volLen (int)
beta (float)
5) fwma(src, period, lambda, smooth)
Parameters:
src (float)
period (int)
lambda (float)
smooth (simple int)
6) savitzky(srcc, srch, srcl, length)
Parameters:
srcc (float)
srch (float)
srcl (float)
length (int)
7) butterworth(src, length, poles, smooth)
Parameters:
src (float)
length (int)
poles (int)
smooth (simple int)
8) rti(src, trend_data_count, trend_sensitivity_percentage, midline, smooth)
Parameters:
src (float)
trend_data_count (int)
trend_sensitivity_percentage (int)
midline (int)
smooth (simple int)
9) chandemo(src, length, smooth)
Parameters:
src (float)
length (int)
smooth (simple int)
10) hsma(assetClose, length, emalen, midline)
Parameters:
assetClose (float)
length (int)
emalen (simple int)
midline (float)
11) rsi(src, rsiLengthInput, rsiemalen, midline)
Parameters:
src (float)
rsiLengthInput (simple int)
rsiemalen (simple int)
midline (float)
12) lacoca(src, lookback, malen, matype)
Parameters:
src (float)
lookback (int)
malen (simple int)
matype (string)

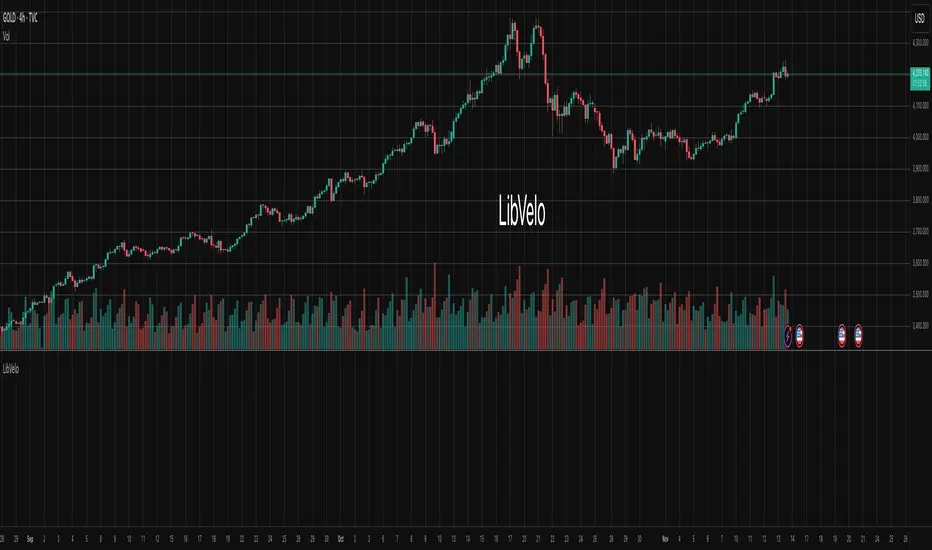
LibVeloLibrary "LibVelo"
This library provides a sophisticated framework for **Velocity
Profile (Flow Rate)** analysis. It measures the physical
speed of trading at specific price levels by relating volume
to the time spent at those levels.
## Core Concept: Market Velocity
Unlike Volume Profiles, which only answer "how much" traded,
Velocity Profiles answer "how fast" it traded.
It is calculated as:
`Velocity = Volume / Duration`
This metric (contracts per second) reveals hidden market
dynamics invisible to pure Volume or TPO profiles:
1. **High Velocity (Fast Flow):**
* **Aggression:** Initiative buyers/sellers hitting market
orders rapidly.
* **Liquidity Vacuum:** Price slips through a level because
order book depth is thin (low resistance).
2. **Low Velocity (Slow Flow):**
* **Absorption:** High volume but very slow price movement.
Indicates massive passive limit orders ("Icebergs").
* **Apathy:** Little volume over a long time. Lack of
interest from major participants.
## Architecture: Triple-Engine Composition
To ensure maximum performance while offering full statistical
depth for all metrics, this library utilises **object
composition** with a lazy evaluation strategy:
#### Engine A: The Master (`vpVol`)
* **Role:** Standard Volume Profile.
* **Purpose:** Maintains the "ground truth" of volume distribution,
price buckets, and ranges.
#### Engine B: The Time Container (`vpTime`)
* **Role:** specialized container for time duration (in ms).
* **Hack:** It repurposes standard volume arrays (specifically
`aBuy`) to accumulate time duration for each bucket.
#### Engine C: The Calculator (`vpVelo`)
* **Role:** Temporary scratchpad for derived metrics.
* **Purpose:** When complex statistics (like Value Area or Skewness)
are requested for **Velocity**, this engine is assembled
on-demand to leverage the full statistical power of `LibVPrf`
without rewriting complex algorithms.
---
**DISCLAIMER**
This library is provided "AS IS" and for informational and
educational purposes only. It does not constitute financial,
investment, or trading advice.
The author assumes no liability for any errors, inaccuracies,
or omissions in the code. Using this library to build
trading indicators or strategies is entirely at your own risk.
As a developer using this library, you are solely responsible
for the rigorous testing, validation, and performance of any
scripts you create based on these functions. The author shall
not be held liable for any financial losses incurred directly
or indirectly from the use of this library or any scripts
derived from it.
create(buckets, rangeUp, rangeLo, dynamic, valueArea, allot, estimator, cdfSteps, split, trendLen)
Construct a new `Velo` controller, initializing its engines.
Parameters:
buckets (int) : series int Number of price buckets ≥ 1.
rangeUp (float) : series float Upper price bound (absolute).
rangeLo (float) : series float Lower price bound (absolute).
dynamic (bool) : series bool Flag for dynamic adaption of profile ranges.
valueArea (int) : series int Percentage for Value Area (1..100).
allot (series AllotMode) : series AllotMode Allocation mode `Classic` or `PDF` (default `PDF`).
estimator (series PriceEst enum from AustrianTradingMachine/LibBrSt/1) : series PriceEst PDF model for distribution attribution (default `Uniform`).
cdfSteps (int) : series int Resolution for PDF integration (default 20).
split (series SplitMode) : series SplitMode Buy/Sell split for the master volume engine (default `Classic`).
trendLen (int) : series int Look‑back for trend factor in dynamic split (default 3).
Returns: Velo Freshly initialised velocity profile.
method clone(self)
Create a deep copy of the composite profile.
Namespace types: Velo
Parameters:
self (Velo) : Velo Profile object to copy.
Returns: Velo A completely independent clone.
method clear(self)
Reset all engines and accumulators.
Namespace types: Velo
Parameters:
self (Velo) : Velo Profile object to clear.
Returns: Velo Cleared profile (chaining).
method merge(self, srcVolBuy, srcVolSell, srcTime, srcRangeUp, srcRangeLo, srcVolCvd, srcVolCvdHi, srcVolCvdLo)
Merges external data (Volume and Time) into the current profile.
Automatically handles resizing and re-bucketing if ranges differ.
Namespace types: Velo
Parameters:
self (Velo) : Velo The profile object.
srcVolBuy (array) : array Source Buy Volume bucket array.
srcVolSell (array) : array Source Sell Volume bucket array.
srcTime (array) : array Source Time bucket array (ms).
srcRangeUp (float) : series float Upper price bound of the source data.
srcRangeLo (float) : series float Lower price bound of the source data.
srcVolCvd (float) : series float Source Volume CVD final value.
srcVolCvdHi (float) : series float Source Volume CVD High watermark.
srcVolCvdLo (float) : series float Source Volume CVD Low watermark.
Returns: Velo `self` (chaining).
method addBar(self, offset)
Main data ingestion. Distributes Volume and Time to buckets.
Namespace types: Velo
Parameters:
self (Velo) : Velo The profile object.
offset (int) : series int Offset of the bar to add (default 0).
Returns: Velo `self` (chaining).
method setBuckets(self, buckets)
Sets the number of buckets for the profile.
Namespace types: Velo
Parameters:
self (Velo) : Velo The profile object.
buckets (int) : series int New number of buckets.
Returns: Velo `self` (chaining).
method setRanges(self, rangeUp, rangeLo)
Sets the price range for the profile.
Namespace types: Velo
Parameters:
self (Velo) : Velo The profile object.
rangeUp (float) : series float New upper price bound.
rangeLo (float) : series float New lower price bound.
Returns: Velo `self` (chaining).
method setValueArea(self, va)
Set the percentage of volume/time for the Value Area.
Namespace types: Velo
Parameters:
self (Velo) : Velo The profile object.
va (int) : series int New Value Area percentage (0..100).
Returns: Velo `self` (chaining).
method getBuckets(self)
Returns the current number of buckets in the profile.
Namespace types: Velo
Parameters:
self (Velo) : Velo The profile object.
Returns: series int The number of buckets.
method getRanges(self)
Returns the current price range of the profile.
Namespace types: Velo
Parameters:
self (Velo) : Velo The profile object.
Returns:
rangeUp series float The upper price bound of the profile.
rangeLo series float The lower price bound of the profile.
method getArrayBuyVol(self)
Returns the internal raw data array for **Buy Volume** directly.
Namespace types: Velo
Parameters:
self (Velo) : Velo The profile object.
Returns: array The internal array for buy volume.
method getArraySellVol(self)
Returns the internal raw data array for **Sell Volume** directly.
Namespace types: Velo
Parameters:
self (Velo) : Velo The profile object.
Returns: array The internal array for sell volume.
method getArrayTime(self)
Returns the internal raw data array for **Time** (in ms) directly.
Namespace types: Velo
Parameters:
self (Velo) : Velo The profile object.
Returns: array The internal array for time duration.
method getArrayBuyVelo(self)
Returns the internal raw data array for **Buy Velocity** directly.
Automatically executes _assemble() if data is dirty.
Namespace types: Velo
Parameters:
self (Velo) : Velo The profile object.
Returns: array The internal array for buy velocity.
method getArraySellVelo(self)
Returns the internal raw data array for **Sell Velocity** directly.
Automatically executes _assemble() if data is dirty.
Namespace types: Velo
Parameters:
self (Velo) : Velo The profile object.
Returns: array The internal array for sell velocity.
method getBucketBuyVol(self, idx)
Returns the **Buy Volume** of a specific bucket.
Namespace types: Velo
Parameters:
self (Velo) : Velo The profile object.
idx (int) : series int The index of the bucket.
Returns: series float The buy volume.
method getBucketSellVol(self, idx)
Returns the **Sell Volume** of a specific bucket.
Namespace types: Velo
Parameters:
self (Velo) : Velo The profile object.
idx (int) : series int The index of the bucket.
Returns: series float The sell volume.
method getBucketTime(self, idx)
Returns the raw accumulated time (in ms) spent in a specific bucket.
Namespace types: Velo
Parameters:
self (Velo) : Velo The profile object.
idx (int) : series int The index of the bucket.
Returns: series float The time in milliseconds.
method getBucketBuyVelo(self, idx)
Returns the **Buy Velocity** (Aggressive Buy Flow) of a bucket.
Namespace types: Velo
Parameters:
self (Velo) : Velo The profile object.
idx (int) : series int The index of the bucket.
Returns: series float The buy velocity in .
method getBucketSellVelo(self, idx)
Returns the **Sell Velocity** (Aggressive Sell Flow) of a bucket.
Namespace types: Velo
Parameters:
self (Velo) : Velo The profile object.
idx (int) : series int The index of the bucket.
Returns: series float The sell velocity in .
method getBktBnds(self, idx)
Returns the price boundaries of a specific bucket.
Namespace types: Velo
Parameters:
self (Velo) : Velo The profile object.
idx (int) : series int The index of the bucket.
Returns:
up series float The upper price bound of the bucket.
lo series float The lower price bound of the bucket.
method getPoc(self, target)
Returns Point of Control (POC) information for the specified target metric.
Calculates on-demand if the target is 'Velocity' and data changed.
Namespace types: Velo
Parameters:
self (Velo) : Velo The profile object.
target (series Metric) : Metric The data aspect to analyse (Volume, Time, Velocity).
Returns:
pocIdx series int The index of the POC bucket.
pocPrice series float The mid-price of the POC bucket.
method getVA(self, target)
Returns Value Area (VA) information for the specified target metric.
Calculates on-demand if the target is 'Velocity' and data changed.
Namespace types: Velo
Parameters:
self (Velo) : Velo The profile object.
target (series Metric) : Metric The data aspect to analyse (Volume, Time, Velocity).
Returns:
vaUpIdx series int The index of the upper VA bucket.
vaUpPrice series float The upper price bound of the VA.
vaLoIdx series int The index of the lower VA bucket.
vaLoPrice series float The lower price bound of the VA.
method getMedian(self, target)
Returns the Median price for the specified target metric distribution.
Calculates on-demand if the target is 'Velocity' and data changed.
Namespace types: Velo
Parameters:
self (Velo) : Velo The profile object.
target (series Metric) : Metric The data aspect to analyse (Volume, Time, Velocity).
Returns:
medianIdx series int The index of the bucket containing the median.
medianPrice series float The median price.
method getAverage(self, target)
Returns the weighted average price (VWAP/TWAP) for the specified target.
Calculates on-demand if the target is 'Velocity' and data changed.
Namespace types: Velo
Parameters:
self (Velo) : Velo The profile object.
target (series Metric) : Metric The data aspect to analyse (Volume, Time, Velocity).
Returns:
avgIdx series int The index of the bucket containing the average.
avgPrice series float The weighted average price.
method getStdDev(self, target)
Returns the standard deviation for the specified target distribution.
Calculates on-demand if the target is 'Velocity' and data changed.
Namespace types: Velo
Parameters:
self (Velo) : Velo The profile object.
target (series Metric) : Metric The data aspect to analyse (Volume, Time, Velocity).
Returns: series float The standard deviation.
method getSkewness(self, target)
Returns the skewness for the specified target distribution.
Calculates on-demand if the target is 'Velocity' and data changed.
Namespace types: Velo
Parameters:
self (Velo) : Velo The profile object.
target (series Metric) : Metric The data aspect to analyse (Volume, Time, Velocity).
Returns: series float The skewness.
method getKurtosis(self, target)
Returns the excess kurtosis for the specified target distribution.
Calculates on-demand if the target is 'Velocity' and data changed.
Namespace types: Velo
Parameters:
self (Velo) : Velo The profile object.
target (series Metric) : Metric The data aspect to analyse (Volume, Time, Velocity).
Returns: series float The excess kurtosis.
method getSegments(self, target)
Returns the fundamental unimodal segments for the specified target metric.
Calculates on-demand if the target is 'Velocity' and data changed.
Namespace types: Velo
Parameters:
self (Velo) : Velo The profile object.
target (series Metric) : Metric The data aspect to analyse (Volume, Time, Velocity).
Returns: matrix A 2-column matrix where each row is an pair.
method getCvd(self, target)
Returns Cumulative Volume/Velo Delta (CVD) information for the target metric.
Namespace types: Velo
Parameters:
self (Velo) : Velo The profile object.
target (series Metric) : Metric The data aspect to analyse (Volume, Time, Velocity).
Returns:
cvd series float The final delta value.
cvdHi series float The historical high-water mark of the delta.
cvdLo series float The historical low-water mark of the delta.
Velo
Velo Composite Velocity Profile Controller.
Fields:
_vpVol (VPrf type from AustrianTradingMachine/LibVPrf/2) : LibVPrf.VPrf Engine A: Master Volume source.
_vpTime (VPrf type from AustrianTradingMachine/LibVPrf/2) : LibVPrf.VPrf Engine B: Time duration container (ms).
_vpVelo (VPrf type from AustrianTradingMachine/LibVPrf/2) : LibVPrf.VPrf Engine C: Scratchpad for velocity stats.
_aTime (array) : array Pointer alias to `vpTime.aBuy` (Time storage).
_valueArea (series float) : int Percentage of total volume to include in the Value Area (1..100)
_estimator (series PriceEst enum from AustrianTradingMachine/LibBrSt/1) : LibBrSt.PriceEst PDF model for distribution attribution.
_allot (series AllotMode) : AllotMode Attribution model (Classic or PDF).
_cdfSteps (series int) : int Integration resolution for PDF.
_isDirty (series bool) : bool Lazy evaluation flag for vpVelo.
TraderMathLibrary "TraderMath"
A collection of essential trading utilities and mathematical functions used for technical analysis,
including DEMA, Fisher Transform, directional movement, and ADX calculations.
dema(source, length)
Calculates the value of the Double Exponential Moving Average (DEMA).
Parameters:
source (float) : (series int/float) Series of values to process.
length (simple int) : (simple int) Length for the smoothing parameter calculation.
Returns: (float) The double exponentially weighted moving average of the `source`.
roundVal(val)
Constrains a value to the range .
Parameters:
val (float) : (float) Value to constrain.
Returns: (float) Value limited to the range .
fisherTransform(length)
Computes the Fisher Transform oscillator, enhancing turning point sensitivity.
Parameters:
length (int) : (int) Lookback length used to normalize price within the high-low range.
Returns: (float) Fisher Transform value.
dirmov(len)
Calculates the Plus and Minus Directional Movement components (DI+ and DI−).
Parameters:
len (simple int) : (int) Lookback length for directional movement.
Returns: (float ) Array containing .
adx(dilen, adxlen)
Computes the Average Directional Index (ADX) based on DI+ and DI−.
Parameters:
dilen (simple int) : (int) Lookback length for directional movement calculation.
adxlen (simple int) : (int) Smoothing length for ADX computation.
Returns: (float) Average Directional Index value (0–100).

LibVPrfLibrary "LibVPrf"
This library provides an object-oriented framework for volume
profile analysis in Pine Script®. It is built around the `VProf`
User-Defined Type (UDT), which encapsulates all data, settings,
and statistical metrics for a single profile, enabling stateful
analysis with on-demand calculations.
Key Features:
1. **Object-Oriented Design (UDT):** The library is built around
the `VProf` UDT. This object encapsulates all profile data
and provides methods for its full lifecycle management,
including creation, cloning, clearing, and merging of profiles.
2. **Volume Allocation (`AllotMode`):** Offers two methods for
allocating a bar's volume:
- **Classic:** Assigns the entire bar's volume to the close
price bucket.
- **PDF:** Distributes volume across the bar's range using a
statistical price distribution model from the `LibBrSt` library.
3. **Buy/Sell Volume Splitting (`SplitMode`):** Provides methods
for classifying volume into buying and selling pressure:
- **Classic:** Classifies volume based on the bar's color (Close vs. Open).
- **Dynamic:** A specific model that analyzes candle structure
(body vs. wicks) and a short-term trend factor to
estimate the buy/sell share at each price level.
4. **Statistical Analysis (On-Demand):** Offers a suite of
statistical metrics calculated using a "Lazy Evaluation"
pattern (computed only when requested via `get...` methods):
- **Central Tendency:** Point of Control (POC), VWAP, and Median.
- **Dispersion:** Value Area (VA) and Population Standard Deviation.
- **Shape:** Skewness and Excess Kurtosis.
- **Delta:** Cumulative Volume Delta, including its
historical high/low watermarks.
5. **Structural Analysis:** Includes a parameter-free method
(`getSegments`) to decompose a profile into its fundamental
unimodal segments, allowing for modality detection (e.g.,
identifying bimodal profiles).
6. **Dynamic Profile Management:**
- **Auto-Fitting:** Profiles set to `dynamic = true` will
automatically expand their price range to fit new data.
- **Manipulation:** The resolution, price range, and Value Area
of a dynamic profile can be changed at any time. This
triggers a resampling process that uses a **linear
interpolation model** to re-bucket existing volume.
- **Assumption:** Non-dynamic profiles are fixed and will throw
a `runtime.error` if `addBar` is called with data
outside their initial range.
7. **Bucket-Level Access:** Provides getter methods for direct
iteration and analysis of the raw buy/sell volume and price
boundaries of each individual price bucket.
---
**DISCLAIMER**
This library is provided "AS IS" and for informational and
educational purposes only. It does not constitute financial,
investment, or trading advice.
The author assumes no liability for any errors, inaccuracies,
or omissions in the code. Using this library to build
trading indicators or strategies is entirely at your own risk.
As a developer using this library, you are solely responsible
for the rigorous testing, validation, and performance of any
scripts you create based on these functions. The author shall
not be held liable for any financial losses incurred directly
or indirectly from the use of this library or any scripts
derived from it.
create(buckets, rangeUp, rangeLo, dynamic, valueArea, allot, estimator, cdfSteps, split, trendLen)
Construct a new `VProf` object with fixed bucket count & range.
Parameters:
buckets (int) : series int number of price buckets ≥ 1
rangeUp (float) : series float upper price bound (absolute)
rangeLo (float) : series float lower price bound (absolute)
dynamic (bool) : series bool Flag for dynamic adaption of profile ranges
valueArea (int) : series int Percentage of total volume to include in the Value Area (1..100)
allot (series AllotMode) : series AllotMode Allocation mode `classic` or `pdf` (default `classic`)
estimator (series PriceEst enum from AustrianTradingMachine/LibBrSt/1) : series LibBrSt.PriceEst PDF model when `model == PDF`. (deflault = 'uniform')
cdfSteps (int) : series int even #sub-intervals for Simpson rule (default 20)
split (series SplitMode) : series SplitMode Buy/Sell determination (default `classic`)
trendLen (int) : series int Look‑back bars for trend factor (default 3)
Returns: VProf freshly initialised profile
method clone(self)
Create a deep copy of the volume profile.
Namespace types: VProf
Parameters:
self (VProf) : VProf Profile object to copy
Returns: VProf A new, independent copy of the profile
method clear(self)
Reset all bucket tallies while keeping configuration intact.
Namespace types: VProf
Parameters:
self (VProf) : VProf profile object
Returns: VProf cleared profile (chaining)
method merge(self, srcABuy, srcASell, srcRangeUp, srcRangeLo, srcCvd, srcCvdHi, srcCvdLo)
Merges volume data from a source profile into the current profile.
If resizing is needed, it performs a high-fidelity re-bucketing of existing
volume using a linear interpolation model inferred from neighboring buckets,
preventing aliasing artifacts and ensuring accurate volume preservation.
Namespace types: VProf
Parameters:
self (VProf) : VProf The target profile object to merge into.
srcABuy (array) : array The source profile's buy volume bucket array.
srcASell (array) : array The source profile's sell volume bucket array.
srcRangeUp (float) : series float The upper price bound of the source profile.
srcRangeLo (float) : series float The lower price bound of the source profile.
srcCvd (float) : series float The final Cumulative Volume Delta (CVD) value of the source profile.
srcCvdHi (float) : series float The historical high-water mark of the CVD from the source profile.
srcCvdLo (float) : series float The historical low-water mark of the CVD from the source profile.
Returns: VProf `self` (chaining), now containing the merged data.
method addBar(self, offset)
Add current bar’s volume to the profile (call once per realtime bar).
classic mode: allocates all volume to the close bucket and classifies
by `close >= open`. PDF mode: distributes volume across buckets by the
estimator’s CDF mass. For `split = dynamic`, the buy/sell share per
price is computed via context-driven piecewise s(u).
Namespace types: VProf
Parameters:
self (VProf) : VProf Profile object
offset (int) : series int To offset the calculated bar
Returns: VProf `self` (method chaining)
method setBuckets(self, buckets)
Sets the number of buckets for the volume profile.
Behavior depends on the `isDynamic` flag.
- If `dynamic = true`: Works on filled profiles by re-bucketing to a new resolution.
- If `dynamic = false`: Only works on empty profiles to prevent accidental changes.
Namespace types: VProf
Parameters:
self (VProf) : VProf Profile object
buckets (int) : series int The new number of buckets
Returns: VProf `self` (chaining)
method setRanges(self, rangeUp, rangeLo)
Sets the price range for the volume profile.
Behavior depends on the `dynamic` flag.
- If `dynamic = true`: Works on filled profiles by re-bucketing existing volume.
- If `dynamic = false`: Only works on empty profiles to prevent accidental changes.
Namespace types: VProf
Parameters:
self (VProf) : VProf Profile object
rangeUp (float) : series float The new upper price bound
rangeLo (float) : series float The new lower price bound
Returns: VProf `self` (chaining)
method setValueArea(self, valueArea)
Set the percentage of volume for the Value Area. If the value
changes, the profile is finalized again.
Namespace types: VProf
Parameters:
self (VProf) : VProf Profile object
valueArea (int) : series int The new Value Area percentage (0..100)
Returns: VProf `self` (chaining)
method getBktBuyVol(self, idx)
Get Buy volume of a bucket.
Namespace types: VProf
Parameters:
self (VProf) : VProf Profile object
idx (int) : series int Bucket index
Returns: series float Buy volume ≥ 0
method getBktSellVol(self, idx)
Get Sell volume of a bucket.
Namespace types: VProf
Parameters:
self (VProf) : VProf Profile object
idx (int) : series int Bucket index
Returns: series float Sell volume ≥ 0
method getBktBnds(self, idx)
Get Bounds of a bucket.
Namespace types: VProf
Parameters:
self (VProf) : VProf Profile object
idx (int) : series int Bucket index
Returns:
up series float The upper price bound of the bucket.
lo series float The lower price bound of the bucket.
method getPoc(self)
Get POC information.
Namespace types: VProf
Parameters:
self (VProf) : VProf Profile object
Returns:
pocIndex series int The index of the Point of Control (POC) bucket.
pocPrice. series float The mid-price of the Point of Control (POC) bucket.
method getVA(self)
Get Value Area (VA) information.
Namespace types: VProf
Parameters:
self (VProf) : VProf Profile object
Returns:
vaUpIndex series int The index of the upper bound bucket of the Value Area.
vaUpPrice series float The upper price bound of the Value Area.
vaLoIndex series int The index of the lower bound bucket of the Value Area.
vaLoPrice series float The lower price bound of the Value Area.
method getMedian(self)
Get the profile's median price and its bucket index. Calculates the value on-demand if stale.
Namespace types: VProf
Parameters:
self (VProf) : VProf Profile object.
Returns:
medianIndex series int The index of the bucket containing the Median.
medianPrice series float The Median price of the profile.
method getVwap(self)
Get the profile's VWAP and its bucket index. Calculates the value on-demand if stale.
Namespace types: VProf
Parameters:
self (VProf) : VProf Profile object.
Returns:
vwapIndex series int The index of the bucket containing the VWAP.
vwapPrice series float The Volume Weighted Average Price of the profile.
method getStdDev(self)
Get the profile's volume-weighted standard deviation. Calculates the value on-demand if stale.
Namespace types: VProf
Parameters:
self (VProf) : VProf Profile object.
Returns: series float The Standard deviation of the profile.
method getSkewness(self)
Get the profile's skewness. Calculates the value on-demand if stale.
Namespace types: VProf
Parameters:
self (VProf) : VProf Profile object.
Returns: series float The Skewness of the profile.
method getKurtosis(self)
Get the profile's excess kurtosis. Calculates the value on-demand if stale.
Namespace types: VProf
Parameters:
self (VProf) : VProf Profile object.
Returns: series float The Kurtosis of the profile.
method getSegments(self)
Get the profile's fundamental unimodal segments. Calculates on-demand if stale.
Uses a parameter-free, pivot-based recursive algorithm.
Namespace types: VProf
Parameters:
self (VProf) : VProf The profile object.
Returns: matrix A 2-column matrix where each row is an pair.
method getCvd(self)
Cumulative Volume Delta (CVD) like metric over all buckets.
Namespace types: VProf
Parameters:
self (VProf) : VProf Profile object.
Returns:
cvd series float The final Cumulative Volume Delta (Total Buy Vol - Total Sell Vol).
cvdHi series float The running high-water mark of the CVD as volume was added.
cvdLo series float The running low-water mark of the CVD as volume was added.
VProf
VProf Bucketed Buy/Sell volume profile plus meta information.
Fields:
buckets (series int) : int Number of price buckets (granularity ≥1)
rangeUp (series float) : float Upper price range (absolute)
rangeLo (series float) : float Lower price range (absolute)
dynamic (series bool) : bool Flag for dynamic adaption of profile ranges
valueArea (series int) : int Percentage of total volume to include in the Value Area (1..100)
allot (series AllotMode) : AllotMode Allocation mode `classic` or `pdf`
estimator (series PriceEst enum from AustrianTradingMachine/LibBrSt/1) : LibBrSt.PriceEst Price density model when `model == PDF`
cdfSteps (series int) : int Simpson integration resolution (even ≥2)
split (series SplitMode) : SplitMode Buy/Sell split strategy per bar
trendLen (series int) : int Look‑back length for trend factor (≥1)
maxBkt (series int) : int User-defined number of buckets (unclamped)
aBuy (array) : array Buy volume per bucket
aSell (array) : array Sell volume per bucket
cvd (series float) : float Final Cumulative Volume Delta (Total Buy Vol - Total Sell Vol).
cvdHi (series float) : float Running high-water mark of the CVD as volume was added.
cvdLo (series float) : float Running low-water mark of the CVD as volume was added.
poc (series int) : int Index of max‑volume bucket (POC). Is `na` until calculated.
vaUp (series int) : int Index of upper Value‑Area bound. Is `na` until calculated.
vaLo (series int) : int Index of lower value‑Area bound. Is `na` until calculated.
median (series float) : float Median price of the volume distribution. Is `na` until calculated.
vwap (series float) : float Profile VWAP (Volume Weighted Average Price). Is `na` until calculated.
stdDev (series float) : float Standard Deviation of volume around the VWAP. Is `na` until calculated.
skewness (series float) : float Skewness of the volume distribution. Is `na` until calculated.
kurtosis (series float) : float Excess Kurtosis of the volume distribution. Is `na` until calculated.
segments (matrix) : matrix A 2-column matrix where each row is an pair. Is `na` until calculated.

LibPvotLibrary "LibPvot"
This is a library for advanced technical analysis, specializing
in two core areas: the detection of price-oscillator
divergences and the analysis of market structure. It provides
a back-end engine for signal detection and a toolkit for
indicator plotting.
Key Features:
1. **Complete Divergence Suite (Class A, B, C):** The engine detects
all three major types of divergences, providing a full spectrum of
analytical signals:
- **Regular (A):** For potential trend reversals.
- **Hidden (B):** For potential trend continuations.
- **Exaggerated (C):** For identifying weakness at double tops/bottoms.
2. **Advanced Signal Filtering:** The detection logic uses a
percentage-based price tolerance (`prcTol`). This feature
enables the practical detection of Exaggerated divergences
(which rarely occur at the exact same price) and creates a
"dead zone" to filter insignificant noise from triggering
Regular divergences.
3. **Pivot Synchronization:** A bar tolerance (`barTol`) is used
to reliably match price and oscillator pivots that do not
align perfectly on the same bar, preventing missed signals.
4. **Signal Invalidation Logic:** Features two built-in invalidation
rules:
- An optional `invalidate` parameter automatically terminates
active divergences if the price or the oscillator breaks
the level of the confirming pivot.
- The engine also discards 'half-pivots' (e.g., a price pivot)
if a corresponding oscillator pivot does not appear within
the `barTol` window.
5. **Stateful Plotting Helpers:** Provides helper functions
(`bullDivPos` and `bearDivPos`) that abstract away the
state management issues of visualizing persistent signals.
They generate gap-free, accurately anchored data series
ready to be used in `plotshape` functions, simplifying
indicator-side code.
6. **Rich Data Output:** The core detection functions (`bullDiv`, `bearDiv`)
return a comprehensive 9-field data tuple. This includes the
boolean flags for each divergence type and the precise
coordinates (price, oscillator value, bar index) of both the
starting and the confirming pivots.
7. **Market Structure & Trend Analysis:** Includes a
`marketStructure` function to automatically identify pivot
highs/lows, classify their relationship (HH, LH, LL, HL),
detect structure breaks, and determine the current trend
state (Up, Down, Neutral) based on pivot sequences.
---
**DISCLAIMER**
This library is provided "AS IS" and for informational and
educational purposes only. It does not constitute financial,
investment, or trading advice.
The author assumes no liability for any errors, inaccuracies,
or omissions in the code. Using this library to build
trading indicators or strategies is entirely at your own risk.
As a developer using this library, you are solely responsible
for the rigorous testing, validation, and performance of any
scripts you create based on these functions. The author shall
not be held liable for any financial losses incurred directly
or indirectly from the use of this library or any scripts
derived from it.
bullDiv(priceSrc, oscSrc, leftLen, rightLen, depth, barTol, prcTol, persist, invalidate)
Detects bullish divergences (Regular, Hidden, Exaggerated) based on pivot lows.
Parameters:
priceSrc (float) : series float Price series to check for pivots (e.g., `low`).
oscSrc (float) : series float Oscillator series to check for pivots.
leftLen (int) : series int Number of bars to the left of a pivot (default 5).
rightLen (int) : series int Number of bars to the right of a pivot (default 5).
depth (int) : series int Maximum number of stored pivot pairs to check against (default 2).
barTol (int) : series int Maximum bar distance allowed between the price pivot and the oscillator pivot (default 3).
prcTol (float) : series float The percentage tolerance for comparing pivot prices. Used to detect Exaggerated
divergences and filter out market noise (default 0.05%).
persist (bool) : series bool If `true` (default), the divergence flag stays active for the entire duration of the signal.
If `false`, it returns a single-bar pulse on detection.
invalidate (bool) : series bool If `true` (default), terminates an active divergence if price or oscillator break
below the confirming pivot low.
Returns: A tuple containing comprehensive data for a detected bullish divergence.
regBull series bool `true` if a Regular bullish divergence (Class A) is active.
hidBull series bool `true` if a Hidden bullish divergence (Class B) is active.
exgBull series bool `true` if an Exaggerated bullish divergence (Class C) is active.
initPivotPrc series float Price value of the initial (older) pivot low.
initPivotOsz series float Oscillator value of the initial pivot low.
initPivotBar series int Bar index of the initial pivot low.
lastPivotPrc series float Price value of the last (confirming) pivot low.
lastPivotOsz series float Oscillator value of the last pivot low.
lastPivotBar series int Bar index of the last pivot low.
bearDiv(priceSrc, oscSrc, leftLen, rightLen, depth, barTol, prcTol, persist, invalidate)
Detects bearish divergences (Regular, Hidden, Exaggerated) based on pivot highs.
Parameters:
priceSrc (float) : series float Price series to check for pivots (e.g., `high`).
oscSrc (float) : series float Oscillator series to check for pivots.
leftLen (int) : series int Number of bars to the left of a pivot (default 5).
rightLen (int) : series int Number of bars to the right of a pivot (default 5).
depth (int) : series int Maximum number of stored pivot pairs to check against (default 2).
barTol (int) : series int Maximum bar distance allowed between the price pivot and the oscillator pivot (default 3).
prcTol (float) : series float The percentage tolerance for comparing pivot prices. Used to detect Exaggerated
divergences and filter out market noise (default 0.05%).
persist (bool) : series bool If `true` (default), the divergence flag stays active for the entire duration of the signal.
If `false`, it returns a single-bar pulse on detection.
invalidate (bool) : series bool If `true` (default), terminates an active divergence if price or oscillator break
above the confirming pivot high.
Returns: A tuple containing comprehensive data for a detected bearish divergence.
regBear series bool `true` if a Regular bearish divergence (Class A) is active.
hidBear series bool `true` if a Hidden bearish divergence (Class B) is active.
exgBear series bool `true` if an Exaggerated bearish divergence (Class C) is active.
initPivotPrc series float Price value of the initial (older) pivot high.
initPivotOsz series float Oscillator value of the initial pivot high.
initPivotBar series int Bar index of the initial pivot high.
lastPivotPrc series float Price value of the last (confirming) pivot high.
lastPivotOsz series float Oscillator value of the last pivot high.
lastPivotBar series int Bar index of the last pivot high.
bullDivPos(regBull, hidBull, exgBull, rightLen, yPos)
Calculates the plottable data series for bullish divergences. It manages
the complex state of a persistent signal's plotting window to ensure
gap-free and accurately anchored visualization.
Parameters:
regBull (bool) : series bool The regular bullish divergence flag from `bullDiv`.
hidBull (bool) : series bool The hidden bullish divergence flag from `bullDiv`.
exgBull (bool) : series bool The exaggerated bullish divergence flag from `bullDiv`.
rightLen (int) : series int The same `rightLen` value used in `bullDiv` for correct timing.
yPos (float) : series float The series providing the base Y-coordinate for the shapes (e.g., `low`).
Returns: A tuple of three `series float` for plotting bullish divergences.
regBullPosY series float Contains the static anchor Y-value for Regular divergences where a shape should be plotted; `na` otherwise.
hidBullPosY series float Contains the static anchor Y-value for Hidden divergences where a shape should be plotted; `na` otherwise.
exgBullPosY series float Contains the static anchor Y-value for Exaggerated divergences where a shape should be plotted; `na` otherwise.
bearDivPos(regBear, hidBear, exgBear, rightLen, yPos)
Calculates the plottable data series for bearish divergences. It manages
the complex state of a persistent signal's plotting window to ensure
gap-free and accurately anchored visualization.
Parameters:
regBear (bool) : series bool The regular bearish divergence flag from `bearDiv`.
hidBear (bool) : series bool The hidden bearish divergence flag from `bearDiv`.
exgBear (bool) : series bool The exaggerated bearish divergence flag from `bearDiv`.
rightLen (int) : series int The same `rightLen` value used in `bearDiv` for correct timing.
yPos (float) : series float The series providing the base Y-coordinate for the shapes (e.g., `high`).
Returns: A tuple of three `series float` for plotting bearish divergences.
regBearPosY series float Contains the static anchor Y-value for Regular divergences where a shape should be plotted; `na` otherwise.
hidBearPosY series float Contains the static anchor Y-value for Hidden divergences where a shape should be plotted; `na` otherwise.
exgBearPosY series float Contains the static anchor Y-value for Exaggerated divergences where a shape should be plotted; `na` otherwise.
marketStructure(highSrc, lowSrc, leftLen, rightLen, srcTol)
Analyzes the market structure by identifying pivot points, classifying
their sequence (e.g., Higher Highs, Lower Lows), and determining the
prevailing trend state.
Parameters:
highSrc (float) : series float Price series for pivot high detection (e.g., `high`).
lowSrc (float) : series float Price series for pivot low detection (e.g., `low`).
leftLen (int) : series int Number of bars to the left of a pivot (default 5).
rightLen (int) : series int Number of bars to the right of a pivot (default 5).
srcTol (float) : series float Percentage tolerance to consider two pivots as 'equal' (default 0.05%).
Returns: A tuple containing detailed market structure information.
pivType series PivType The type of the most recently formed pivot (e.g., `hh`, `ll`).
lastPivHi series float The price level of the last confirmed pivot high.
lastPivLo series float The price level of the last confirmed pivot low.
lastPiv series float The price level of the last confirmed pivot (either high or low).
pivHiBroken series bool `true` if the price has broken above the last pivot high.
pivLoBroken series bool `true` if the price has broken below the last pivot low.
trendState series TrendState The current trend state (`up`, `down`, or `neutral`).

LibVolmLibrary "LibVolm"
This library provides a collection of core functions for volume and
money flow analysis. It offers implementations of several classic
volume-based indicators, with a focus on flexibility
for applications like multi-timeframe and session-based analysis.
Key Features:
1. **Suite of Classic Volume Indicators:** Includes standard
implementations of several foundational indicators:
- **On Balance Volume (`obv`):** A momentum indicator that
accumulates volume based on price direction.
- **Accumulation/Distribution Line (`adLine`):** Measures cumulative
money flow using the close's position within the bar's range.
- **Chaikin Money Flow (`cmf`):** An oscillator version of the ADL
that measures money flow over a specified lookback period.
2. **Anchored/Resettable Indicators:** The library includes flexible,
resettable indicators ideal for cyclical analysis:
- **Anchored VWAP (`vwap`):** Calculates a Volume Weighted Average
Price that can be reset on any user-defined `reset` condition.
It returns both the VWAP and the number of bars (`prdBars`) in
the current period.
- **Resettable CVD (`cvd`):** Computes a Cumulative Volume Delta
that can be reset on a custom `reset` anchor. The function
also tracks and returns the highest (`hi`) and lowest (`lo`)
delta values reached within the current period.
(Note: The delta sign is determined by a specific logic:
it first checks close vs. open, then close vs. prior
close, and persists the last non-zero sign).
3. **Volume Sanitization:** All functions that use the built-in
`volume` variable automatically sanitize it via an internal
function. This process replaces `na` values with 0 and ensures
no negative volume values are used, providing stable calculations.
---
**DISCLAIMER**
This library is provided "AS IS" and for informational and
educational purposes only. It does not constitute financial,
investment, or trading advice.
The author assumes no liability for any errors, inaccuracies,
or omissions in the code. Using this library to build
trading indicators or strategies is entirely at your own risk.
As a developer using this library, you are solely responsible
for the rigorous testing, validation, and performance of any
scripts you create based on these functions. The author shall
not be held liable for any financial losses incurred directly
or indirectly from the use of this library or any scripts
derived from it.
obv(price)
Calculates the On Balance Volume (OBV) cumulative indicator.
Parameters:
price (float) : series float Source price series, typically the close.
Returns: series float Cumulative OBV value.
adLine()
Computes the Accumulation/Distribution Line (AD Line).
Returns: series float Cumulative AD Line value.
cmf(length)
Computes Chaikin Money Flow (CMF).
Parameters:
length (int) : series int Lookback length for the CMF calculation.
Returns: series float CMF value.
vwap(price, reset)
Calculates an anchored Volume Weighted Average Price (VWAP).
Parameters:
price (float) : series float Source price series (usually *close*).
reset (bool) : series bool A signal that is *true* on the bar where the
accumulation should be reset.
Returns:
vwap series float The calculated Volume Weighted Average Price for the current period.
prdBars series int The number of bars that have passed since the last reset.
cvd(reset)
Calculates a resettable, cumulative Volume Delta (CVD).
It accumulates volume delta and tracks its high/low range. The
accumulation is reset to zero whenever the `reset` condition is true.
This is useful for session-based analysis, intra-bar calculations,
or any other custom-anchored accumulation.
Parameters:
reset (bool) : series bool A signal that is *true* on the bar where the
accumulation should be reset.
Returns:
cum series float The current cumulative volume delta.
hi series float The highest peak the cumulative delta has reached in the current period.
lo series float The lowest trough the cumulative delta has reached in the current period.

LibMvAvLibrary "LibMvAv"
This library provides a unified interface for calculating a
wide variety of moving averages. It is designed to simplify
indicator development by consolidating numerous MA calculations
into a single function and integrating the weighting
capabilities from the `LibWght` library.
Key Features:
1. **All-in-One MA Function:** The core of the library is the
`ma()` function. Users can select the desired calculation
method via the `MAType` enum, which helps create
cleaner and more maintainable code compared to using
many different `ta.*` or custom functions.
2. **Comprehensive Selection of MA Types:** It provides a
selection of 12 different moving averages, covering
common Pine Script built-ins and their weighted counterparts:
- **Standard MAs:** SMA, EMA, WMA, RMA (Wilder's), HMA (Hull), and
LSMA (Least Squares / Linear Regression).
- **Weighted MAs:** Weight-enhanced versions of the above
(WSMA, WEMA, WWMA, WRMA, WHMA, WLSMA).
3. **Integrated Weighting:** The library provides weighted versions
for each of its standard MA types (e.g., `wsma` alongside `sma`).
By acting as a dispatcher, the `ma()` function allows these
weighted calculations to be called using the optional
`weight` parameter, which are then processed by the `LibWght`
library.
4. **Simple API:** The library internally handles the logic of
choosing the correct function based on the selected `MAType`.
The user only needs to provide the source, length, and
optional weight, simplifying the development process.
---
**DISCLAIMER**
This library is provided "AS IS" and for informational and
educational purposes only. It does not constitute financial,
investment, or trading advice.
The author assumes no liability for any errors, inaccuracies,
or omissions in the code. Using this library to build
trading indicators or strategies is entirely at your own risk.
As a developer using this library, you are solely responsible
for the rigorous testing, validation, and performance of any
scripts you create based on these functions. The author shall
not be held liable for any financial losses incurred directly
or indirectly from the use of this library or any scripts
derived from it.
ma(maType, source, length, weight)
Returns the requested moving average.
Parameters:
maType (simple MAType) : simple MAType Desired type (see enum above).
source (float) : series float Data series to smooth.
length (simple int) : simple int Look-back / period length.
weight (float) : series float Weight series (default = na)
Returns: series float Moving-average value.
LibWghtLibrary "LibWght"
This is a library of mathematical and statistical functions
designed for quantitative analysis in Pine Script. Its core
principle is the integration of a custom weighting series
(e.g., volume) into a wide array of standard technical
analysis calculations.
Key Capabilities:
1. **Universal Weighting:** All exported functions accept a `weight`
parameter. This allows standard calculations (like moving
averages, RSI, and standard deviation) to be influenced by an
external data series, such as volume or tick count.
2. **Weighted Averages and Indicators:** Includes a comprehensive
collection of weighted functions:
- **Moving Averages:** `wSma`, `wEma`, `wWma`, `wRma` (Wilder's),
`wHma` (Hull), and `wLSma` (Least Squares / Linear Regression).
- **Oscillators & Ranges:** `wRsi`, `wAtr` (Average True Range),
`wTr` (True Range), and `wR` (High-Low Range).
3. **Volatility Decomposition:** Provides functions to decompose
total variance into distinct components for market analysis.
- **Two-Way Decomposition (`wTotVar`):** Separates variance into
**between-bar** (directional) and **within-bar** (noise)
components.
- **Three-Way Decomposition (`wLRTotVar`):** Decomposes variance
relative to a linear regression into **Trend** (explained by
the LR slope), **Residual** (mean-reversion around the
LR line), and **Within-Bar** (noise) components.
- **Local Volatility (`wLRLocTotStdDev`):** Measures the total
"noise" (within-bar + residual) around the trend line.
4. **Weighted Statistics and Regression:** Provides a robust
function for Weighted Linear Regression (`wLinReg`) and a
full suite of related statistical measures:
- **Between-Bar Stats:** `wBtwVar`, `wBtwStdDev`, `wBtwStdErr`.
- **Residual Stats:** `wResVar`, `wResStdDev`, `wResStdErr`.
5. **Fallback Mechanism:** All functions are designed for reliability.
If the total weight over the lookback period is zero (e.g., in
a no-volume period), the algorithms automatically fall back to
their unweighted, uniform-weight equivalents (e.g., `wSma`
becomes a standard `ta.sma`), preventing errors and ensuring
continuous calculation.
---
**DISCLAIMER**
This library is provided "AS IS" and for informational and
educational purposes only. It does not constitute financial,
investment, or trading advice.
The author assumes no liability for any errors, inaccuracies,
or omissions in the code. Using this library to build
trading indicators or strategies is entirely at your own risk.
As a developer using this library, you are solely responsible
for the rigorous testing, validation, and performance of any
scripts you create based on these functions. The author shall
not be held liable for any financial losses incurred directly
or indirectly from the use of this library or any scripts
derived from it.
wSma(source, weight, length)
Weighted Simple Moving Average (linear kernel).
Parameters:
source (float) : series float Data to average.
weight (float) : series float Weight series.
length (int) : series int Look-back length ≥ 1.
Returns: series float Linear-kernel weighted mean; falls back to
the arithmetic mean if Σweight = 0.
wEma(source, weight, length)
Weighted EMA (exponential kernel).
Parameters:
source (float) : series float Data to average.
weight (float) : series float Weight series.
length (simple int) : simple int Look-back length ≥ 1.
Returns: series float Exponential-kernel weighted mean; falls
back to classic EMA if Σweight = 0.
wWma(source, weight, length)
Weighted WMA (linear kernel).
Parameters:
source (float) : series float Data to average.
weight (float) : series float Weight series.
length (int) : series int Look-back length ≥ 1.
Returns: series float Linear-kernel weighted mean; falls back to
classic WMA if Σweight = 0.
wRma(source, weight, length)
Weighted RMA (Wilder kernel, α = 1/len).
Parameters:
source (float) : series float Data to average.
weight (float) : series float Weight series.
length (simple int) : simple int Look-back length ≥ 1.
Returns: series float Wilder-kernel weighted mean; falls back to
classic RMA if Σweight = 0.
wHma(source, weight, length)
Weighted HMA (linear kernel).
Parameters:
source (float) : series float Data to average.
weight (float) : series float Weight series.
length (int) : series int Look-back length ≥ 1.
Returns: series float Linear-kernel weighted mean; falls back to
classic HMA if Σweight = 0.
wRsi(source, weight, length)
Weighted Relative Strength Index.
Parameters:
source (float) : series float Price series.
weight (float) : series float Weight series.
length (simple int) : simple int Look-back length ≥ 1.
Returns: series float Weighted RSI; uniform if Σw = 0.
wAtr(tr, weight, length)
Weighted ATR (Average True Range).
Implemented as WRMA on *true range*.
Parameters:
tr (float) : series float True Range series.
weight (float) : series float Weight series.
length (simple int) : simple int Look-back length ≥ 1.
Returns: series float Weighted ATR; uniform weights if Σw = 0.
wTr(tr, weight, length)
Weighted True Range over a window.
Parameters:
tr (float) : series float True Range series.
weight (float) : series float Weight series.
length (int) : series int Look-back length ≥ 1.
Returns: series float Weighted mean of TR; uniform if Σw = 0.
wR(r, weight, length)
Weighted High-Low Range over a window.
Parameters:
r (float) : series float High-Low per bar.
weight (float) : series float Weight series.
length (int) : series int Look-back length ≥ 1.
Returns: series float Weighted mean of range; uniform if Σw = 0.
wBtwVar(source, weight, length, biased)
Weighted Between Variance (biased/unbiased).
Parameters:
source (float) : series float Data series.
weight (float) : series float Weight series.
length (int) : series int Look-back length ≥ 2.
biased (bool) : series bool true → population (biased); false → sample.
Returns:
variance series float The calculated between-bar variance (σ²btw), either biased or unbiased.
sumW series float The sum of weights over the lookback period (Σw).
sumW2 series float The sum of squared weights over the lookback period (Σw²).
wBtwStdDev(source, weight, length, biased)
Weighted Between Standard Deviation.
Parameters:
source (float) : series float Data series.
weight (float) : series float Weight series.
length (int) : series int Look-back length ≥ 2.
biased (bool) : series bool true → population (biased); false → sample.
Returns: series float σbtw uniform if Σw = 0.
wBtwStdErr(source, weight, length, biased)
Weighted Between Standard Error.
Parameters:
source (float) : series float Data series.
weight (float) : series float Weight series.
length (int) : series int Look-back length ≥ 2.
biased (bool) : series bool true → population (biased); false → sample.
Returns: series float √(σ²btw / N_eff) uniform if Σw = 0.
wTotVar(mu, sigma, weight, length, biased)
Weighted Total Variance (= between-group + within-group).
Useful when each bar represents an aggregate with its own
mean* and pre-estimated σ (e.g., second-level ranges inside a
1-minute bar). Assumes the *weight* series applies to both the
group means and their σ estimates.
Parameters:
mu (float) : series float Group means (e.g., HL2 of 1-second bars).
sigma (float) : series float Pre-estimated σ of each group (same basis).
weight (float) : series float Weight series (volume, ticks, …).
length (int) : series int Look-back length ≥ 2.
biased (bool) : series bool true → population (biased); false → sample.
Returns:
varBtw series float The between-bar variance component (σ²btw).
varWtn series float The within-bar variance component (σ²wtn).
sumW series float The sum of weights over the lookback period (Σw).
sumW2 series float The sum of squared weights over the lookback period (Σw²).
wTotStdDev(mu, sigma, weight, length, biased)
Weighted Total Standard Deviation.
Parameters:
mu (float) : series float Group means (e.g., HL2 of 1-second bars).
sigma (float) : series float Pre-estimated σ of each group (same basis).
weight (float) : series float Weight series (volume, ticks, …).
length (int) : series int Look-back length ≥ 2.
biased (bool) : series bool true → population (biased); false → sample.
Returns: series float σtot.
wTotStdErr(mu, sigma, weight, length, biased)
Weighted Total Standard Error.
SE = √( total variance / N_eff ) with the same effective sample
size logic as `wster()`.
Parameters:
mu (float) : series float Group means (e.g., HL2 of 1-second bars).
sigma (float) : series float Pre-estimated σ of each group (same basis).
weight (float) : series float Weight series (volume, ticks, …).
length (int) : series int Look-back length ≥ 2.
biased (bool) : series bool true → population (biased); false → sample.
Returns: series float √(σ²tot / N_eff).
wLinReg(source, weight, length)
Weighted Linear Regression.
Parameters:
source (float) : series float Data series.
weight (float) : series float Weight series.
length (int) : series int Look-back length ≥ 2.
Returns:
mid series float The estimated value of the regression line at the most recent bar.
slope series float The slope of the regression line.
intercept series float The intercept of the regression line.
wResVar(source, weight, midLine, slope, length, biased)
Weighted Residual Variance.
linear regression – optionally biased (population) or
unbiased (sample).
Parameters:
source (float) : series float Data series.
weight (float) : series float Weighting series (volume, etc.).
midLine (float) : series float Regression value at the last bar.
slope (float) : series float Slope per bar.
length (int) : series int Look-back length ≥ 2.
biased (bool) : series bool true → population variance (σ²_P), denominator ≈ N_eff.
false → sample variance (σ²_S), denominator ≈ N_eff - 2.
(Adjusts for 2 degrees of freedom lost to the regression).
Returns:
variance series float The calculated residual variance (σ²res), either biased or unbiased.
sumW series float The sum of weights over the lookback period (Σw).
sumW2 series float The sum of squared weights over the lookback period (Σw²).
wResStdDev(source, weight, midLine, slope, length, biased)
Weighted Residual Standard Deviation.
Parameters:
source (float) : series float Data series.
weight (float) : series float Weight series.
midLine (float) : series float Regression value at the last bar.
slope (float) : series float Slope per bar.
length (int) : series int Look-back length ≥ 2.
biased (bool) : series bool true → population (biased); false → sample.
Returns: series float σres; uniform if Σw = 0.
wResStdErr(source, weight, midLine, slope, length, biased)
Weighted Residual Standard Error.
Parameters:
source (float) : series float Data series.
weight (float) : series float Weight series.
midLine (float) : series float Regression value at the last bar.
slope (float) : series float Slope per bar.
length (int) : series int Look-back length ≥ 2.
biased (bool) : series bool true → population (biased); false → sample.
Returns: series float √(σ²res / N_eff); uniform if Σw = 0.
wLRTotVar(mu, sigma, weight, midLine, slope, length, biased)
Weighted Linear-Regression Total Variance **around the
window’s weighted mean μ**.
σ²_tot = E_w ⟶ *within-group variance*
+ Var_w ⟶ *residual variance*
+ Var_w ⟶ *trend variance*
where each bar i in the look-back window contributes
m_i = *mean* (e.g. 1-sec HL2)
σ_i = *sigma* (pre-estimated intrabar σ)
w_i = *weight* (volume, ticks, …)
ŷ_i = b₀ + b₁·x (value of the weighted LR line)
r_i = m_i − ŷ_i (orthogonal residual)
Parameters:
mu (float) : series float Per-bar mean m_i.
sigma (float) : series float Pre-estimated σ_i of each bar.
weight (float) : series float Weight series w_i (≥ 0).
midLine (float) : series float Regression value at the latest bar (ŷₙ₋₁).
slope (float) : series float Slope b₁ of the regression line.
length (int) : series int Look-back length ≥ 2.
biased (bool) : series bool true → population; false → sample.
Returns:
varRes series float The residual variance component (σ²res).
varWtn series float The within-bar variance component (σ²wtn).
varTrd series float The trend variance component (σ²trd), explained by the linear regression.
sumW series float The sum of weights over the lookback period (Σw).
sumW2 series float The sum of squared weights over the lookback period (Σw²).
wLRTotStdDev(mu, sigma, weight, midLine, slope, length, biased)
Weighted Linear-Regression Total Standard Deviation.
Parameters:
mu (float) : series float Per-bar mean m_i.
sigma (float) : series float Pre-estimated σ_i of each bar.
weight (float) : series float Weight series w_i (≥ 0).
midLine (float) : series float Regression value at the latest bar (ŷₙ₋₁).
slope (float) : series float Slope b₁ of the regression line.
length (int) : series int Look-back length ≥ 2.
biased (bool) : series bool true → population; false → sample.
Returns: series float √(σ²tot).
wLRTotStdErr(mu, sigma, weight, midLine, slope, length, biased)
Weighted Linear-Regression Total Standard Error.
SE = √( σ²_tot / N_eff ) with N_eff = Σw² / Σw² (like in wster()).
Parameters:
mu (float) : series float Per-bar mean m_i.
sigma (float) : series float Pre-estimated σ_i of each bar.
weight (float) : series float Weight series w_i (≥ 0).
midLine (float) : series float Regression value at the latest bar (ŷₙ₋₁).
slope (float) : series float Slope b₁ of the regression line.
length (int) : series int Look-back length ≥ 2.
biased (bool) : series bool true → population; false → sample.
Returns: series float √((σ²res, σ²wtn, σ²trd) / N_eff).
wLRLocTotStdDev(mu, sigma, weight, midLine, slope, length, biased)
Weighted Linear-Regression Local Total Standard Deviation.
Measures the total "noise" (within-bar + residual) around the trend.
Parameters:
mu (float) : series float Per-bar mean m_i.
sigma (float) : series float Pre-estimated σ_i of each bar.
weight (float) : series float Weight series w_i (≥ 0).
midLine (float) : series float Regression value at the latest bar (ŷₙ₋₁).
slope (float) : series float Slope b₁ of the regression line.
length (int) : series int Look-back length ≥ 2.
biased (bool) : series bool true → population; false → sample.
Returns: series float √(σ²wtn + σ²res).
wLRLocTotStdErr(mu, sigma, weight, midLine, slope, length, biased)
Weighted Linear-Regression Local Total Standard Error.
Parameters:
mu (float) : series float Per-bar mean m_i.
sigma (float) : series float Pre-estimated σ_i of each bar.
weight (float) : series float Weight series w_i (≥ 0).
midLine (float) : series float Regression value at the latest bar (ŷₙ₋₁).
slope (float) : series float Slope b₁ of the regression line.
length (int) : series int Look-back length ≥ 2.
biased (bool) : series bool true → population; false → sample.
Returns: series float √((σ²wtn + σ²res) / N_eff).
wLSma(source, weight, length)
Weighted Least Square Moving Average.
Parameters:
source (float) : series float Data series.
weight (float) : series float Weight series.
length (int) : series int Look-back length ≥ 2.
Returns: series float Least square weighted mean. Falls back
to unweighted regression if Σw = 0.

mysourcetypesncsLibrary "mysourcetypes"
Libreria personale per sorgenti estese (Close, Open, High, Low, Median, Typical, Weighted, Average, Average Median Body, Trend Biased, Trend Biased Extreme, Volume Body, Momentum Biased, Volatility Adjusted, Body Dominance, Shadow Biased, Gap Aware, Rejection Biased, Range Position, Adaptive Trend, Pressure Balanced, Impulse Wave)
rclose()
Regular Close
Returns: Close price
ropen()
Regular Open
Returns: Open price
rhigh()
Regular High
Returns: High price
rlow()
Regular Low
Returns: Low price
rmedian()
Regular Median (HL2)
Returns: (High + Low) / 2
rtypical()
Regular Typical (HLC3)
Returns: (High + Low + Close) / 3
rweighted()
Regular Weighted (HLCC4)
Returns: (High + Low + Close + Close) / 4
raverage()
Regular Average (OHLC4)
Returns: (Open + High + Low + Close) / 4
ravemedbody()
Average Median Body
Returns: (Open + Close) / 2
rtrendb()
Trend Biased Regular
Returns: Trend-weighted price
rtrendbext()
Trend Biased Extreme
Returns: Extreme trend-weighted price
rvolbody()
Volume Weighted Body
Returns: Body midpoint weighted by volume intensity
rmomentum()
Momentum Biased
Returns: Price biased towards momentum direction
rvolatility()
Volatility Adjusted
Returns: Price adjusted by candle's volatility
rbodydominance()
Body Dominance
Returns: Emphasizes body over wicks
rshadowbias()
Shadow Biased
Returns: Price biased by shadow length
rgapaware()
Gap Aware
Returns: Considers gap between candles
rrejection()
Rejection Biased
Returns: Emphasizes price rejection levels
rrangeposition()
Range Position
Returns: Where close sits within the candle range (0-100%)
radaptivetrend()
Adaptive Trend
Returns: Adapts based on recent trend strength
rpressure()
Pressure Balanced
Returns: Balances buying/selling pressure within candle
rimpulse()
Impulse Wave
Returns: Detects impulsive moves vs corrections

BossExoticMAs
A next-generation moving average and smoothing library by TheStopLossBoss, featuring premium adaptive, exotic, and DSP-inspired filters — optimized for Pine Script® v6 and designed for Traders who demand precision and beauty.
> BossExoticMAs is a complete moving average and signal-processing toolkit built for Pine Script v6.
It combines the essential trend filters (SMA, EMA, WMA, etc.) with advanced, high-performance exotic types used by quants, algo designers, and adaptive systems.
Each function is precision-tuned for stability, speed, and visual clarity — perfect for building custom baselines, volatility filters, dynamic ribbons, or hybrid signal engines.
Includes built-in color gradient theming powered by the exclusive BossGradient —
//Key Features
✅ Full Moving Average Set
SMA, EMA, ZEMA, WMA, HMA, WWMA, SMMA
DEMA, TEMA, T3 (Tillson)
ALMA, KAMA, LSMA
VMA, VAMA, FRAMA
✅ Signal Filters
One-Euro Filter (Crispin/Casiez implementation)
ATR-bounded Range Filter
✅ Color Engine
lerpColor() safe blending using color.from_gradient
Thematic gradient palettes: STOPLOSS, VAPORWAVE, ROYAL FLAME, MATRIX FLOW
Exclusive: BOSS GRADIENT
✅ Helper Functions
Clamping, normalization, slope detection, tick delta
Slope-based dynamic color control via slopeThemeColor()
🧠 Usage Example
//@version=6
indicator("Boss Exotic MA Demo", overlay=true)
import TheStopLossBoss/BossExoticMAs/1 as boss
len = input.int(50, "Length")
atype = input.string("T3", "MA Type", options= )
t3factor = input.float(0.7, "T3 β", step=0.05)
smoothColor = boss.slopeThemeColor(close, "BOSS GRADIENT", 0.001)ma = boss.maSelect(close, len, atype, t3factor, 0.85, 14)
plot(ma, "Boss Exotic MA", color=smoothColor, linewidth=2)
---
🔑 Notes
Built exclusively for Pine Script® v6
Library designed for import use — all exports are prefixed cleanly (boss.functionName())
Some functions maintain internal state (var-based). Warnings are safe to ignore — adaptive design choice.
Each MA output is non-repainting and mathematically stable.
---
📜 Author
TheStopLossBoss
Designer of precision trading systems and custom adaptive algorithms.
Follow for exclusive releases, educational material, and full-stack trend solutions.
movingaverage, trend, adaptive, filter, volatility, smoothing, quant, technicalanalysis, bossgradient, t3, alma, frama, vma
livremySMATestLibLibrary "livremySMATestLib"
TODO: add library description here
mySMA(x)
TODO: add function description here
Parameters:
x (int) : TODO: add parameter x description here
Returns: TODO: add what function returns

SequencerLibraryLibrary "SequencerLibrary"
SequencerLibrary v1 is a Pine Script™ library for identifying, tracking, and visualizing
sequential bullish and bearish patterns on price charts.
It provides a complete framework for building sequence-based trading systems, including:
• Automatic detection and counting of setup and countdown phases.
• Real-time tracking of completion states, perfected setups, and exhaustion signals.
• Dynamic support and resistance thresholds derived from recent price structure.
• Customizable visual highlighting for both setup and countdown sequences.
method doSequence(s, src, config, condition)
Updates the sequence state based on the source value, and user configuration.
Namespace types: Sequence
Parameters:
s (Sequence) : The sequence object containing bullish and bearish setups.
src (float) : The source value (e.g., close price) used for evaluating sequence conditions.
config (SequenceInputs) : The user-defined settings for sequence analysis.
condition (bool) : When true, executes the sequence logic.
Returns:
highlight(s, css, condition)
Highlights the bullish and bearish sequence setups and countdowns on the chart.
Parameters:
s (Sequence) : The sequence object containing bullish and bearish sequence states.
css (SequenceCSS) : The styling configuration for customizing label appearances.
condition (bool) : When true, the function creates and displays labels for setups and countdowns.
Returns:
SequenceState
A type representing the configuration and state of a sequence setup.
Fields:
setup (series int) : Current count of the setup phase (e.g., how many bars have met the setup criteria).
countdown (series int) : Current count of the countdown phase (e.g., bars meeting countdown criteria).
threshold (series float) : The price threshold level used as support/resistance for the sequence.
priceWhenCompleted (series float) : The closing price when the setup or countdown phase is completed.
indicatorWhenCompleted (series float) : The indicator value when the setup or countdown phase is completed.
setupCompleted (series bool) : Indicates if the setup phase has been completed (i.e., reached the required count).
countdownCompleted (series bool) : Indicates if the countdown phase has been completed (i.e., reached exhaustion).
perfected (series bool) : Indicates if the setup meets the "perfected" condition (e.g., aligns with strict criteria).
highlightSetup (series bool) : Determines whether the setup phase should be visually highlighted on the chart.
highlightCountdown (series bool) : Determines whether the countdown phase should be visually highlighted on the chart.
Sequence
A type containing bullish and bearish sequence setups.
Fields:
bullish (SequenceState) : Configuration and state for bullish sequences.
bearish (SequenceState) : Configuration and state for bearish sequences.
SequenceInputs
A type for user-configurable input settings for sequence-based analysis.
Fields:
showSetup (series bool) : Enables or disables the display of setup sequences.
showCountdown (series bool) : Enables or disables the display of countdown sequences.
setupFilter (series string) : A comma‐separated string containing setup sequence counts to be highlighted (e.g., "1,2,3,4,5,6,7,8,9").
countdownFilter (series string) : A comma‐separated string containing countdown sequence counts to be highlighted (e.g., "1,2,3,4,5,6,7,8,9,10,11,12,13").
lookbackSetup (series int) : Defines the lookback period for evaluating setup conditions (default: 4 bars).
lookbackCountdown (series int) : Defines the lookback period for evaluating countdown conditions (default: 2 bars).
lookbackSetupPerfected (series int) : Defines the lookback period to determine a perfected setup condition (default: 6 bars).
maxSetup (series int) : The maximum count required to complete a setup phase (default: 9).
maxCountdown (series int) : The maximum count required to complete a countdown phase (default: 13).
SequenceCSS
A type defining the visual styling options for sequence labels.
Fields:
bullish (series color) : Color used for bullish sequence labels.
bearish (series color) : Color used for bearish sequence labels.
imperfect (series color) : Color used for labels representing imperfect sequences.

AlertSenderLibrary_TradingFinderLibrary "AlertSenderLibrary_TradingFinder"
TODO: add library description here
AlertSender(Condition, Alert, AlertName, AlertType, DetectionType, SetupData, Frequncy, UTC, MoreInfo, Message, o, h, l, c, Entry, TP, SL, Distal, Proximal)
Parameters:
Condition (bool)
Alert (string)
AlertName (string)
AlertType (string)
DetectionType (string)
SetupData (string)
Frequncy (string)
UTC (string)
MoreInfo (string)
Message (string)
o (float)
h (float)
l (float)
c (float)
Entry (float)
TP (float)
SL (float)
Distal (float)
Proximal (float)