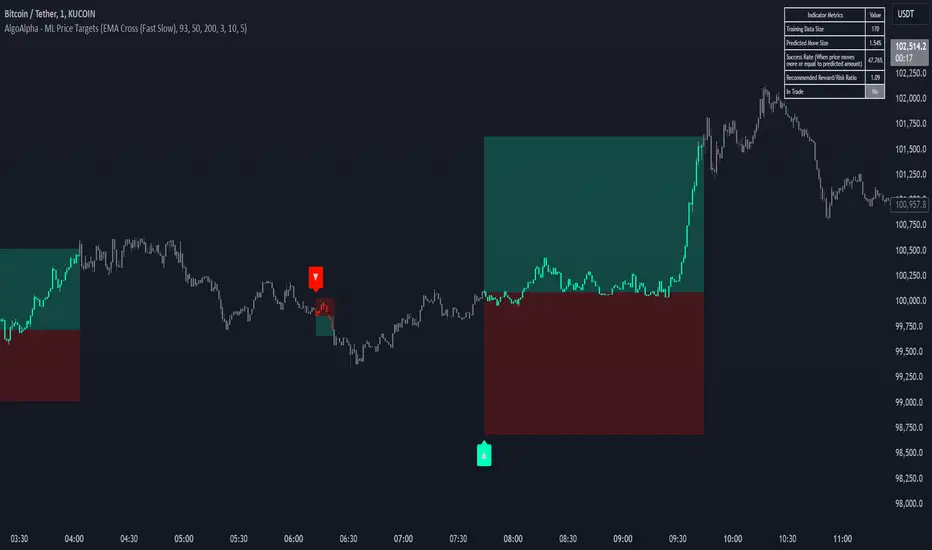
Machine Learning Price Target Prediction Signals [AlgoAlpha]Introducing the Machine Learning Price Target Predictions, a cutting-edge trading tool that leverages kernel regression to provide accurate price targets and enhance your trading strategy. This indicator combines trend-based signals with advanced machine learning techniques, offering predictive insights into potential price movements. Perfect for traders looking to make data-driven decisions with confidence.
What is Kernel Regression and How It Works
Kernel regression is a non-parametric machine learning technique that estimates the relationship between variables by weighting data points based on their similarity to a given input. The similarity is determined using a kernel function, such as the Gaussian (RBF) kernel, which assigns higher weights to closer data points and progressively lower weights to farther ones. This allows the model to make smooth and adaptive predictions, balancing recent data and historical trends.
Key Features
🎯 Predictive Price Targets : Uses kernel regression to estimate the magnitude of price movements.
📈 Dynamic Trend Analysis : Multiple trend detection methods, including EMA crossovers, Hull Moving Average, and SuperTrend.
🔧 Customizable Settings : Adjust bandwidth for kernel regression and tweak trend indicator parameters to suit your strategy.
📊 Visual Trade Levels : Displays take-profit and stop-loss levels directly on the chart with customizable colors.
📋 Performance Metrics : Real-time win rate, recommended risk-reward ratio, and training data size displayed in an on-chart table.
🔔 Alerts : Get notified for new trends, take-profit hits, and stop-loss triggers.
How to Use
🛠 Add the Indicator : Add it to your favorites and apply it to your chart. Configure the trend detection method (SuperTrend, HMA, or EMA crossover) and other parameters based on your preferences.
📊 Analyze Predictions : Observe the predicted move size, recommended risk-reward ratio, and trend direction. Use the displayed levels for trade planning.
🔔 Set Alerts : Enable alerts for trend signals, take-profit hits, or stop-loss triggers to stay informed without constant monitoring.
How It Works
The indicator calculates features such as price volatility, relative strength, and trend signals, which are stored during training periods. When a trend change is detected, the kernel regression model predicts the likely price move based on these features. Predictions are smoothed using the specified bandwidth to avoid overfitting while ensuring timely responses to feature changes. Visualized take-profit and stop-loss levels help traders optimize risk management. Real-time metrics like win rate and recommended risk-reward ratios provide actionable insights for decision-making.
Analisi tecnica
[GrandAlgo] Liquidity HeatmapThe Liquidity Heatmap is a unique indicator designed to identify and highlight zones where price is likely to react based on liquidity dynamics. Unlike tools that analyze volume across all price levels, this indicator focuses specifically on liquidity concentrated around potential reversal zones. By evaluating price action and volume at these critical levels, it identifies areas of heightened interest for traders.
Key Features:
Dynamic Liquidity Zones:
Automatically calculates liquidity zones based on historical price activity, ensuring real-time relevance.
Volume-Based or Candle Interaction Analysis:
Choose between volume-based evaluation to focus on order flow or candle-based interaction for a broader perspective.
Customizable Percentile Threshold:
Filter zones based on their significance by setting a threshold to display only the top liquidity areas.
Lookback Period Control:
Define how many candles the indicator should analyze, allowing you to focus on short-term or long-term liquidity levels.
Color-Coded Visuals:
Liquidity zones are displayed using gradients, with green representing potential bullish zones (below price) and red representing potential bearish zones (above price). Stronger zones are indicated with darker colors.
How It Works:
The Liquidity Heatmap divides the price range into multiple levels, evaluating each level for interaction with historical price data. Liquidity zones are calculated based on:
Volume Concentration: When enabled, the indicator evaluates zones using historical volume, highlighting areas with significant order flow.
Candle Interactions: When volume-based analysis is disabled, the indicator calculates the number of candles interacting with each zone to determine its importance.
Zones that meet the user-defined percentile threshold are highlighted on the chart. Color gradients indicate the strength of each zone, allowing traders to prioritize the most significant areas. Real-time alerts notify users when the price touches these zones, providing actionable insights.
The image illustrates the volume-based analysis feature of the Liquidity Heatmap indicator. Liquidity zones are dynamically highlighted with intuitive color gradients—green for bullish volume and red for bearish volume—providing a clear visual representation of areas with concentrated liquidity at potential reversal points. This feature helps traders focus on zones with significant market activity, enhancing their decision-making process.
Disclaimer
This indicator is a technical analysis tool designed to assist traders by providing insights into market conditions. It does not guarantee future price movements or trading outcomes and should not be relied upon as a sole decision-making tool. The effectiveness of this indicator depends on its application, which requires your trading knowledge, experience, and judgment.
Trading involves significant financial risk, including the potential loss of capital. Past performance of any tool or indicator does not guarantee future results. This script is intended for educational and informational purposes only and does not constitute financial or investment advice. Users are strongly encouraged to perform their own analysis and consult with a qualified financial professional before making trading decisions.

Trend Reversal Probability [Algoalpha]Introducing Trend Reversal Probability by AlgoAlpha – a powerful indicator that estimates the likelihood of trend reversals based on an advanced custom oscillator and duration-based statistics. Designed for traders who want to stay ahead of potential market shifts, this indicator provides actionable insights into trend momentum and reversal probabilities.
Key Features :
🔧 Custom Oscillator Calculation: Combines a dual SMA strategy with a proprietary RSI-like calculation to detect market direction and strength.
📊 Probability Levels & Visualization: Plots average signal durations and their statistical deviations (±1, ±2, ±3 SD) on the chart for clear visual guidance.
🎨 Dynamic Color Customization: Choose your preferred colors for upward and downward trends, ensuring a personalized chart view.
📈 Signal Duration Metrics: Tracks and displays signal durations with columns representing key percentages (80%, 60%, 40%, and 20%).
🔔 Alerts for High Probability Events: Set alerts for significant reversal probabilities (above 84% and 98% or below 14%) to capture key trading moments.
How to Use :
Add the Indicator: Add Trend Reversal Probability to your favorites by clicking the star icon.
Market Analysis: Use the plotted probability levels (average duration and ±SD bands) to identify overextended trends and potential reversals. Use the color of the duration counter to identify the current trend.
Leverage Alerts: Enable alerts to stay informed of high or extreme reversal probabilities without constant chart monitoring.
How It Works :
The indicator begins by calculating a custom oscillator using short and long simple moving averages (SMA) of the midpoint price. A proprietary RSI-like formula then transforms these values to estimate trend direction and momentum. The duration between trend reversals is tracked and averaged, with standard deviations plotted to provide probabilistic guidance on trend longevity. Additionally, the indicator incorporates a cumulative probability function to estimate the likelihood of a trend reversal, displaying the result in a data table for easy reference. When probability levels cross key thresholds, alerts are triggered, helping traders take timely action.

Phase Cross Strategy with Zone### Introduction to the Strategy
Welcome to the **Phase Cross Strategy with Zone and EMA Analysis**. This strategy is designed to help traders identify potential buy and sell opportunities based on the crossover of smoothed oscillators (referred to as "phases") and exponential moving averages (EMAs). By combining these two methods, the strategy offers a versatile tool for both trend-following and short-term trading setups.
### Key Features
1. **Phase Cross Signals**:
- The strategy uses two smoothed oscillators:
- **Leading Phase**: A simple moving average (SMA) with an upward offset.
- **Lagging Phase**: An exponential moving average (EMA) with a downward offset.
- Buy and sell signals are generated when these phases cross over or under each other, visually represented on the chart with green (buy) and red (sell) labels.
2. **Phase Zone Visualization**:
- The area between the two phases is filled with a green or red zone, indicating bullish or bearish conditions:
- Green zone: Leading phase is above the lagging phase (potential uptrend).
- Red zone: Leading phase is below the lagging phase (potential downtrend).
3. **EMA Analysis**:
- Includes five commonly used EMAs (13, 26, 50, 100, and 200) for additional trend analysis.
- Crossovers of the EMA 13 and EMA 26 act as secondary buy/sell signals to confirm or enhance the phase-based signals.
4. **Customizable Parameters**:
- You can adjust the smoothing length, source (price data), and offset to fine-tune the strategy for your preferred trading style.
### What to Pay Attention To
1. **Phases and Zones**:
- Use the green/red phase zone as an overall trend guide.
- Avoid taking trades when the phases are too close or choppy, as it may indicate a ranging market.
2. **EMA Trends**:
- Align your trades with the longer-term trend shown by the EMAs. For example:
- In an uptrend (price above EMA 50 or EMA 200), prioritize buy signals.
- In a downtrend (price below EMA 50 or EMA 200), prioritize sell signals.
3. **Signal Confirmation**:
- Consider combining phase cross signals with EMA crossovers for higher-confidence trades.
- Look for confluence between the phase signals and EMA trends.
4. **Risk Management**:
- Always set stop-loss and take-profit levels to manage risk.
- Use the phase and EMA zones to estimate potential support/resistance areas for exits.
5. **Whipsaws and False Signals**:
- Be cautious in low-volatility or sideways markets, as the strategy may generate false signals.
- Use additional indicators or filters to avoid entering trades during unclear market conditions.
### How to Use
1. Add the strategy to your chart in TradingView.
2. Adjust the input settings (e.g., smoothing length, offsets) to suit your trading preferences.
3. Enable the strategy tester to evaluate its performance on historical data.
4. Combine the signals with your own analysis and risk management plan for best results.
This strategy is a versatile tool, but like any trading method, it requires proper understanding and discretion. Always backtest thoroughly and trade with discipline. Let me know if you need further assistance or adjustments to the strategy!

MAG 7 - Weighted Multi-Symbol Momentum + ExtrasOverview
This indicator aggregates the percentage change of multiple symbols into a single “weighted momentum” value. You can set individual weights to emphasize or de-emphasize particular stocks. The script plots two key items:
The default tickers in the script are:
AAPL (Apple)
AMZN (Amazon)
NVDA (NVIDIA)
MSFT (Microsoft)
GOOGL (Alphabet/Google)
TSLA (Tesla)
META (Meta Platforms/Facebook)
Raw Weighted Momentum (Histogram):
Each bar represents the combined (weighted) percentage change across your chosen symbols for that bar.
Bars are colored green if the momentum is above zero, or red if below zero.
Smoothed Momentum (Yellow Line):
An Exponential Moving Average (EMA) of the raw momentum for a smoother trend view.
Helps visualize when short-term momentum is accelerating or decelerating relative to its average.
Features
Symbol Inputs: Up to seven user-defined tickers, with weights for each symbol.
Smoothing Period: Set a custom lookback length to calculate the EMA (or switch to SMA in the code if you prefer).
Table Display: A built-in table in the top-right corner lists each symbol’s real-time percentage change, plus the total weighted momentum.
Alerts:
Configure alerts for when the weighted momentum crosses above or below user-defined thresholds.
Helps you catch major shifts in sentiment across multiple symbols.
How To Use
Select Symbols & Weights: In the indicator’s settings, specify the tickers you want to monitor and their corresponding weights. Weights default to 1 (equal weighting).
Watch the Bars vs. Zero:
Bars above zero mean a positive weighted momentum (the basket is collectively moving up).
Bars below zero mean negative weighted momentum (the basket is collectively under pressure).
Check the Yellow Line: The EMA of momentum.
If the bars consistently stay above the line, short-term momentum is stronger than its recent average.
If the bars dip below the line, momentum is weakening relative to its average.
Review the Table: Quick snapshot of each symbol’s daily percentage change plus the total basket momentum, all color-coded red or green.
Caution & Tips
This indicator measures rate of change, not absolute price levels. A rising momentum can still be part of a larger downtrend.
Always combine momentum readings with other technical and/or fundamental signals for confirmation.
For better reliability, experiment with different smoothing lengths to suit your trading style (shorter for scalping, longer for swing or positional approaches).

Kalman Step Signals [AlgoAlpha]Take your trading to the next level with the Kalman Step Signals indicator by AlgoAlpha! This advanced tool combines the power of Kalman Filtering and the Supertrend indicator, offering a unique perspective on market trends and price movements. Designed for traders who seek clarity and precision in identifying trend shifts and potential trade entries, this indicator is packed with customizable features to suit your trading style.
Key Features
🔍 Kalman Filter Smoothing : Dynamically smooths price data with user-defined parameters for Alpha, Beta, and Period, optimizing responsiveness and trend clarity.
📊 Supertrend Overlay : Incorporates a classic Supertrend indicator to provide clear visual cues for trend direction and potential reversals.
🎨 Customizable Appearance : Adjust colors for bullish and bearish trends, along with optional exit bands for more nuanced analysis.
🔔 Smart Alerts : Detect key moments like trend changes or rejection entries for timely trading decisions.
📈 Advanced Visualization : Includes optional entry signals, exit bands, and rejection markers to pinpoint optimal trading opportunities.
How to Use
Add the Indicator : Add the script to your TradingView favorites. Customize inputs like Kalman parameters (Alpha, Beta, Period) and Supertrend settings (Factor, ATR Period) based on your trading strategy.
Interpret the Signals : Watch for trend direction changes using Supertrend lines and directional markers. Utilize rejection entries to identify price rejections at trendlines for precision entry points.
Set Alerts : Enable the built-in alert conditions for trend changes or rejection entries to act swiftly on trading opportunities without constant chart monitoring.
How It Works
The indicator leverages a Kalman Filter to smooth raw price data, balancing responsiveness and noise reduction using user-controlled parameters. This refined price data is then fed into a Supertrend calculation, combining ATR-based volatility analysis with dynamic upper and lower bands. The result is a clear and reliable trend-detection system. Additionally, it features rejection markers for bullish and bearish reversals when prices reject the trendline, along with exit bands to visualize potential price targets. The integration of customizable alerts ensures traders never miss critical market moves.
Add the Kalman Step Signals to your TradingView charts today and enjoy a smarter, more efficient trading experience! 🚀🌟

Santa's Adventure [AlgoAlpha]Introducing "Santa's Adventure," a unique and festive TradingView indicator designed to bring the holiday spirit to your trading charts. With this indicator, watch as Santa, his sleigh, Rudolf the reindeer, and a flurry of snowflakes come to life, creating a cheerful visual experience while you monitor the markets.
Key Features:
🎁 Dynamic Santa Sleigh Visualization : Santa's sleigh, Rudolf, and holiday presents adapt to price movements and chart structure.
🎨 Customizable Holiday Colors : Adjust colors for Santa’s outfit, Rudolf’s nose, sleigh, presents, and more.
❄️ Realistic Snow Animation : A cascade of snowflakes decorates your charts, with density and range adjustable to suit your preferences.
📏 Adaptive Scaling : All visuals scale based on price volatility and market dynamics.
🔄 Rotation by Trend : Santa and his entourage tilt to reflect market trends, making it both functional and fun!
How to Use :
Add the Indicator to Your Chart : Search for "Santa's Adventure" in the TradingView indicator library and add it to your favorites. Use the input menu to adjust snow density, sleigh colors, and other festive elements to match your trading style or holiday mood.
Observe the Market : Watch Santa’s sleigh glide across the chart while Rudolf leads the way, with snowflakes gently falling to enhance the visual charm.
How It Works :
The indicator uses price volatility and market data to dynamically position Santa, his sleigh, Rudolf, and presents on the chart. Santa's Sleigh angle adjusts based on price trends, reflecting market direction. Santa's sleigh and the snowstorm are plotted using advanced polyline arrays for a smooth and interactive display. A festive algorithm powers the snowfall animation, ensuring a consistent and immersive holiday atmosphere. The visuals are built to adapt seamlessly to any market environment, combining holiday cheer with market insights.
Add "Santa's Adventure" to your TradingView charts today and bring the holiday spirit to your trading journey, Merry Christmas! 🎅🎄
Volume and Price, EMA Hierarchy Scoring Relations V 1.1Understanding the Volume and Price, EMA Hierarchy Scoring Indicator
Financial markets are often analyzed through a series of technical indicators, each providing valuable but isolated insights into price movements, volume dynamics, and trends. While these tools are widely used, they often lack context when applied individually. The Volume and Price, EMA Hierarchy Scoring Indicator was developed to bridge this gap by introducing structure, context, and relationships between these known indicators.
By utilizing Exponential Moving Averages (EMAs) and assigning periods derived from prime numbers, this indicator creates a scoring system that evaluates the relative positioning and interaction of 13 widely used technical tools. This approach adds meaning to individual indicator outputs by:
Revealing how their results align, diverge, or complement each other.
Quantifying their collective behavior through a hierarchy scoring system.
Enabling traders to not only analyze indicators individually but also combine them to uncover how they influence and interact with each other.
The result is a tool that provides clarity and insight into market behavior, enabling traders to move beyond surface-level analysis and uncover deeper patterns and relationships within the data.
Key Features and Methodology
The Volume and Price, EMA Hierarchy Scoring Indicator is built on a robust mathematical framework that evaluates and visualizes the relationships between 13 widely used technical indicators. By leveraging Exponential Moving Averages (EMAs) and prime numbers, the indicator provides meaningful insights into individual indicator performance as well as their combined behavior.
1. EMA Hierarchy Scoring
At the core of the indicator is its ability to assess the hierarchy of EMAs for each tool. This hierarchy scoring evaluates how the EMAs are aligned relative to one another, providing traders with a quantifiable measure of the indicator's internal consistency and its alignment with trends.
How It Works:
Each EMA is assigned a period derived from a unique prime number. This ensures that no two EMAs overlap, preserving their individuality.
The scoring system measures the gaps between these EMAs, assigning weighted values to these relationships based on their position in the hierarchy.
Why Prime Numbers?
Prime numbers ensure that the EMA periods are distinct and mathematically unrelated, creating a structured yet diverse dataset for analysis.
This approach allows the scoring system to capture both short-term and long-term trends, while avoiding redundancy.
2. Independent Indicator Evaluation
One of the key features of this indicator is the ability to analyze any of the 13 tools individually. Each indicator has its own module, complete with adjustable parameters and dedicated visualizations:
Histograms: Represent the raw EMA hierarchy score. Positive bars indicate alignment with upward trends, while negative bars highlight potential reversals or misalignments.
Smoothed Line: Averages the histogram values, reducing short-term noise and emphasizing longer-term trends.
Signal Line: Highlights trend shifts by smoothing the smoothed line further. Crossovers between the smoothed line and the signal line act as actionable signals for traders.
3. Combining Indicators for Context
Beyond individual analysis, the indicator allows users to combine multiple indicators to evaluate their interactions. For example:
Pairing ALMA (price smoothing) with Volume enables traders to see how price trends are supported or contradicted by market activity.
Combining Delta Volume and CMF (Chaikin Money Flow) reveals nuanced dynamics of buying and selling pressure.
Number of Combinations
With 13 tools available, the indicator supports "two to the power of thirteen minus one," which equals 8,191possible combinations. This flexibility empowers traders to experiment with various subsets of indicators, tailoring their analysis to specific market conditions or strategies.
Detailed Breakdown of Indicators
The Volume and Price, EMA Hierarchy Scoring Indicator integrates 13 widely used technical indicators, each bringing a unique perspective to market analysis. These indicators are scored individually using the EMA hierarchy system and can also be combined for more comprehensive insights.
Here’s a detailed look at what each indicator contributes:
Price Analysis
Arnaud Legoux Moving Average (ALMA):
Purpose:
ALMA smooths price data, reducing noise while maintaining responsiveness to trends.
Unique Features:
The EMA hierarchy scoring highlights how well ALMA’s EMAs align, revealing the strength of price trends.
Visualization includes a histogram of ALMA scores, a smoothed line, and a signal line.
Settings:
Adjustable parameters for the window size, offset, and sigma.
Tooltips guide users on how each setting affects the calculation.
Application:
Evaluate price momentum or combine with volume-based indicators to validate trends.
2. Price Hierarchy Score (PRC):
Purpose:
Focuses solely on price behavior to identify consistency and strength.
Visualization:
Includes a histogram representing raw scores and smoothed and signal lines for trend detection.
Settings:
Adjustable EMA periods derived from prime numbers.
Customizable smoothing and signal periods.
Volume Insights
3. Chaikin Money Flow (CMF):
Purpose:
Integrates price and volume data to measure capital flow direction and strength.
Visualization:
Raw CMF hierarchy scores are plotted, alongside smoothed and signal lines for easier trend identification.
Settings:
Lookback period adjustment for CMF calculation.
Toggle for enabling/disabling the module.
Application:
Use alongside Delta Volume to assess buying and selling pressure.
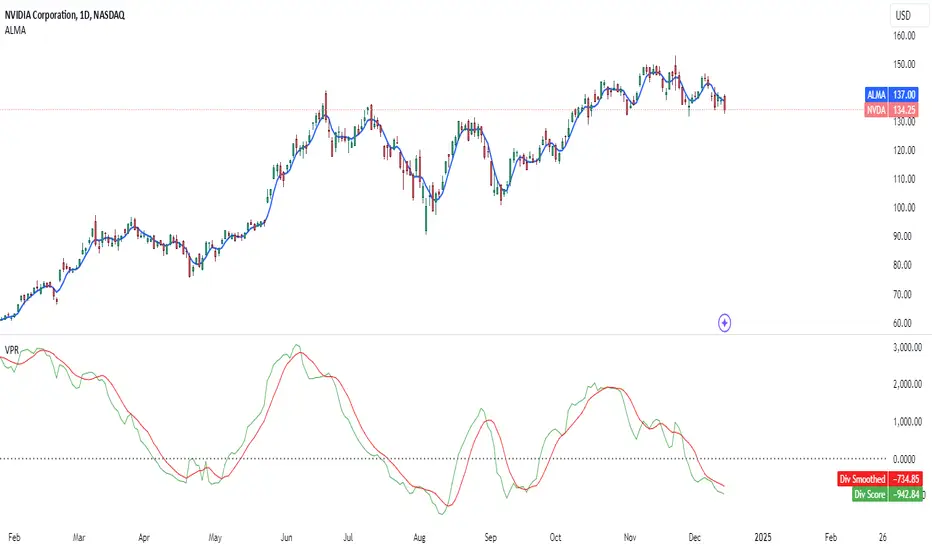
Above chart snapshot, in addition to the well-known CMF indicator, the Volume and Price indicator and the EMA Hierarchy Scoring can also be seen in the chart. By enabling the CMF evaluation, you can observe both how the CMF is analyzed and how it aligns with the price chart.
4. Delta Volume:
Purpose:
Captures the balance between buying and selling activity in the market.
Visualization:
A histogram represents the raw divergence in buying and selling strength.
Signal lines help identify momentum shifts.
Settings:
Options to set lower timeframes for more granular analysis.
Adjustable smoothing and signal periods.
Application:
Combine with CMF for a deeper understanding of capital flow dynamics.
In the above chart, alongside the Volume Delta indicator, you can observe our evaluation of this indicator's performance.
In the above chart, as explained, you can observe the impact of our evaluation metrics both individually and in combination with other indicators. This chart featuring VPR (Volume and Price Indicator along with EMA Hierarchy Scoring) illustrates the interplay between CMF and Volume Delta.
5. Volume Hierarchy Score (VOL):
Purpose:
Tracks raw volume data to identify areas of heightened market activity.
Visualization:
Histogram and smoothed lines highlight volume trends.
Settings:
Prime-numbered EMA periods to analyze volume hierarchy.
Adjustable smoothing and signal line parameters.
In the above chart, as previously explained, by analyzing the EMA of volume data over 25 iterations within specified periods (based on the first 25 prime numbers), you can observe the relationship between volume and price. We are witnessing a price increase, while the current volume position shows significant deviation and instability relative to the EMAs calculated over 25 different time periods.
In the above chart, by simultaneously enabling the evaluation of both volume and price, you can clearly observe the interplay and impact of volume and price in relation to each other.
Momentum and Trend Strength
6. Aroon Up:
Purpose:
Evaluates the strength of trends by measuring time since price highs.
Visualization :
Hierarchy scores plotted as histograms with trend-tracking smoothed and signal lines.
Settings:
Lookback period adjustments.
Module toggle for focus on Aroon trends.
If the analysis and interpretation of Aroon lines seem somewhat complex, the Volume and Price Indicator along with EMA Hierarchy Scoring provides a clear and intuitive representation of the Aroon indicator in relation to the price chart, as you can see in the current chart.
7. Average Directional Index (ADX):
Purpose:
Quantifies the strength of trends, regardless of direction.
Visualization:
ADX scores and smoothed lines for trend confirmation.
Settings:
Adjustable directional indicator (DI) and ADX smoothing periods.
Tooltip guidance for parameter optimization.
The simultaneous chart of the well-known ADX indicator alongside the evaluation system of the Volume and Price Indicator with EMA Hierarchy Scoring provides an integrated perspective on the ADX indicator.
8. Elder Force Index (EFI):
Purpose:
Combines price and volume to measure the strength of price movements.
Visualization:
EFI hierarchy scores with clear trend representation through signal and smoothed lines.
Settings:
Length adjustments for sensitivity control.
Smoothing and signal line customization.
In the above chart, we simultaneously have the well-known EFI indicator and the Volume and Price Indicator along with EMA Hierarchy Scoring. As we progress further, you will become increasingly familiar with the functionality and precision of the Volume and Price Indicator along with EMA Hierarchy Scoring.
Volatility and Oscillators
9. Ehler Fisher Transform:
Purpose:
Highlights extreme price movements by transforming price data into a Gaussian distribution.
Visualization:
Fisher Transform scores with smoothed trend indicators.
Settings:
Fisher length adjustment.
Module toggle and smoothing controls.
10. McGinley Dynamic (MGD):
Purpose:
Tracks price trends while adjusting for volatility, providing a smoother signal.
Visualization:
Raw MGD hierarchy scores with smoothed and signal lines.
Settings:
Lookback period customization.
Adjustable smoothing and signal periods
.
Ichimoku Components
11. Conversion Line (ICMC):
Purpose:
Captures short-term price equilibrium levels within the Ichimoku framework.
Visualization:
Short-term hierarchy scores visualized with smoothed lines.
Settings:
Adjustable conversion line length.
Tooltips explaining Ichimoku-related insights.
12. Base Line (ICMB):
Purpose:
Identifies medium-term equilibrium levels in the Ichimoku system.
Visualization:
Scores and smoothed trend lines for medium-term trends.
Settings:
Base line period adjustments.
Tooltip guidance for Ichimoku analysis.
In the chart below, to better illustrate the capabilities of the Volume and Price, EMA Hierarchy Scoring relation, we present a chart that evaluates the simultaneous interaction of Ichimoku Base and Conversion lines, Price, Volume, and Delta Volume.
Market Health
13. Money Flow Index (MFI):
Purpose:
Detects overbought or oversold conditions using price and volume data.
Visualization:
MFI hierarchy scores with trend tracking through smoothed and signal lines.
Settings:
Lookback period customization for sensitivity adjustment.
Module toggle and visualization controls.
EMA of Indicators: A Unified Scoring Metric
The EMA of Indicators module introduces a unique way to aggregate and analyze the individual scores of all 13 indicators. By applying a unified EMA calculation to their hierarchy scores, this module provides a single, combined metric that reflects the overall market sentiment based on the collective behavior of all indicators.
How It Works
1. Indicator-Specific EMAs:
An EMA is calculated for each of the 13 indicator hierarchy scores. The EMA period is adjustable in the settings menu, allowing traders to control how responsive the metric is to recent changes.
2. Combined EMA Calculation:
The individual EMAs are summed and averaged to generate a single Combined EMA Value. This value represents the average performance and alignment of all the indicators.
3. Smoothed and Signal Lines:
To enhance the interpretability of the Combined EMA Value:
- A Smoothed EMA is calculated using an additional EMA to filter out short-term fluctuations.
- A Signal Line is applied to the Smoothed EMA, providing actionable signals when crossovers occur.
Visualization
The Combined EMA Value is visualized as:
Histogram Bars: Represent the raw Combined EMA Value, highlighting positive or negative market alignment.
Smoothed Line: Tracks longer-term trends by smoothing the combined value.
Signal Line: Marks potential shifts in market sentiment when it crosses the Smoothed Line.
Customization and Settings
The settings menu allows full control over the EMA calculation:
Enable/Disable Module: Toggle the entire EMA of Indicators functionality.
Adjust EMA Period: Define the responsiveness of the individual indicator EMAs.
Set Smoothing Period: Control the degree of smoothing applied to the combined score.
Signal Line Period: Fine-tune the signal line's sensitivity for detecting trend shifts.
Tooltips accompany each parameter, ensuring that users understand their impact on the final visualization.
Applications in Market Analysis
1. Market Health Overview:
Use the Combined EMA Value as a quick snapshot of overall market sentiment based on all 13 indicators.
2. Trend Confirmation:
Analyze crossovers between the Smoothed EMA and Signal Line to confirm market trends or reversals.
3. Flexible Strategy Development:
Adjust EMA and smoothing periods to align the module with short-term or long-term trading strategies.
From EMA Scoring to Divergence-Weighted Insights
While the EMA scoring system provides insights into individual indicators and their trends, the Divergence-Weighted Volatility Adjusted Score takes this analysis further by combining and comparing all 13 indicators into a unified metric.
The Divergence-Weighted Volatility Adjusted Score
This score evaluates how the EMA scores of the 13 indicators interact and diverge, adding a layer of context and collective behavior analysis to the raw hierarchy scores.
1. Normalization:
All EMA scores are scaled to a common range, ensuring comparability regardless of the magnitude of individual indicators.
2. Divergence Analysis:
The system calculates the average score of the 13 indicators and evaluates the deviation (or divergence) of each individual score from this average.
Indicators with significant divergence are highlighted, as they often signal critical market dynamics.
3. Dynamic Weighting:
Indicators with greater divergence are assigned higher weights in the combined score. This ensures that outliers with meaningful signals are emphasized.
4. Volatility Adjustment:
The combined score is adjusted based on market volatility (calculated as the standard deviation of the score over a defined lookback period). This stabilizes the output, making it reliable even during turbulent market conditions.
Visualization and Customization
The Divergence-Weighted Volatility Adjusted Score is plotted as a dynamic line chart, offering a clear visual summary of the collective behavior of all indicators. The chart includes:
Smoothed Score Line: Filters out noise and emphasizes longer-term trends.
Signal Line: Helps identify potential trend shifts by tracking smoothed score crossovers.
Settings:
Lookback Period: Defines the time frame for volatility calculation.
Smoothing Period: Controls the degree of noise reduction in the smoothed score line.
Signal Line Period: Adjusts the responsiveness of the signal line.
These settings are fully adjustable, with tooltips guiding users to understand their impact.
Applications
The Divergence-Weighted Volatility Adjusted Score has several practical applications:
1. Cross-Indicator Alignment:
Detect when multiple indicators align or diverge, signaling potential opportunities or risks.
2. Dynamic Market Insights:
Adapt to changing conditions with the volatility-adjusted scoring.
3. Trend Confirmation:
Use smoothed and signal lines to validate trends identified by individual indicators.
Conclusion
The Volume and Price, EMA Hierarchy Scoring Indicator redefines how traders analyze financial markets. By combining 13 widely used technical tools with a structured scoring system based on Exponential Moving Averages (EMAs) and prime-numbered periods, this indicator brings depth and context to market analysis.
Key features include:
Independent Analysis: Evaluate individual indicators with precise EMA hierarchy scoring to assess their alignment with market trends.
Dynamic Combinations: Explore the relationships between indicators through over 8,000 combinations to uncover nuanced interactions and patterns.
Divergence-Weighted Scoring: Compare the collective behavior of indicators using a divergence-weighted system, providing a holistic market perspective adjusted for volatility.
Customization: Enable or disable modules, adjust smoothing and signal periods, and fine-tune settings to align the indicator with specific trading strategies.
User-Friendly Visualizations: Intuitive histograms, smoothed lines, and signal lines help traders identify trends, reversals, and market alignment at a glance.
This indicator empowers traders to move beyond isolated analysis by creating meaning and context between known tools. Whether you’re a scalper seeking short-term trends or a swing trader analyzing broader market movements, the Volume and Price, EMA Hierarchy Scoring Indicator offers insights tailored to your strategy.
Disclaimer
The Volume and Price, EMA Hierarchy Scoring Indicator is a tool for technical analysis and market evaluation. While it provides structured insights into market behavior, no indicator can guarantee success or eliminate the inherent risks of trading. Market conditions are complex, and multiple factors influence price movements.
Users are advised to:
Combine this indicator with other analysis methods, such as fundamental analysis or risk management strategies.
Make informed decisions based on their own analysis, trading goals, and risk tolerance.
Trading involves significant risk, and past performance does not guarantee future results. Always consult with a financial advisor or professional before making trading decisions.
LRI Momentum Cycles [AlgoAlpha]Discover the LRI Momentum Cycles indicator by AlgoAlpha, a cutting-edge tool designed to identify market momentum shifts using trend normalization and linear regression analysis. This advanced indicator helps traders detect bullish and bearish cycles with enhanced accuracy, making it ideal for swing traders and intraday enthusiasts alike.
Key Features :
🎨 Customizable Appearance : Set personalized colors for bullish and bearish trends to match your charting style.
🔧 Dynamic Trend Analysis : Tracks market momentum using a unique trend normalization algorithm.
📊 Linear Regression Insight : Calculates real-time trend direction using linear regression for better precision.
🔔 Alert Notifications : Receive alerts when the market switches from bearish to bullish or vice versa.
How to Use :
🛠 Add the Indicator : Favorite and apply the indicator to your TradingView chart. Adjust the lookback period, linear regression source, and regression length to fit your strategy.
📊 Market Analysis : Watch for color changes on the trend line. Green signals bullish momentum, while red indicates bearish cycles. Use these shifts to time entries and exits.
🔔 Set Alerts : Enable notifications for momentum shifts, ensuring you never miss critical market moves.
How It Works :
The LRI Momentum Cycles indicator calculates trend direction by applying linear regression on a user-defined price source over a specified period. It compares historical trend values, detecting bullish or bearish momentum through a dynamic scoring system. This score is normalized to ensure consistent readings, regardless of market conditions. The indicator visually represents trends using gradient-colored plots and fills to highlight changes in momentum. Alerts trigger when the momentum state changes, providing actionable trading signals.

Highest High, Lowest Low, Midpoint for Selected Days [kiyarash]Highest High, Lowest Low, and Midpoint for Selected Days Indicator
This custom TradingView indicator allows you to visualize the highest high, lowest low, and the midpoint (average of the highest high and lowest low) over a custom-defined period. You can choose a starting date and specify how many days ahead you want to track the highest and lowest values. This is useful for identifying key levels in a trend and potential support or resistance zones.
How to Use:
Set the Starting Date:
In the settings, input the starting date from which you want to begin tracking the price range. This will be the reference point for your analysis.
Choose the Number of Days to Track:
Specify how many days you want to analyze from the selected starting date. For example, if you want to see the highest high and lowest low over the next 3 days, enter "3" in the settings.
Visualizing the Levels:
The indicator will automatically calculate the highest price and the lowest price over the selected period and draw three lines:
Red Line: Represents the Highest High within the selected period.
Green Line: Represents the Lowest Low within the selected period.
Blue Line: Represents the Midpoint, which is the average of the Highest High and Lowest Low.
Interpretation:
Highest High is a key resistance level, indicating the highest price reached within the specified period.
Lowest Low is a key support level, showing the lowest price during the same period.
Midpoint provides a reference for the average price, often acting as a neutral level between support and resistance.
This tool can help traders to quickly assess potential market ranges, identify breakout or breakdown points, and make informed decisions based on recent price action.
How to Apply:
Add the indicator to your chart.
Adjust the settings to choose your desired starting date and the number of days you want to analyze.
Observe the drawn lines for the Highest High, Lowest Low, and Midpoint levels, and use them to assist in your trading decisions.

Resistance & SupportThis indicator combines multiple analytical methods to calculate potential support and resistance levels for the upcoming trading day, leveraging historical price data. The calculations are based on three key areas:
Pivot Points: These are calculated using the previous day's high, low, and close values to provide central price levels, along with first and second-level support and resistance (S1, S2, R1, R2). These levels are commonly used in technical analysis and can serve as reference points for market entries and exits.
3-Day Price Average (3DBP): This value provides a short-term trend signal by averaging the high, low, and close prices over the past three days. The indicator helps identify whether the market has been trading at higher or lower levels recently, which can signal bullish or bearish trends.
Trend Detection: The script also includes a short-term and long-term trend analysis:
Short-Term Trend: The prior day’s 3DBP is compared to the previous day’s 3DBP to gauge the market's short-term direction.
Long-Term Trend: The prior close is compared to the open from 50 days ago, offering an indication of the overall market trend.
These components work together to provide actionable insights on potential entry points. For example:
In a bullish market, support levels may act as potential entry points for long trades when the price retraces.
In a bearish market, resistance levels may act as potential entry points for short trades upon price rejection.
The Trend Table at the top right of the chart displays the short-term and long-term trend information for quick reference. It shows whether the trends are bullish or bearish based on the calculations above.
While originally optimized for the EUR/USD currency pair, this indicator can be applied to other forex pairs. However, results may vary depending on the instrument, and further testing is recommended for non-EUR/USD pairs.
Usage Notes:
Pivot points can often act as both support and resistance. While they provide useful reference levels, in volatile markets, these levels may not always hold. Tight stop-losses are recommended if trading near these levels.
The 3DBP offers insight into past market behavior, and although it’s not guaranteed to act as support or resistance, it can help identify zones of interest in the short term.
This indicator is designed to provide a structured approach to price action analysis, incorporating widely-recognized methods like pivot points and trend detection, while adding unique elements like the 3DBP to enhance its utility.
Advanced MA and MACD PercentageIntroduction
The "Advanced MA and MACD Percentage" indicator is a powerful and innovative tool designed to help traders analyze financial markets with ease and precision. This indicator combines Moving Averages (MA) with the MACD indicator to assess the market’s overall trend and calculate the percentage of buy and sell signals based on current data.
Features
Multi-Timeframe Analysis:
Allows selecting your preferred timeframe for trend analysis, such as minute, hourly, daily, or weekly charts.
Support for Multiple Moving Average Types:
Offers the option to use either Simple Moving Average (SMA) or Exponential Moving Average (EMA), based on user preference.
Comprehensive MACD Analysis:
Analyzes the relationship between multiple moving averages (e.g., 20/50, 50/100) using MACD to provide deeper insights into market dynamics.
Calculation of Buy and Sell Percentages:
Computes the percentage of indicators signaling buy or sell conditions, providing a clear summary to assist trading decisions.
Intuitive Visual Interface:
Displays buy and sell percentages as two visible lines (green and red) on the chart.
Includes reference lines to clarify the range of percentages (100% to 0%).
How It Works
Moving Averages Calculation:
Calculates moving averages (20, 50, 100, 150, and 200) for the selected timeframe.
MACD Pair Analysis:
Computes the MACD to compare the performance between various moving average pairs, such as (20/50) and (50/100).
Identifying Buy and Sell Signals:
Counts the number of indicators signaling buy (price above MAs or positive MACD histogram).
Converts the count into percentages for both buy and sell signals.
Visual Representation:
Plots buy and sell percentages as clear lines (green for buy, red for sell).
Adds reference lines (100% and 0%) for easier interpretation.
How to Use the Indicator?
Settings:
Choose the type of moving average (SMA or EMA).
Select the timeframe that suits your strategy (e.g., 15 minutes, 1 hour, or daily).
Reading the Results:
If the buy percentage (green line) is above 50%, the overall trend is bullish (buy).
If the sell percentage (red line) is above 50%, the overall trend is bearish (sell).
Integrating Into Your Strategy:
Combine it with other indicators to confirm entry and exit signals.
Use it to quickly understand the market’s overall trend without needing complex manual analysis.
Benefits of the Indicator
Simplified Analysis: Provides a straightforward summary of the market's overall trend.
Adaptable to All Timeframes: Works perfectly on all timeframes.
Customizable: Allows users to adjust settings according to their needs.
Important Notes
This indicator does not provide direct buy or sell signals. Instead, it offers a summary of the market’s condition based on a combination of indicators.
It is recommended to use it alongside other technical analysis tools for precise trading signals.
Conclusion
The "Advanced MA and MACD Percentage" indicator is an ideal tool for traders who want to analyze the market using a combination of Moving Averages and MACD. It gives you a comprehensive overview of the overall trend, helping you make informed and quick trading decisions. Try it now and see the difference!

FuTech : Earnings (All 269 Fundamental Metrics of Tradingview)FuTech : Earnings Indicator
The FuTech : Earnings Indicator is a revolutionary tool, offering the most comprehensive integration of all 269 fundamental financial metrics available from the TradingView platform.
This groundbreaking indicator is designed to empower financial researchers, traders, investors, and analysts with an unmatched depth of data, enabling superior analysis and decision-making.
Overview
"FuTech : Earnings Indicator" is the first-ever indicator to provide a holistic comparison of fundamental financial metrics for any stock, covering quarterly, yearly, and trailing twelve months (TTM) periods.
This tool brings together key financial data from income statements, balance sheets, cash flows, and other critical metrics found in company annual reports.
It also incorporates additional unique features like per-employee data, R&D expenses, and capital expenditures (CapEx), which are typically hidden within dense financial statements of Annual Reports.
---
Key Features and Capabilities
1. Comprehensive Financial Metrics
- "FuTech : Earnings Indicator" offers access to all 269 fundamental metrics available on TradingView platform. This includes widely used data such as revenue, profit margins, and EPS, alongside more niche metrics like R&D expenditure, employee efficiency, and financial scores developed by renowned analysts.
- Users can explore income statement data (e.g., net income, gross profit), balance sheet items (e.g., total assets, liabilities), cash flow metrics, and other financial statistics such as Altman Score, per employee expenses etc. in unparalleled detail.
2. Comparison Across Time Periods
- "FuTech : Earnings Indicator" allows users to analyze data for:
- Quarterly periods (e.g., Q1, Q2, Q3, Q4).
- Yearly comparisons for a broad historical view.
- TTM analysis to observe the most recent trends and developments.
- Users can select a minimum of 4 periods up to an unlimited range for detailed comparisons in both quarter.
3. Dynamic Data Display
- Users can select up to 5 key metrics alongside the stock price column to focus their analysis on the most relevant data points.
- Highlighting with green and red symbols offers an intuitive and visual representation:
- Green : Positive trends or improvements.
- Red : Negative trends or deteriorations.
4. Automated Averages
- "FuTech : Earnings Indicator" automatically calculates averages of selected metrics across the chosen periods. This feature helps users quickly identify performance trends and smooth out anomalies, enabling faster and more reliable research.
5. Designed for Research Excellence
- FuTech serves a wide audience, including:
- Corporate finance professionals who need a deep dive into financial metrics.
- Individual investors seeking robust tools for investment analysis.
- Broking companies and equity research analysts performing stock analysis.
- Traders looking to incorporate fundamental metrics into their strategies.
- Technical analysts seeking a better understanding of price behavior in relation to fundamentals.
- Fundamental research aspirants who want an edge in their learning process.
6. Unmatched Detail for Deeper Insights
- By pulling all 269 Financial metrics from the TradingView, "FuTech : Earnings Indicator" enables:
- Cross-comparison of a stock’s performance with its historical benchmarks.
- Evaluation of rare data like R&D expenses, CapEx trends, and employee efficiency ratios for enhanced investment insights.
- This ensures users can study stocks in greater depth than ever before.
7. Enhanced Usability
- Simple to use and visually appealing, "FuTech : Earnings Indicator" is designed with researchers in mind.
- Its intuitive interface ensures even novice users can navigate the wealth of data without feeling overwhelmed.
Applications of FuTech : Earnings Indicator
FuTech : Earnings Indicator is incredibly versatile and has applications in diverse fields of financial research and trading:
1. Corporate Finance
- Professionals in corporate finance can leverage "FuTech : Earnings Indicator" to benchmark company performance, study efficiency ratios, and evaluate financial health across various metrics.
2. Investors and Traders
- Long-term investors can use the tool to study the fundamental strengths of a stock before making buy-and-hold decisions.
- Traders can incorporate "FuTech : Earnings Indicator" into their analysis to align comprehensive fundamental trends with their targeted technical signals.
3. Equity Research Analysts
- Analysts can streamline their workflows by quickly identifying trends, outliers, and averages across large datasets.
4. Education and Research
- "FuTech : Earnings Indicator" is ideal for students and aspiring financial analysts who want a practical tool for understanding real-world data.
How FuTech : Earnings Indicator Stands Out
1. First-Ever Integration of All Financial Metrics
- It's an exclusive tool which offers the ability to explore all 269 financial metrics available on TradingView for a single stock research in-depth for quarters, years or TTM periods.
2. Period Customization
- Users have complete flexibility to select and analyze data across any range of time periods, allowing for customized insights tailored to specific research goals.
3. Data Visualization
- The intuitive use of color-coded symbols (green for positive trends, red for negative) makes complex data easy to interpret at a glance.
4. Actionable Insights
- The automated average calculations provide actionable insights for making informed decisions without manual computations.
5. Unique Metrics
- Metrics such as research and development costs, CapEx, and per-employee efficiency data offer unique angles that aren’t typically available in traditional analysis tools.
Why to Use FuTech : Earnings Indicator ?
1. Boost Your Research Power
- With FuTech, you can unlock a world of data that gives you the edge in analyzing stocks. Whether you’re a seasoned analyst or a beginner, this tool offers something for everyone.
2. Save Time and Effort
- The automated features and intuitive interface eliminate the need for time-consuming manual calculations and formatting.
3. Make Better Decisions
- "FuTech : Earnings Indicator's" detailed comparison capabilities and insightful visual aids allow for more accurate assessments of a stock’s performance and potential.
4. Broad Appeal
- From individual investors to financial institutions, FuTech is a valuable tool for anyone in the world of finance.
---
Conclusion
- The FuTech : Earnings Indicator is a must-have for anyone serious about financial analysis.
- It combines the depth of all 269 fundamental metrics with intuitive tools for comparison, visualization, and calculation.
- Designed for ease of use and powerful insights, FuTech : Earnings Indicator is set to transform the way financial data is analyzed and understood.
Thank you !
Jai Swaminarayan Dasna Das !
He Hari ! Bas Ek Tu Raji Tha !

Customizable Days Range HighlighterThis Pine Script highlights ranges where consecutive green candles (bullish candles) form a price move within a specified percentage range.
It draws a visual box to represent this move, with the ability to customize both the percentage range and the number of consecutive green candles required to trigger the highlight.
The script calculates the range based on the low to close of the candles, allowing you to focus on the body of the candle (excluding wicks).
Key Features:
Customizable Percentage Range: Set a range (from and to) for the percentage price move between the lowest low and the close of the candle. This enables you to target specific price moves based on your trading strategy.
Consecutive Green Candle Range: Highlight moves only after a specific number of consecutive green candles. You can define the minimum and maximum number of green candles (days) that must be present for the range to be considered valid.
Wick Option: Choose whether to include wicks in the price move calculation or focus purely on the low to close of each green candle (body of the candle).
Visual Highlights: When a valid range is identified, the script draws a green box around the price move and labels it with the calculated percentage move. This helps you visually spot significant bullish price moves.
Parameters:
Percentage Move From: Minimum percentage move between the low and close of the candle for the range to be highlighted.
Percentage Move To: Maximum percentage move for the range to be considered valid.
Minimum and Maximum Green Candles: Set the minimum and maximum number of consecutive green candles (bullish candles) to trigger the range highlight.
Include Wicks: Choose whether to include the candle wicks in the percentage calculation or focus on the body (low to close).
How It Works:
The script tracks consecutive green candles and calculates the range from the low to close of each green candle.
When a valid range is found, where the price move falls within the defined percentage range and the consecutive green candles are within the specified days range, a box is drawn around the price move.
A label is also placed on the chart, showing the percentage move, to help you quickly identify potentially significant price movements.
This tool is ideal for traders who are looking for specific bullish moves over a series of green candles and want to visually identify those opportunities based on price movement and percentage change.
Triple Smoothed Signals [AlgoAlpha]Introducing the Triple Smoothed Signals indicator by AlgoAlpha, a powerful tool designed to help traders identify trend direction and market momentum with greater accuracy. By applying triple smoothing techniques to your chosen data source, this indicator filters out market noise, allowing you to focus on significant price movements. Perfect for traders looking to enhance their technical analysis and gain an edge in the markets.
Key Features
🎨 Customizable Moving Averages : Choose between EMA, SMA, RMA, or WMA for both the triple smoothing and the signal line to tailor the indicator to your trading style.
🛠 Adjustable Smoothing Lengths : Configure the main smoothing length and signal length to fit different timeframes and market conditions.
🌈 Dynamic Color Fills : Visual gradients and fills highlight trend strength and direction, making chart analysis more intuitive.
🔔 Alerts : Set alerts for bullish and bearish crossover signals to stay ahead of market moves without constant chart monitoring.
📈 Clear Signal Visualization : Bullish and bearish signals are plotted directly on your chart for easy interpretation and timely decision-making.
Quick Guide to Using the Triple Smoothed Signals Indicator
🛠 Add the Indicator : Add the indicator to your TradingView chart by clicking on the star icon to add it to your favorites. Customize the settings such as the main smoothing length, signal length, data source, and moving average types to match your trading strategy.
📊 Market Analysis : Monitor the crossovers between the triple smoothed moving average and the signal line. A bullish signal is generated when the signal line crosses under the triple smoothed MA, indicating a potential upward trend. Conversely, a bearish signal occurs when the signal line crosses over the triple smoothed MA, suggesting a possible downward trend.
🔔 Alerts : Enable notifications for reversal signals and trend shifts to stay informed about market movements without constantly monitoring the chart.
How It Works
The Triple Smoothed Signals indicator enhances trend detection by applying a triple smoothing process to your selected data source using the moving average type of your choice (EMA, SMA, RMA, or WMA). This triple smoothed moving average (v1) effectively reduces short-term fluctuations and noise, revealing the underlying market trend. A signal line (v2) is then calculated by smoothing the triple smoothed MA with a separate moving average, further refining the signal. The indicator calculates the normalized distance between the triple smoothed MA and the signal line over a specified period, which is used to create dynamic color gradients and fills on the chart. These visual elements provide immediate insight into trend strength and direction. Bullish and bearish signals are generated based on the crossovers between the signal line and the triple smoothed MA, and are plotted directly on the chart along with customizable alerts to assist traders in making timely decisions.
4-Hour Moving AveragesTitle: 4-Hour Moving Averages Indicator
Description:
The "4-Hour Moving Averages" indicator is designed to help traders easily visualize key moving averages derived from the 4-hour timeframe, regardless of the chart interval they are using. This indicator plots four moving averages: a 15-period SMA (Short-Term), a 35-period SMA (Intermediate-Term), an 80-period SMA (Long-Term), and a 130-period SMA (Confirmation).
These moving averages provide a balanced approach for identifying short, medium, and long-term trends, as well as confirming significant market movements. Ideal for swing traders and those looking for clear trend signals, the indicator can be used for various markets, including stocks, forex, and cryptocurrencies.
The 4-hour moving averages overlay directly on the price chart, allowing for easy analysis of current price movements relative to important trend indicators. Use this script to enhance your trading decisions, identify opportunities, and avoid market traps by relying on consistent moving average trends.
Features:
- 15 SMA for Short-Term Trends (in red)
- 35 SMA for Intermediate-Term Trends (in orange)
- 80 SMA for Long-Term Trends (in green)
- 130 SMA for Confirmation (in blue)
Feel free to modify the settings to suit your specific strategy and market conditions.

Reversal Signals [AlgoAlpha]📈🔄 Reversal Signals – Master Market Reversals with Precision! 🚀✨
Elevate your trading strategy with the Reversal Signals indicator by AlgoAlpha. This advanced tool is designed to pinpoint potential bullish and bearish reversals by analyzing price action and, optionally, volume confirmations. It seamlessly combines reversal detection with trend analysis, giving you a comprehensive view of market dynamics to make informed trading decisions.
Key Features
🔎 Price Action Reversal Detection : Identifies potential reversal points by comparing current price movements against historical candle patterns within a customizable lookback period.
📊 Volume Confirmation : Optionally integrates volume analysis to confirm the strength of reversal signals, enhancing their reliability.
📈 Stepped Moving Average Trend Indicator : Employs a stepped moving average that adjusts at set intervals to reflect underlying market trends.
⚙️ Customizable Settings : Tailor the indicator to your trading style with adjustable parameters for lookback periods, confirmation windows, moving average types, and more.
🎨 Visual Signals and Trend Coloring : Clear on-chart labels for reversal signals and color-coded trend areas to quickly identify bullish and bearish conditions.
🔔 Alerts for Key Market Events : Set up custom alerts for reversal signals and trend shifts to stay ahead of market movements.
Quick Guide to Using the Reversal Signals Indicator :
🛠 Add the Indicator : Add the indicator to your favorites by pressing the star icon. Customize settings like Candle Lookback, Confirm Within, and Use Volume Confirmation to fit your trading style.
📊 Market Analysis : Observe the "𝓡" labels on the chart indicating bullish and bearish reversal signals. Look for labels below the bars for bullish signals and above the bars for bearish signals. Use the color-filled areas between the stepped moving average and the center line to assess market trends.
🔔 Alerts : Enable notifications for reversal signals and trend shifts to stay informed about market movements without constantly monitoring the chart.
How It Works
The Reversal Signals indicator operates by conducting a thorough analysis of price action over a user-defined lookback period. For a bullish reversal, the indicator checks if the current closing price is lower than the lows of the preceding candles within the lookback window, suggesting a potential oversold condition. If this criterion is met, it marks the candle as a potential reversal point and waits for confirmation within a specified number of subsequent candles. Confirmation occurs when the price rises above the high of the identified candle, signaling a bullish reversal. An optional volume confirmation can be enabled to ensure that the reversal is supported by higher-than-average trading volume, adding an extra layer of validation to the signal. The process is mirrored for bearish reversals, where the indicator looks for the closing price exceeding previous highs and awaits confirmation of a downward move.
Complementing the reversal signals, the indicator features a stepped moving average that serves as a dynamic trend indicator. This moving average updates at intervals defined by the MA Step Period and shifts direction based on price crossings. If the price remains above the stepped MA, it indicates a bullish trend, coloring the area between the MA and the center line in green. Conversely, if the price falls below the stepped MA, a bearish trend is signaled, and the area is shaded red. This visual representation helps traders quickly assess the prevailing market trend and align their trading decisions accordingly.
Experience a new level of market insight with the Reversal Signals indicator. Add it to your TradingView chart today and enhance your ability to detect and act on key ma

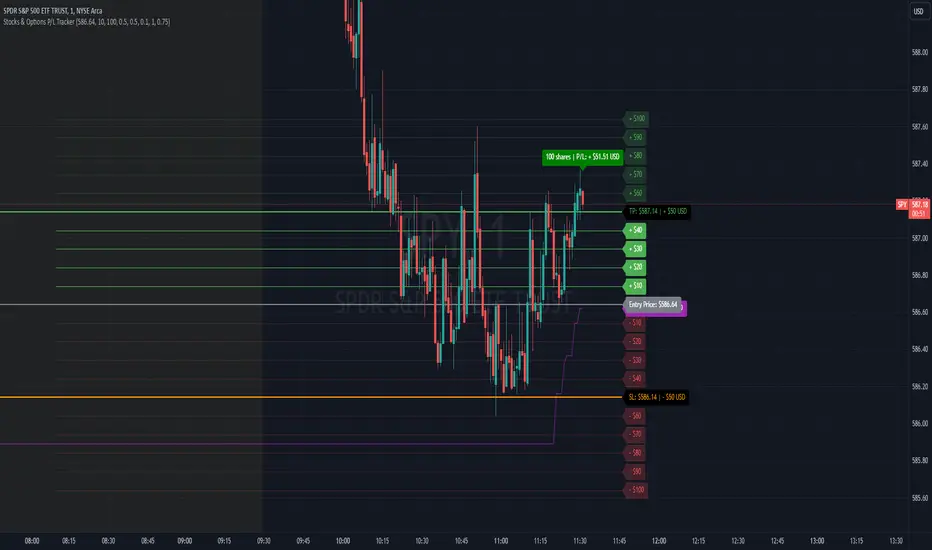
Stocks & Options P/L TrackerOverview:
The Stocks & Options P/L Tracker is a custom TradingView indicator developed to offer traders precise tracking of stocks & options trades’ profit and loss in real-time. It features a detailed display of P/L intervals, stop-loss and take-profit levels, and an adaptable trailing stop mechanism to help traders manage risk and optimize their trading strategies. This tool is particularly useful for active traders who seek immediate visual feedback on their trades’ performance.
Key Features:
Real-Time P/L Display: Computes and displays the P/L per contract/share and total P/L dynamically on the chart based on the specified entry price, relative to the current market price, and number of contracts or shares.
Configurable Take Profit and Stop Loss: Users can set take-profit and stop-loss amounts, and the indicator will visually mark these levels with corresponding dollar amounts for easy reference.
Trailing Stop Functionality: Offers an option to enable a trailing stop that automatically adjusts based on price movements.
Interval-Based P/L Tracking: Uses customizable intervals to display projected P/L levels above and below the entry price, helping users understand potential profit or loss scenarios at a glance.
Dynamic Labeling and Alerts: Visual labels are used to mark P/L, take-profit, stop-loss, trailing stop, and entry levels. These labels update dynamically on each new price bar to provide immediate insights into trade performance. NOTE: Due to TradingView's limitations with server-side alerts on fixed prices, dynamic alerts (for Take Profit, Stop Loss, and Trailing Stop) that adjust with price changes are not yet available. Alerts must be manually reset to your desired price each time.
Clean and Responsive Design: Utilizes color-coded labels and lines for P/L intervals, making it easy to distinguish profit, loss, stop, and take-profit zones. Colors adjust automatically to the current price to maintain clarity.
User Input Validation: Ensures appropriate input values for items like entry price, contract/share size, and profit/loss intervals to prevent errors and optimize performance.
Efficient Object Management: Implements object reusability for lines and labels to stay within Pine Script's object limits, ensuring smooth operation and maximum accuracy in real-time tracking.
Automatic Adjustments Based on Market Changes: Calculates and adjusts trailing stop levels dynamically based on highest price movement, which provides traders flexibility while maintaining risk controls.
Trader Benefits:
This indicator empowers traders with a robust tool to manage their trades visually and strategically on TradingView. The real-time feedback and customization options help traders make informed decisions, minimize risks, and maximize potential profits.
Happy Trading! :)
Half Trend Regression [AlgoAlpha]Introducing the Half Trend Regression indicator by AlgoAlpha, a cutting-edge tool designed to provide traders with precise trend detection and reversal signals. This indicator uniquely combines linear regression analysis with ATR-based channel offsets to deliver a dynamic view of market trends. Ideal for traders looking to integrate statistical methods into their analysis to improve trade timing and decision-making.
Key Features
🎨 Customizable Appearance : Adjust colors for bullish (green) and bearish (red) trends to match your charting preferences.
🔧 Flexible Parameters : Configure amplitude, channel deviation, and linear regression length to tailor the indicator to different time frames and trading styles.
📈 Dynamic Trend Line : Utilizes linear regression of high, low, and close prices to calculate a trend line that adapts to market movements.
🚀 Trend Direction Signals : Provides clear visual signals for potential trend reversals with plotted arrows on the chart.
📊 Adaptive Channels : Incorporates ATR-based channel offsets to account for market volatility and highlight potential support and resistance zones.
🔔 Alerts : Set up alerts for bullish or bearish trend changes to stay informed of market shifts in real-time.
How to Use
🛠 Add the Indicator : Add the Half Trend Regression indicator to your chart from the TradingView library. Access the settings to customize parameters such as amplitude, channel deviation, and linear regression length to suit your trading strategy.
📊 Analyze the Trend : Observe the plotted trend line and the filled areas under it. A green fill indicates a bullish trend, while a red fill indicates a bearish trend.
🔔 Set Alerts : Use the built-in alert conditions to receive notifications when a trend reversal is detected, allowing you to react promptly to market changes.
How It Works
The Half Trend Regression indicator calculates linear regression lines for the high, low, and close prices over a specified period to determine the general direction of the market. It then computes moving averages and identifies the highest and lowest points within these regression lines to establish a dynamic trend line. The trend direction is determined by comparing the moving averages and previous price levels, updating as new data becomes available. To account for market volatility, the indicator calculates channels above and below the trend line, offset by a multiple of half the Average True Range (ATR). These channels help visualize potential support and resistance zones. The area under the trend line is filled with color corresponding to the current trend direction—green for bullish and red for bearish. When the trend direction changes, the indicator plots arrows on the chart to signal a potential reversal, and alerts can be set up to notify you. By integrating linear regression and ATR-based channels, the indicator provides a comprehensive view of market trends and potential reversal points, aiding traders in making informed decisions.
Enhance your trading strategy with the Half Trend Regression indicator by AlgoAlpha and gain a statistical edge in the markets! 🌟📊
Dynamic Market Correlation Analyzer (DMCA) v1.0Description
The Dynamic Market Correlation Analyzer (DMCA) is an advanced TradingView indicator designed to provide real-time correlation analysis between multiple assets. It offers a comprehensive view of market relationships through correlation coefficients, technical indicators, and visual representations.
Key Features
- Multi-asset correlation tracking (up to 5 symbols)
- Dynamic correlation strength categorization
- Integrated technical indicators (RSI, MACD, DX)
- Customizable visualization options
- Real-time price change monitoring
- Flexible timeframe selection
## Use Cases
1. **Portfolio Diversification**
- Identify highly correlated assets to avoid concentration risk
- Find negatively correlated assets for hedging strategies
- Monitor correlation changes during market events
2. Pairs Trading
- Detect correlation breakdowns for potential trading opportunities
- Track correlation strength for pair selection
- Monitor technical indicators for trade timing
3. Risk Management
- Assess portfolio correlation risk in real-time
- Monitor correlation shifts during market stress
- Identify potential portfolio vulnerabilities
4. **Market Analysis**
- Study sector relationships and rotations
- Analyze cross-asset correlations (e.g., stocks vs. commodities)
- Track market regime changes through correlation patterns
Components
Input Parameters
- **Timeframe**: Custom timeframe selection for analysis
- **Length**: Correlation calculation period (default: 20)
- **Source**: Price data source selection
- **Symbol Selection**: Up to 5 customizable symbols
- **Display Options**: Table position, text color, and size settings
Technical Indicators
1. **Correlation Coefficient**
- Range: -1 to +1
- Strength categories: Strong/Moderate/Weak (Positive/Negative)
2. **RSI (Relative Strength Index)**
- 14-period default setting
- Momentum comparison across assets
3. **MACD (Moving Average Convergence Divergence)**
- Standard settings (12, 26, 9)
- Trend direction indicator
4. **DX (Directional Index)**
- Trend strength measurement
- Based on DMI calculations
Visual Components
1. **Correlation Table**
- Symbol identifiers
- Correlation coefficients
- Correlation strength descriptions
- Price change percentages
- Technical indicator values
2. **Correlation Plot**
- Real-time correlation visualization
- Multiple correlation lines
- Reference levels at -1, 0, and +1
- Color-coded for easy identification
Installation and Setup
1. Load the indicator on TradingView
2. Configure desired symbols (up to 5)
3. Adjust timeframe and calculation length
4. Customize display settings
5. Enable/disable desired components (table, plot, RSI)
Best Practices
1. **Symbol Selection**
- Choose related but distinct assets
- Include a mix of asset classes
- Consider market cap and liquidity
2. **Timeframe Selection**
- Match timeframe to trading strategy
- Consider longer timeframes for strategic analysis
- Use shorter timeframes for tactical decisions
3. **Interpretation**
- Monitor correlation changes over time
- Consider multiple timeframes
- Combine with other technical analysis tools
- Account for market conditions and volatility
Performance Notes
- Calculations update in real-time
- Resource usage scales with number of active symbols
- Historical data availability may affect initial calculations
Version History
- v1.0: Initial release with core functionality
- Multi-symbol correlation analysis
- Technical indicator integration
- Customizable display options
Future Enhancements (Planned)
- Additional technical indicators
- Advanced correlation algorithms
- Enhanced visualization options
- Custom alert conditions
- Statistical significance testing

Trade 1 + StatergyThe Relative Strength Index (RSI) is a momentum oscillator used in technical analysis that measures the speed and change of price movements of a security within a range of 0 to 100. It is most commonly set to a 14-period timeframe and helps traders identify overbought or oversold conditions, suggesting potential reversal points in the market. Divergence occurs when the price trend and the RSI trend move in opposite directions. A bullish divergence signals potential upward movement when prices are making new lows while the RSI makes higher lows. Conversely, a bearish divergence suggests a possible downward trend when prices are making new highs but the RSI is making lower highs. These signals are crucial for traders looking to capture shifts in momentum and adjust their trading strategies accordingly.
use full to
5 min
10 min
15 min decition
FibExtender [tradeviZion]FibExtender : A Guide to Identifying Resistance with Fibonacci Levels
Introduction
Fibonacci levels are essential tools in technical analysis, helping traders identify potential resistance and support zones in trending markets. FibExtender is designed to make this analysis accessible to traders at all levels, especially beginners, by automating the process of plotting Fibonacci extensions. With FibExtender, you can visualize potential resistance levels quickly, empowering you to make more informed trading decisions without manually identifying every pivot point. In this article, we’ll explore how FibExtender works, guide you step-by-step in using it, and share insights for both beginner and advanced users.
What is FibExtender ?
FibExtender is an advanced tool that automates Fibonacci extension plotting based on significant pivot points in price movements. Fibonacci extensions are percentages based on prior price swings, often used to forecast potential resistance zones where price might reverse or consolidate. By automatically marking these Fibonacci levels on your chart, FibExtender saves time and reduces the complexity of technical analysis, especially for users unfamiliar with calculating and plotting these levels manually.
FibExtender not only identifies Fibonacci levels but also provides a customizable framework where you can adjust anchor points, colors, and level visibility to suit your trading strategy. This customization allows traders to tailor the indicator to fit different market conditions and personal preferences.
Key Features of FibExtender
FibExtender offers several features to make Fibonacci level analysis easier and more effective. Here are some highlights:
Automated Fibonacci Level Identification : The script automatically detects recent swing lows and pivot points to anchor Fibonacci extensions, allowing you to view potential resistance levels with minimal effort.
Customizable Fibonacci Levels : Users can adjust the specific Fibonacci levels they want to display (e.g., 0.618, 1.0, 1.618), enabling a more focused analysis based on preferred ratios. Each level can be color-coded for visual clarity.
Dual Anchor Points : FibExtender allows you to choose between anchoring levels from either the last pivot low or a recent swing low, depending on your preference. This flexibility helps in aligning Fibonacci levels with key market structures.
Transparency and Visual Hierarchy : FibExtender automatically adjusts the transparency of levels based on their "sequence age," creating a subtle visual hierarchy. Older levels appear slightly faded, helping you focus on more recent, potentially impactful levels.
Connection Lines for Context : FibExtender draws connecting lines from recent lows to pivot highs, allowing users to visualize the price movements that generated each Fibonacci extension level.
Step-by-Step Guide for Beginners
Let’s walk through how to use the FibExtender script on a TradingView chart. This guide will ensure that you’re able to set it up and interpret the key information displayed by the indicator.
Step 1: Adding FibExtender to Your Chart
Open your TradingView chart and select the asset you wish to analyze.
Search for “FibExtender ” in the Indicators section.
Click to add the indicator to your chart, and it will automatically plot Fibonacci levels based on recent pivot points.
Step 2: Customizing Fibonacci Levels
Adjust Levels : Under the "Fibonacci Settings" tab, you can enable or disable specific levels, such as 0.618, 1.0, or 1.618. You can also change the color for each level to improve visibility.
Set Anchor Points : Choose between "Last Pivot Low" and "Recent Swing Low" as your Fibonacci anchor point. If you want a broader view, choose "Recent Swing Low"; if you prefer tighter levels, "Last Pivot Low" may be more suitable.
Fib Line Length : Modify the line length for Fibonacci levels to make them more visible on your chart.
Step 3: Spotting Visual Clusters (Manual Analysis)
Identify Potential Resistance Clusters : Look for areas on your chart where multiple Fibonacci levels appear close together. For example, if you see 1.0, 1.272, and 1.618 levels clustered within a small price range, this may indicate a stronger resistance zone.
Why Clusters Matter : Visual clusters often signify areas where traders expect heightened price reaction. When levels are close, it suggests that resistance may be reinforced by multiple significant ratios, making it harder for price to break through. Use these clusters to anticipate potential pullbacks or consolidation areas.
Step 4: Observing the Price Action Around Fibonacci Levels
As price approaches these identified levels, watch for any slowing momentum or reversal patterns, such as doji candles or bearish engulfing formations, that might confirm resistance.
Adjust Strategy Based on Resistance : If price hesitates or reverses at a clustered resistance zone, it may be a signal to secure profits or tighten stops on a long position.
Advanced Insights (for Intermediate to Advanced Users)
For users interested in the technical workings of FibExtender, this section provides insights into how the indicator functions on a code level.
Pivot Point and Swing Detection
FibExtender uses a pivot-high and pivot-low detection function to identify significant price points. The upFractal and dnFractal variables detect these levels based on recent highs and lows, creating the basis for Fibonacci extension calculations. Here’s an example of the code used for this detection:
// Fractal Calculations
upFractal = ta.pivothigh(n, n)
dnFractal = ta.pivotlow(n, n)
By setting the number of periods for n, users can adjust the sensitivity of the script to recent price swings.
Fibonacci Level Calculation
The following function calculates the Fibonacci levels based on the selected pivot points and applies each level’s specific ratio (e.g., 0.618, 1.618) to project extensions above the recent price swing.
calculateFibExtensions(float startPrice, float highPrice, float retracePrice) =>
fibRange = highPrice - startPrice
var float levels = array.new_float(0)
array.clear(levels)
if array.size(fibLevels) > 0
for i = 0 to array.size(fibLevels) - 1
level = retracePrice + (fibRange * array.get(fibLevels, i))
array.push(levels, level)
levels
This function iterates over each level enabled by the user, calculating extensions by multiplying the price range by the corresponding Fibonacci ratio.
Example Use Case: Identifying Resistance in Microsoft (MSFT)
To better understand how FibExtender highlights resistance, let’s look at Microsoft’s stock chart (MSFT), as shown in the image. The chart displays several Fibonacci levels extending upward from a recent pivot low around $408.17. Here’s how you can interpret the chart:
Clustered Resistance Levels : In the chart, note the grouping of several Fibonacci levels in the range of $450–$470. These levels, particularly when tightly packed, suggest a zone where Microsoft may encounter stronger resistance, as multiple Fibonacci levels signal potential barriers.
Applying Trading Strategies : As price approaches this clustered resistance, traders can watch for weakening momentum. If price begins to stall, it may be wise to lock in profits on long positions or set tighter stop-loss orders.
Observing Momentum Reversals : Look for specific candlestick patterns as price nears these levels, such as bearish engulfing candles or doji patterns. Such patterns can confirm resistance, helping you make informed decisions on whether to exit or manage your position.
Conclusion: Harnessing Fibonacci Extensions with FibExtender
FibExtender is a powerful tool for identifying potential resistance levels without the need for manual Fibonacci calculations. It automates the detection of key swing points and projects Fibonacci extensions, offering traders a straightforward approach to spotting potential resistance zones. For beginners, FibExtender provides a user-friendly gateway to technical analysis, helping you visualize levels where price may react.
For those with a bit more experience, the indicator offers insight into pivot points and Fibonacci calculations, enabling you to fine-tune the analysis for different market conditions. By carefully observing price reactions around clustered levels, users can identify areas of stronger resistance and refine their trade management strategies accordingly.
FibExtender is not just a tool but a framework for disciplined analysis. Using Fibonacci levels for guidance can support your trading decisions, helping you recognize areas where price might struggle or reverse. Integrating FibExtender into your trading strategy can simplify the complexity of Fibonacci extensions and enhance your understanding of resistance dynamics.
Note: Always practice proper risk management and thoroughly test the indicator to ensure it aligns with your trading strategy. Past performance is not indicative of future results.
Trade smarter with TradeVizion—unlock your trading potential today!

TechniTrend: Trend and Volume Indicator🟪 Overview
The "TechniTrend: Trend and Volume Indicator" is designed to assist traders in identifying optimal entry and exit points in the market by combining trend detection and volume analysis. This indicator integrates moving average-based trend recognition with volume threshold analysis to provide clear buy and sell signals. Additionally, it includes divergence filtering and correlation analysis to enhance the accuracy of signals, making it suitable for traders who want to identify strong trends and high-probability trading opportunities.
🟪 Indicator Components
🔹Trend Moving Average (MA):
The indicator calculates a moving average based on the closing prices to identify the overall trend. Various moving average types are available for customization:
Simple Moving Average (SMA)
Exponential Moving Average (EMA)
Weighted Moving Average (WMA)
Hull Moving Average (HMA)
The length of the moving average can be adjusted via the Trend MA Length input to adapt to different market conditions.
🔹Volume Analysis:
A volume moving average is calculated over a specified period (Volume MA Length), with a volume threshold derived by multiplying this average by a user-defined Volume Threshold Factor.
This threshold helps to classify volume as either high or low, which plays a crucial role in signal generation.
🔹Divergence Detection:
The indicator can filter out signals when there is a divergence between the price movement and volume changes. Divergence occurs when the price moves in one direction while the volume moves in the opposite direction, indicating a potential weakening of the trend.
🔹Correlation Analysis:
The correlation between price and volume changes is calculated over the same length as the trend moving average. The user can enable this filter to ensure that buy or sell signals are only generated when the correlation exceeds a specified threshold (Correlation Threshold).
🟪 Signals and Alerts
🔹Buy Signal: Generated when the price is above the trend moving average (indicating an uptrend), and the current volume exceeds the volume threshold (indicating high volume). The signal can be filtered based on divergence or correlation settings.
🔹Sell Signal: Triggered when the price is below the trend moving average (indicating a downtrend), and the volume is above the threshold. Similarly, the signal is affected by divergence and correlation filters.
🔹Visual Indicators:
The trend line is plotted on the chart for easy trend identification.
Buy and sell signals are displayed using green and red labels, respectively.
Background highlighting is used to mark areas of high volume on the chart.
🟪 Customizable Inputs
🔹Trend MA Length: Adjusts the moving average length used to detect trends.
🔹Volume MA Length: Sets the length for the volume moving average calculation.
🔹MA Type for Trend: Select the type of moving average for trend detection (SMA, EMA, WMA, HMA).
🔹Volume Threshold Factor: Multiplier used to define high-volume conditions based on the volume moving average.
🔹Enable Divergence Filter: Allows the user to filter out signals where divergence between price and volume is detected.
🔹Enable Correlation Filter: Enables filtering of signals based on the correlation between price and volume changes.
🔹Correlation Threshold: Sets the minimum correlation value required for a signal to be considered valid.
🟪 Alerts
The indicator provides alert conditions for buy and sell signals, allowing traders to receive notifications when new trading opportunities arise.
🟪 Usage Tips
🔹Adjust Moving Average Lengths: Shorter lengths can make the indicator more sensitive to recent market changes, while longer lengths provide a smoother, more reliable trend signal.
🔹Volume Threshold Factor: Increasing this factor raises the volume required to generate high-volume signals, which can help filter.
🟪 Disclaimer:
The "TechniTrend: Trend and Volume Indicator" is a technical analysis tool intended for educational and informational purposes only. It is not a guarantee of future performance or a recommendation to buy, sell, or hold any financial instrument. Trading involves significant risk, and past performance is not indicative of future results. Users should conduct their own research and seek advice from a qualified financial professional before making any investment decisions. The creators of this indicator are not liable for any financial losses or damages incurred through its use.
