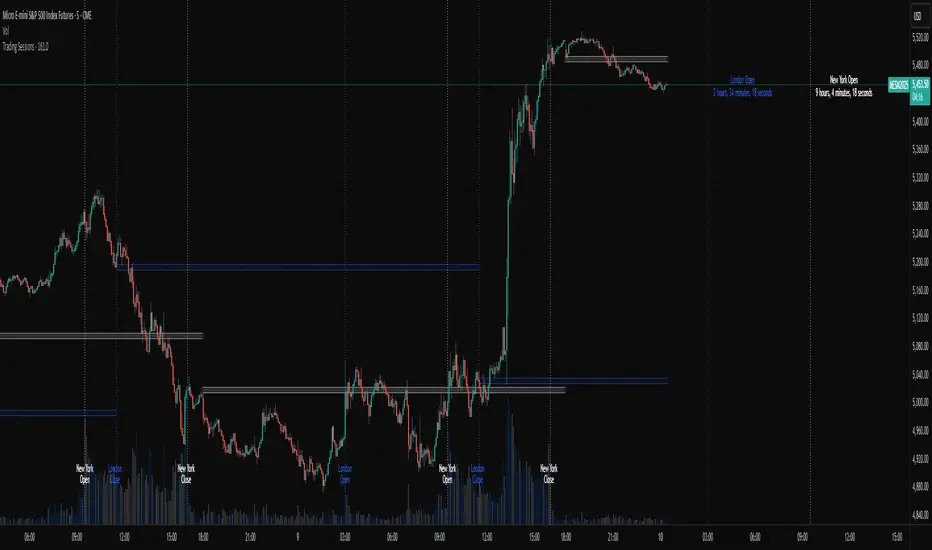
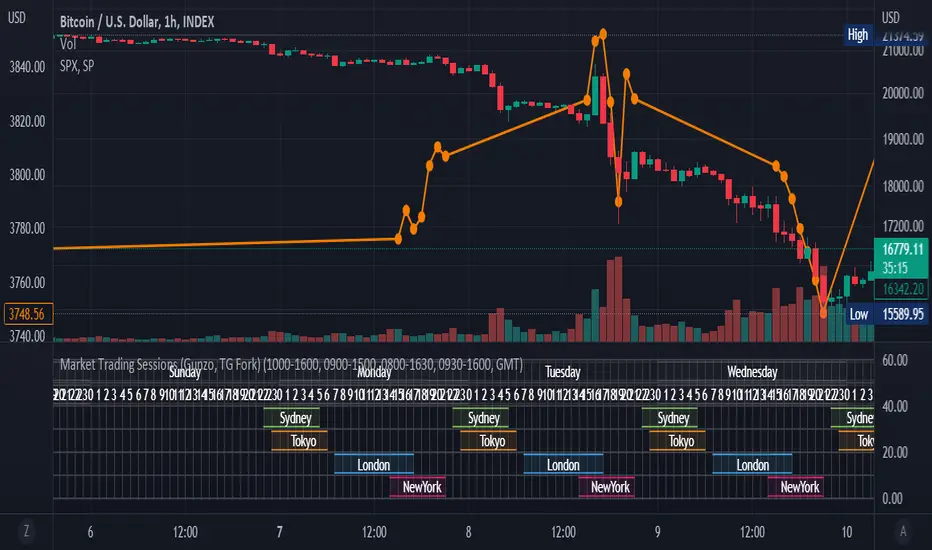
Time SessionTime Session is a lightweight indicator to visually highlight up to 3 trading time windows on any chart. It’s built to help you verify sessions precisely (especially when TradingView timezones/session handling can be confusing).
Key Features
3 independent session slots (enable/disable each slot)
Global timezone mode:
EXCHANGE : uses the symbol’s exchange timezone (recommended in most cases)
CUSTOM : use your own timezone string, copy the timezone label shown on your chart (bottom-right corner) and paste it into the CUSTOM field.
Example: `UTC+1`, `UTC+2`, `UTC-5`, etc.
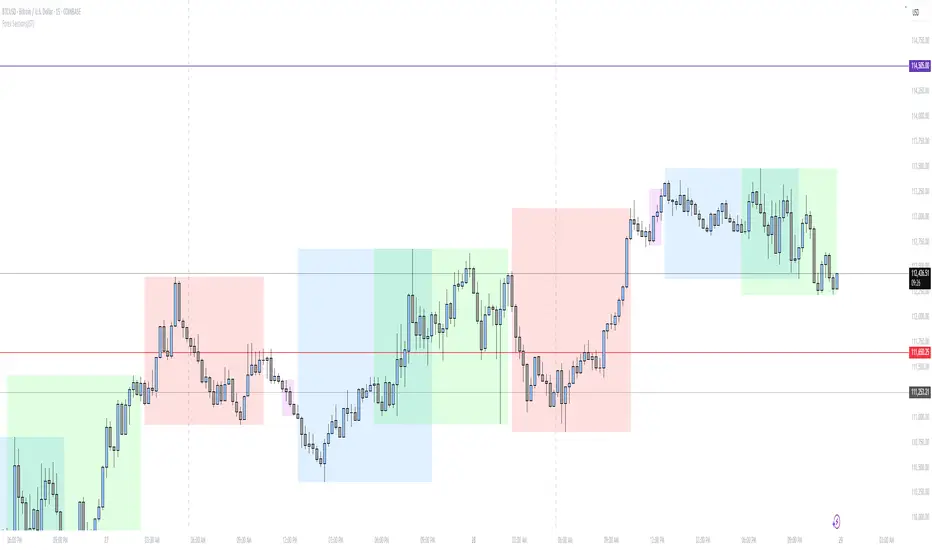
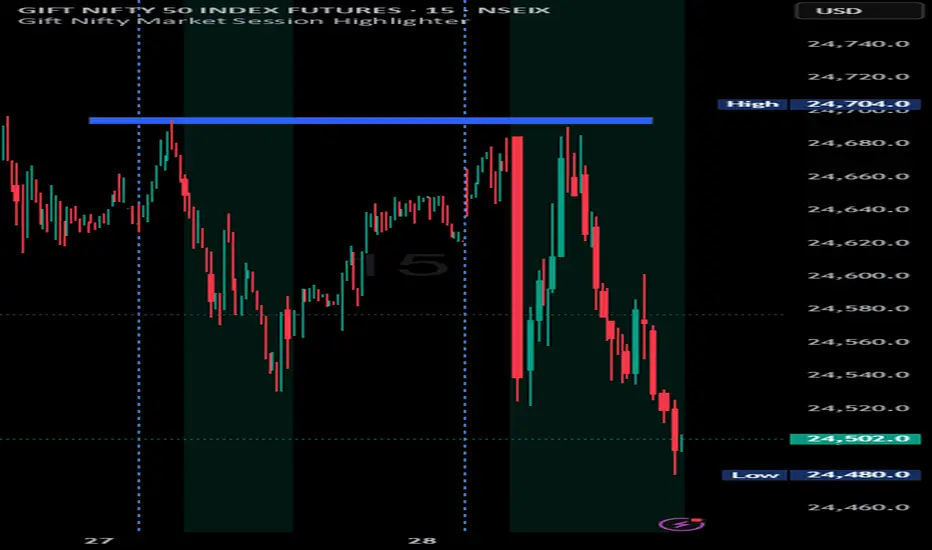
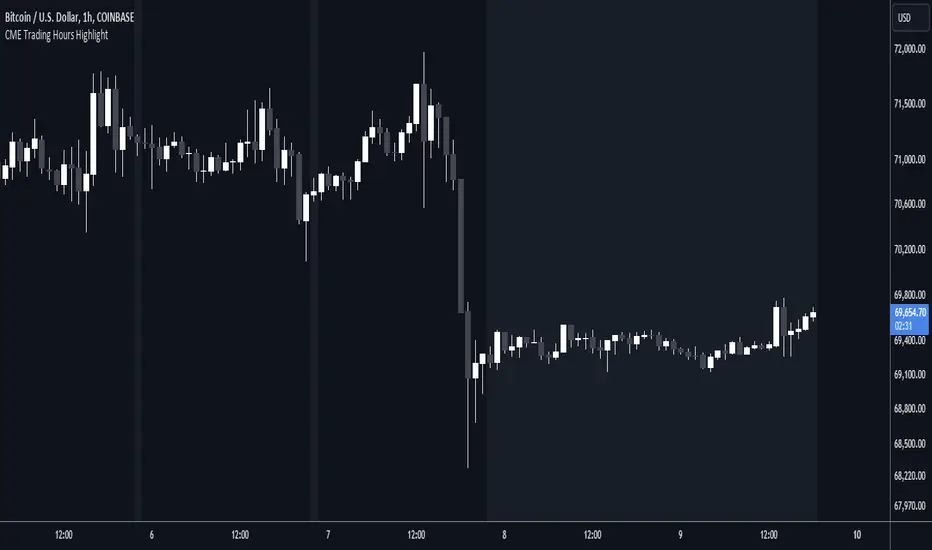
Background highlighting for each slot (custom color + transparency)
Start/End markers at the bottom of the chart:
S1 = Slot 1 Start , E1 = Slot 1 End
S2 = Slot 2 Start , E2 = Slot 2 End
S3 = Slot 3 Start , E3 = Slot 3 End
Data Window debug : `inSlot1`, `inSlot2`, `inSlot3`, `inAny`
How to Use
1. Add the indicator to your chart.
2. Set Timezone Mode to EXCHANGE or CUSTOM .
3. If CUSTOM , paste the chart timezone label (e.g., `UTC+1`)
4. Configure Session Slot 1/2/3 using `HHMM-HHMM` (example: `07:00-18:00`).
5. Use the highlighted background and **S/E markers** to confirm the exact hours.
Good Trading
Indicatore Pine Script®