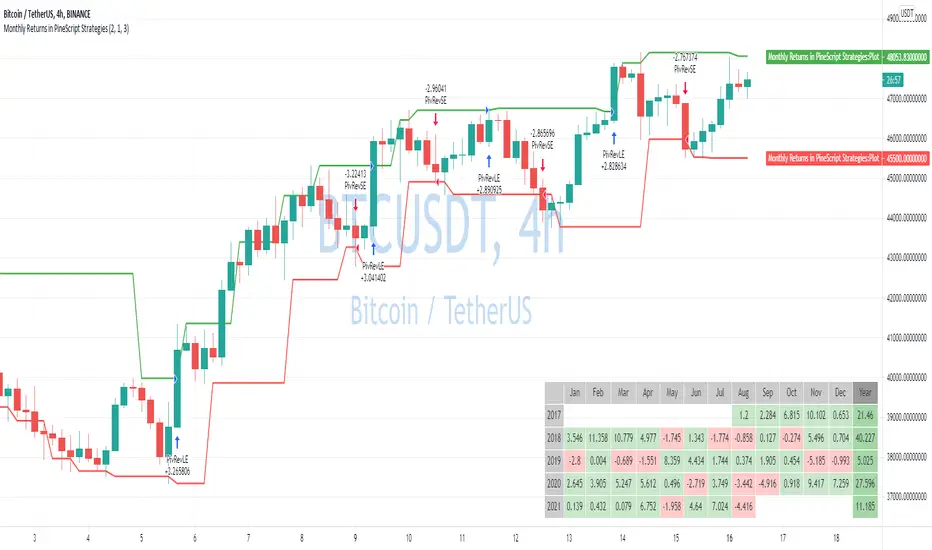
Monthly Returns in PineScript StrategiesI'm not 100% satisfied with the strategy performance output I receive from TradingView. Quite often I want to see something that is not available by default. I usually export raw trades/metrics from TradingView and then do additional analysis manually.
But with tables, you can build additional metrics and tools for your strategies quite easily.
This script will just show a table with monthly/yearly performance of your script. Quite a lot of traders/investors used to look at returns like that. Also, it might help you to identify periods of time when your strategy performed good/bad than expected and try to analyze that better.
The script is very simple and I believe you can easily apply it to your own strategies.
Disclaimer
Please remember that past performance may not be indicative of future results.
Due to various factors, including changing market conditions, the strategy may no longer perform as well as in historical backtesting.
This post and the script don’t provide any financial advice.
Tools
Vertical line by bar_indexThis indicator helps in letting the trader focus on a particular date/candle across many symbols.
Tradingview currently has a bug in Bar Replay - when we switch symbols, the bar replay resets.
Hence if you are backtesting & running through a bunch of symbols, it is nearly impossible to focus on a particular historical candle across all symbols.
This indicator plots a vertical line on a given bar_index which remains as it is while you are switching symbols.
Feel free to copy, modify and use as you like!

Breadth Indicator : RVC-BNifty-Adv-Dec-LineBreadth Indicators
Summary : Script calculates Advance and Declain value based on weightage of each Bank share in BankNifty Index
Bank NIfty is not an asset and it does not have value.
It is composition based on multiple bank stocks with different weightage.
This tool display the indicator based on "Number of Stocks Moving on UP TICK" and "Number of Stocks Moving on DOWN TICK"
Currently this calculation is based on 12 stocks based on their weightage.
Axis Bank , Bank of Baroda
Federal Bank, HDFC Bank
ICICI Bank, IDFC Bank Ltd.
IndusInd Bank, Kotak Mahindra Bank
Punjab National Bank , RBL Bank
State Bank of India (SBI), Yes Bank

Data Source Crement AlertsSet DIfferent sources of the data you want
Set the levels for the alert
Sell is Crossing down on the higher and buy is crossing over the lower level
💧Klondike Watermarking Tool by Cryptorhythms💦Klondike Group Watermarking Tool by Cryptorhythms
👋Heirophant and the Cryptorhythms Team here with a script that is sorely needed....
💭I got to thinking about how so many scammers on telegram and other media reuse other peoples charts and analysis (sometimes selling them). I find the whole scheme repugnant. Consequently I wanted to help legitimate groups keep their intellectual property ownership and brand integrity.
👮This is for Chartists and Signals Groups both Public and Private. It helps to prevent copiers from stealing/reposting charts & signals. It watermarks the chart with an ascii art drawing.
There will be many groups to get one of these! Please dont ask for access as this is for their admins only.
But dont despair - there will be a public library watermarking script with a ton of funny trading memes in it for you to mess around with (estimated release in a week or so - just adding more watermarks).
💬 If your group is interested in a custom watermark, contact me and let me know! (They are free!)
🖖Happy Trading!

💦Gunbot Watermarking Tool by Cryptorhythms💦GunbotGroup Watermarking Tool by Cryptorhythms
👋Heirophant and the Cryptorhythms Team here with a script that is sorely needed....
💭I got to thinking about how so many scammers on telegram and other media reuse other peoples charts and analysis (sometimes selling them). I find the whole scheme repugnant. Consequently I wanted to help legitimate groups keep their intellectual property ownership and brand integrity.
👮This is for Chartists and Signals Groups both Public and Private. It helps to prevent copiers from stealing/reposting charts & signals. It watermarks the chart with an ascii art drawing.
There will be many groups to get one of these! Please dont ask for access as this is for their admins only.
But dont despair - there will be a public library watermarking script with a ton of funny trading memes in it for you to mess around with (estimated release in a week or so - just adding more watermarks).
💬 If your group is interested in a custom watermark, contact me and let me know! (They are free!)
🖖Happy Trading!

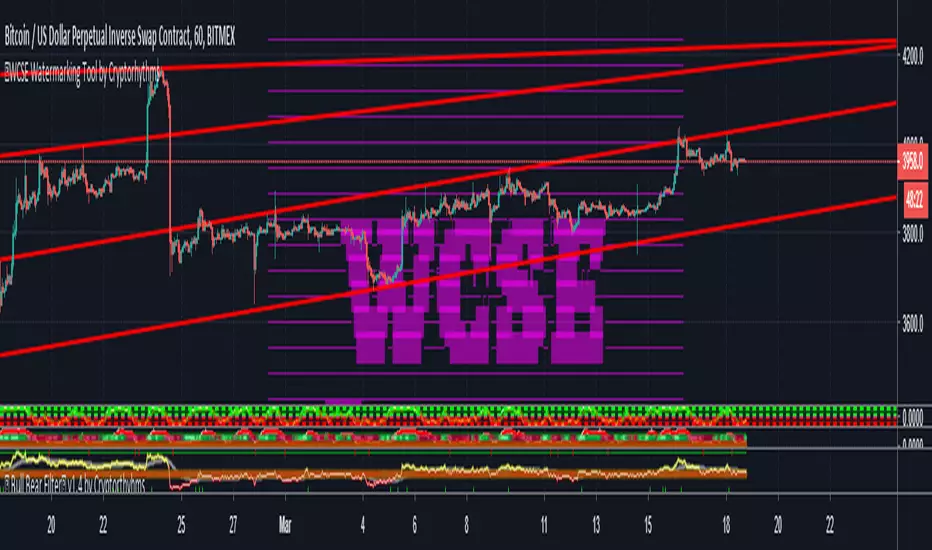
💧WCSE Watermarking Tool by Cryptorhythms💦WCSE Group Watermarking Tool by Cryptorhythms
👋Heirophant and the Cryptorhythms Team here with a script that is sorely needed....
💭I got to thinking about how so many scammers on telegram and other media reuse other peoples charts and analysis (sometimes selling them). I find the whole scheme repugnant. Consequently I wanted to help legitimate groups keep their intellectual property ownership and brand integrity.
👮This is for Chartists and Signals Groups both Public and Private. It helps to prevent copiers from stealing/reposting charts & signals. It watermarks the chart with an ascii art drawing.
WCSE is the first of many groups to get one of these! Please dont ask for access as this is for their admins only.
But dont despair - there will be a public library watermarking script with a ton of funny trading memes in it for you to mess around with (estimated release in a week or so - just adding more watermarks).
💬 If your group is interested in a custom watermark, contact me and let me know! (They are free!)
If you follow/subscribe to me, I apologize for any spam. Please dont unfollow, after this weekend there will be much less script publication spam.
🖖Happy Trading & Live Long and Prosper!
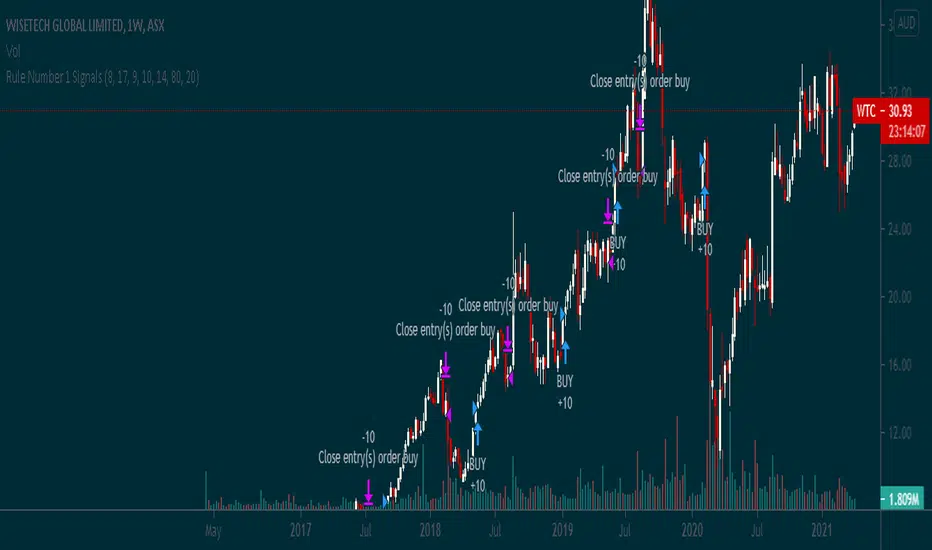
Rule Number 1 SignalsThis script takes the Rule #1 3 tools and plots them on the graph, to provide an additional level of indication for when to sell and when to buy.
cooltoyz: shadow candlesAnother tool for the cooltoyz series :)
tired of having to look at multiple time frames for a ticker, and having to mentally mix them to try to guess/visualize trends, or support/resistance levels? so was i, and with this tool i let the chart do the heavy lifting :)
with this, upper time frames are visualized as shadows imposed on the chart itself. there are two levels:
level 1 - represented with strong green/red for candle body, and a thin line for the candle wicks
level 2 - light green/red for the candle body, lighter still for the wicks
it was the best visually appealing representation i could come with, if you find a better one share it in comments, please :)
basically works the same as the previous tool, the ghost candle, but with two levels of time frames superimposed. the same notes and warnings from the ghost candle apply, so go read them, too lazy for a copypasta :)
you can find the ghost candle here:

cooltoyz: Volume Delta RealTime v1.0This is a tool, shows the volume variation % strength related to the X past candles.
The current candle is shown in real time, until candle closes.
The visualization of the candle time to close is a thin line, that is 100% for all past candles and slowly goes up for the current candle.
Best with an example:
with a 4h candle, 1 hour has wasted already. This is 25% of all the candle time. So, if volume is also at 25% of the last candles traded, we can expect(yeah, you wish) that by candle close, around 100% of the last volumes average will be traded.
Or two:
in a 4h candle, we're at 10mins., around 8% of total candle time. If volume traded is already at 57% of average past volumes, something big is going on.
Note 1: in the indicator's "Format" pop-up there is a "candle minutes" field, it MUST match the chart timeframe in minutes (ex: 4h=240min)
Note 2: the back volume function check can be switched between the methods "highest value" or "average", in the Format->inputs
Note 3: when a new candle opens, it will go craaayeeezeee!!, because the extreme small values introduce a lot of rounding errors. just let it go, it calms it self after ~0.5% of candle time has passed.
There are more examples and details in the early version of this indicator, check my published scripts.

cooltoyz: ghost candleThis is a tool. Do with it what you like :)
The ghost candle works by drawing a bigger time frame candles in ghost mode over a chart. The time frame is default of 4h, can be changed in the "format" pop-up.
What we see in a time frame as the "wick", is really a set of candles when looked at lower resolutions/timeframes, that info is crunched into the OHLC format. But, when we look at a represntation of the "internals" of a candle, the wicks are not just a single candle that "walked out of the reservation".
So, in this ghost mode, a wick makes no sense visually. In this case, the OHLC is represented as a darker area for the main candle body, and lighter zones for the wicks. Just another way to sing the same song...
Note 1: the ghost candles are skewed, due to the way that TV plots a line. It's most visible when a chart is very zoomed.
Note 2:As result of the TV real time engine, the last candle presents sometimes mixed colors. There's no easy way to fix it, so until the candle closes, if you see weird colors, well, that's life :)

B3 MTF OHLCB3 M ulti T ime F rame - O pen H igh L ow C lose
For showing a 2nd resolution on one chart; Not much more to say about that :)

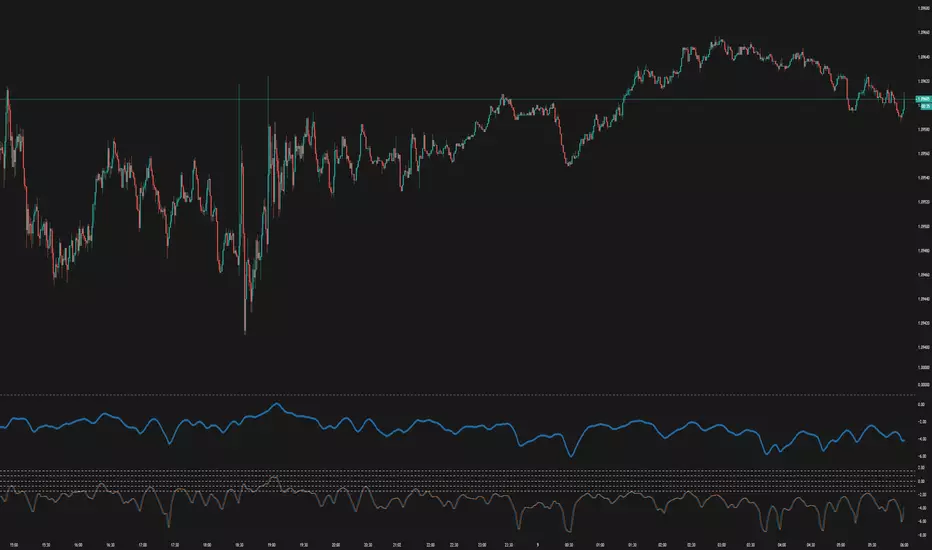
MACDouble + RSI (rec. 15min-2hr intrv) Uses two sets of MACD plus an RSI to either long or short. All three indicators trigger buy/sell as one (ie it's not 'IF MACD1 OR MACD2 OR RSI > 1 = buy", its more like "IF 1 AND 2 AND RSI=buy", all 3 match required for trigger)
The MACD inputs should be tweaked depending on timeframe and what you are trading. If you are doing 1, 3, 5 min or real frequent trading then 21/44/20 and 32/66/29 or other high value MACDs should be considered. If you are doing longer intervals like 2, 3, 4hr then consider 9/19/9 and 21/44/20 for MACDs (experiment! I picked these example #s randomly).
Ideal usage for the MACD sets is to have MACD2 inputs at around 1.5x, 2x, or 3x MACD1's inputs.
Other settings to consider: try having fastlength1=macdlength1 and then (fastlength2 = macdlength2 - 2). Like 10/26/10 and 23/48/20. This seems to increase net profit since it is more likely to trigger before major price moves, but may decrease profitable trade %. Conversely, consider FL1=MCDL1 and FL2 = MCDL2 + (FL2 * 0.5). Example: 10/26/10 and 22/48/30 this can increase profitable trade %, though may cost some net profit.
Feel free to message me with suggestions or questions.
