Session Visualizer by Timezone (Fixed)Session Visualizer by Timezone (Asia, London, New York)
This indicator highlights the Asian, London, and New York trading sessions directly on your chart — adjusted to your local timezone (via UTC offset).
🔧 Key Features:
Session times automatically adjust based on your chosen UTC offset
Toggle each session on/off individually
Custom background colors for each session
Designed for all intraday timeframes (1m – 4H)
📍 Sessions Covered:
Asian Session – Generally lower volatility and slower price movement; ideal for range traders and pre-positioning
London Session – Marked increase in volatility as European markets open
New York Session – Highest volume and volatility, especially during the London-New York overlap
🕓 Time Offset Setting:
Input your local UTC offset (e.g., UTC+10 for Sydney, UTC+1 for Berlin, UTC-5 for New York). The indicator adjusts session display accordingly.
Trade

TradePlanner ProPlan smarter. Trade with precision.
TradePlanner Pro is a professional-grade overlay tool designed to streamline your trading decisions by visually organizing your trade plans directly on the chart. Built for traders who value preparation and clarity, this script enables precise entry planning, risk management, and target visualization—all tailored per symbol.
Core Purpose
TradePlanner Pro helps you map out potential trades using pre-defined symbol-based presets. It dynamically calculates position sizes based on your account size or fixed risk, then visualizes key trade levels (Entry, Take Profits, Stop Loss) with profit/loss metrics in both dollar and percentage terms. It's the perfect companion for traders who prepare their setups in advance and want their plans clearly represented on the chart.
Key Features
🔹 Per-Symbol Presets: Define entries, up to 3 take-profit levels, and stop-losses for each ticker.
🔹 Dynamic Risk Sizing: Choose between percentage-based risk or fixed dollar risk per trade.
🔹 Visual Trade Mapping: Automatically plots Entry, TP1–TP3, and SL lines on your chart.
🔹 Real-Time P&L Labels: Displays profit/loss amounts and percentages, with optional R/R ratios.
🔹 Custom Investment Display: Shows how much capital is allocated per trade.
🔹 Clean, Configurable UI: Adjust label positions, font sizes, opacity, and label visibility to match your style.
Whether you're swing trading or day trading, TradePlanner Pro helps you stay disciplined, organized, and confident in your execution.
How to Use TradePlanner Pro – Step-by-Step Guide
TradePlanner Pro is designed to be easy to set up while giving you full control over how your trades are visualized and calculated. Here’s how to get started:
1. Start with Default Settings
By default, the script assumes:
Account Size: $10,000
Max Money per Trade (%): 1.0%
Max Risk (USD): 0 (disabled; only percentage risk is used)
This means the script will size each trade to risk 1% of your account balance per trade unless you override it with a fixed USD risk amount.
2. Set Up Your Symbol Presets
The "Symbol Presets" input is a flexible text area where you define trade setups for each ticker.
Format (one per line):
SYMBOL:Entry,TP1 ,SL
Example:
AAPL:250,260,270,240
MSFT:100,110,90
TSLA:180,200,170
You can include 1 to 3 take-profit levels.
The script will only activate for the current chart’s symbol, matching what's listed.
3. Customize Risk Parameters
You can use:
Account % Risk – Based on account size and % risk.
Fixed USD Risk – When a dollar amount is entered (>0), it takes priority and calculates share size based on the risk per share.
There's also an option to round share quantities down to whole units, which is useful for stock or crypto trading platforms that only allow whole-number units.
4. Choose What to Display
Toggle on/off these elements as needed:
Show Entry/TP/SL Lines
Show P&L Labels – Profit/loss amounts at each target and SL.
Show Amount Invested – Includes total dollar value in the quantity label.
Show Percentages – Adds % gain/loss to each label.
Show Risk/Reward Ratios – Optionally displayed beside or below TP labels.
You can further adjust:
Font size and label opacity
Label position offset – In percent of price range, so they don’t overlap the actual levels.
5. Read the Visual Outputs
Once the preset matches the current chart symbol:
Lines will appear for Entry, TP1-TP3, and Stop Loss.
Labels will display your:
Trade quantity (and invested amount)
Dollar and % profit at each target
Total loss at stop loss
Optional R/R ratios
Everything updates dynamically and adjusts to your current chart scale and bar availabilit

Bollinger Bounce Reversal Strategy – Visual EditionOverview:
The Bollinger Bounce Reversal Strategy – Visual Edition is designed to capture potential reversal moves at price extremes—often termed “bounce points”—by using a combination of technical indicators. The strategy integrates Bollinger Bands, MACD, and volume analysis, and it provides rich on‑chart visual cues to help traders understand its signals and conditions. Additionally, the strategy enforces a maximum of 5 trades per day and uses fixed risk management parameters. This publication is intended for educational purposes and offers a systematic, transparent approach that you can further adjust to fit your market or risk profile.
How It Works:
Bollinger Bands:
A 20‑period simple moving average (SMA) and a user‑defined standard deviation multiplier (default 2.0) are used to calculate the Bollinger Bands.
When the price reaches or crosses these bands (i.e. falls below the lower band or rises above the upper band), it suggests that the price is in an extreme, potentially oversold or overbought, state.
MACD Filter:
The MACD (calculated with standard lengths, e.g. 12, 26, 9) provides momentum information.
For a bullish (long) signal, the MACD line should be above its signal line; for a bearish (short) signal, the MACD line should be below.
Volume Confirmation:
The strategy uses a 20‑period volume moving average to determine if current volume is strong enough to validate a signal.
A signal is confirmed only if the current volume is at or above a specified multiple (by default, 1.0×) of this moving average, ensuring that the move is supported by increased market participation.
Visual Cues:
Bollinger Bands and Fill: The basis (SMA), upper, and lower Bollinger Bands are plotted, and the area between the upper and lower bands is filled with a semi‑transparent color.
Signal Markers: When a long or short signal is generated, corresponding markers (labels) appear on the chart.
Background Coloring: The chart’s background changes color (green for long signals and red for short signals) on the bars where signals occur.
Information Table: An on‑chart table displays key indicator values (MACD, signal line, volume, average volume) and the number of trades executed that day.
Entry Conditions:
Long Entry:
A long trade is triggered when the previous bar’s close is below the lower Bollinger Band and the current bar’s close crosses above it, combined with a bullish MACD condition and strong volume.
Short Entry:
A short trade is triggered when the previous bar’s close is above the upper Bollinger Band and the current bar’s close crosses below it, with a bearish MACD condition and high volume.
Risk Management:
Daily Trade Limit: The strategy restricts trading to no more than 5 trades per day.
Stop-Loss and Take-Profit:
For each position, a stop loss is set at a fixed percentage away from the entry price (typically 2%), and a take profit is set to target a 1:2 risk-reward ratio (typically 4% from the entry price).
Backtesting Setup:
Initial Capital: $10,000
Commission: 0.1% per trade
Slippage: 1 tick per bar
These realistic parameters help ensure that backtesting results reflect the conditions of an average trader.
Disclaimer:
Past performance is not indicative of future results. This strategy is experimental and provided solely for educational purposes. It is essential to backtest extensively and paper trade before any live deployment. All risk management practices are advisory, and you should adjust parameters to suit your own trading style and risk tolerance.
Conclusion:
By combining Bollinger Bands, MACD, and volume analysis, the Bollinger Bounce Reversal Strategy – Visual Edition provides a clear, systematic method to identify potential reversal opportunities at price extremes. The added visual cues help traders quickly interpret signals and assess market conditions, while strict risk management and a daily trade cap help keep trading disciplined. Adjust and refine the settings as needed to better suit your specific market and risk profile.

Volatility Momentum Breakout StrategyDescription:
Overview:
The Volatility Momentum Breakout Strategy is designed to capture significant price moves by combining a volatility breakout approach with trend and momentum filters. This strategy dynamically calculates breakout levels based on market volatility and uses these levels along with trend and momentum conditions to identify trade opportunities.
How It Works:
1. Volatility Breakout:
• Methodology:
The strategy computes the highest high and lowest low over a defined lookback period (excluding the current bar to avoid look-ahead bias). A multiple of the Average True Range (ATR) is then added to (or subtracted from) these levels to form dynamic breakout thresholds.
• Purpose:
This method helps capture significant price movements (breakouts) while ensuring that only past data is used, thereby maintaining realistic signal generation.
2. Trend Filtering:
• Methodology:
A short-term Exponential Moving Average (EMA) is applied to determine the prevailing trend.
• Purpose:
Long trades are considered only when the current price is above the EMA, indicating an uptrend, while short trades are taken only when the price is below the EMA, indicating a downtrend.
3. Momentum Confirmation:
• Methodology:
The Relative Strength Index (RSI) is used to gauge market momentum.
• Purpose:
For long entries, the RSI must be above a mid-level (e.g., above 50) to confirm upward momentum, and for short entries, it must be below a similar threshold. This helps filter out signals during overextended conditions.
Entry Conditions:
• Long Entry:
A long position is triggered when the current closing price exceeds the calculated long breakout level, the price is above the short-term EMA, and the RSI confirms momentum (e.g., above 50).
• Short Entry:
A short position is triggered when the closing price falls below the calculated short breakout level, the price is below the EMA, and the RSI confirms momentum (e.g., below 50).
Risk Management:
• Position Sizing:
Trades are sized to risk a fixed percentage of account equity (set here to 5% per trade in the code, with each trade’s stop loss defined so that risk is limited to approximately 2% of the entry price).
• Stop Loss & Take Profit:
A stop loss is placed a fixed ATR multiple away from the entry price, and a take profit target is set to achieve a 1:2 risk-reward ratio.
• Realistic Backtesting:
The strategy is backtested using an initial capital of $10,000, with a commission of 0.1% per trade and slippage of 1 tick per bar—parameters chosen to reflect conditions faced by the average trader.
Important Disclaimers:
• No Look-Ahead Bias:
All breakout levels are calculated using only past data (excluding the current bar) to ensure that the strategy does not “peek” into future data.
• Educational Purpose:
This strategy is experimental and provided solely for educational purposes. Past performance is not indicative of future results.
• User Responsibility:
Traders should thoroughly backtest and paper trade the strategy under various market conditions and adjust parameters to fit their own risk tolerance and trading style before live deployment.
Conclusion:
By integrating volatility-based breakout signals with trend and momentum filters, the Volatility Momentum Breakout Strategy offers a unique method to capture significant price moves in a disciplined manner. This publication provides a transparent explanation of the strategy’s components and realistic backtesting parameters, making it a useful tool for educational purposes and further customization by the TradingView community.

Advanced Multi-Timeframe Trading System (Risk Managed)Description:
This strategy is an original approach that combines two main analytical components to identify potential trade opportunities while simulating realistic trading conditions:
1. Market Trend Analysis via an Approximate Hurst Exponent
• What It Does:
The strategy computes a rough measure of market trending using an approximate Hurst exponent. A value above 0.5 suggests persistent, trending behavior, while a value below 0.5 indicates a tendency toward mean-reversion.
• How It’s Used:
The Hurst exponent is calculated on both the chart’s current timeframe and a higher timeframe (default: Daily) to capture both local and broader market dynamics.
2. Fibonacci Retracement Levels
• What It Does:
Using daily high and low data from a selected timeframe (default: Daily), the script computes key Fibonacci retracement levels.
• How It’s Used:
• The 61.8% level (Golden Ratio) serves as a key threshold:
• A long entry is signaled when the price crosses above this level if the daily Hurst exponent confirms a trending market.
• The 38.2% level is used to identify short-entry opportunities when the price crosses below it and the daily Hurst indicates non-trending conditions.
Signal Logic:
• Long Entry:
When the price crosses above the 61.8% Fibonacci level (Golden Ratio) and the daily Hurst exponent is greater than 0.5, suggesting a trending market.
• Short Entry:
When the price crosses below the 38.2% Fibonacci level and the daily Hurst exponent is less than 0.5, indicating a less trending or potentially reversing market.
Risk Management & Trade Execution:
• Stop-Loss:
Each trade is risk-managed with a stop-loss set at 2% below (for longs) or above (for shorts) the entry price. This ensures that no single trade risks more than a small, sustainable portion of the account.
• Take Profit:
A take profit order targets a risk-reward ratio of 1:2 (i.e., the target profit is twice the amount risked).
• Position Sizing:
Trades are executed with a fixed position size equal to 10% of account equity.
• Trade Frequency Limits:
• Daily Limit: A maximum of 5 trades per day
• Overall Limit: No more than 510 trades during the backtesting period (e.g., since 2019)
These limits are imposed to simulate realistic trading frequency and to avoid overtrading in backtest results.
Backtesting Parameters:
• Initial Capital: $10,000
• Commission: 0.1% per trade
• Slippage: 1 tick per bar
These settings aim to reflect the conditions faced by the average trader and help ensure that the backtesting results are realistic and not misleading.
Chart Overlays & Visual Aids:
• Fibonacci Levels:
The key Fibonacci retracement levels are plotted on the chart, and the zone between the 61.8% and 38.2% levels is highlighted to show a key retracement area.
• Market Trend Background:
The chart background is tinted green when the daily Hurst exponent indicates a trending market (value > 0.5) and red otherwise.
• Information Table:
An on-chart table displays key parameters such as the current Hurst exponent, daily Hurst value, the number of trades executed today, and the global trade count.
Disclaimer:
Past performance is not indicative of future results. This strategy is experimental and provided solely for educational purposes. It is essential that you backtest and paper trade using your own settings before considering any live deployment. The Hurst exponent calculation is an approximation and should be interpreted as a rough gauge of market behavior. Adjust the parameters and risk management settings according to your personal risk tolerance and market conditions.
Additional Notes:
• Originality & Usefulness:
This script is an original mashup that combines trend analysis with Fibonacci retracement methods. The description above explains how these components work together to provide trading signals.
• Realistic Results:
The strategy uses realistic account sizes, commission rates, slippage, and risk management rules to generate backtesting results that are representative of real-world trading.
• Educational Purpose:
This script is intended to support the TradingView community by offering insights into combining multiple analysis techniques in one strategy. It is not a “get-rich-quick” system but rather an educational tool to help traders understand risk management and trade signal logic.
By using this script, you acknowledge that trading involves risk and that you are responsible for testing and adjusting the strategy to fit your own trading environment. This publication is fully open source, and any modifications should include proper attribution if significant portions of the code are reused.

Ultra Trade JournalThe Ultra Trade Journal is a powerful TradingView indicator designed to help traders meticulously document and analyze their trades. Whether you're a novice or an experienced trader, this tool offers a clear and organized way to visualize your trading strategy, monitor performance, and make informed decisions based on detailed trade metrics.
Detailed Description
The Ultra Trade Journal indicator allows users to input and visualize critical trade information directly on their TradingView charts.
.........
User Inputs
Traders can specify entry and exit prices , stop loss levels, and up to four take profit targets.
.....
Dynamic Plotting
Once the input values are set, the indicator automatically plots horizontal lines for entry, exit, stop loss, and each take profit level on the chart. These lines are visually distinct, using different colors and styles (solid, dashed, dotted) to represent each element clearly.
.....
Live Position Tracking
If enabled, the indicator can adjust the exit price in real-time based on the current market price, allowing traders to monitor live positions effectively.
.....
Tick Calculations
The script calculates the number of ticks between the entry price and each exit point (stop loss and take profits). This helps in understanding the movement required for each target and assessing the potential risk and reward.
.....
Risk-Reward Ratios
For each take profit level, the indicator computes the risk-reward (RR) ratio by comparing the ticks at each target against the stop loss ticks. This provides a quick view of the potential profitability versus the risk taken.
.....
Comprehensive Table Display
A customizable table is displayed on the chart, summarizing all key trade details. This includes the entry and exit prices, stop loss and take profit levels, tick counts, and their respective RR ratios.
Users can adjust the table's Position and text color to suit their preferences.
.....
Visual Enhancements
The indicator uses adjustable background shading between entry and stop loss/take profit lines to visually represent potential trade outcomes. This shading adjusts based on whether the trade is long or short, providing an intuitive understanding of trade performance.
.........
Overall, the Ultra Trade Journal combines visual clarity with detailed analytics, enabling traders to keep a well-organized record of their trades and enhance their trading strategies through insightful data.

Alert Kabi Family Unlimited Alarm indicator for any time frame and any type of currency, stock and index
اندییکاتور آلارم نامحدود برای هر تایم فریم و هر شاخص و ارز و سهام
Settings :
1- Before starting, clear all alarms in the trading view alarm section
2- Specify your alarm areas and currency pairs in the indicator settings section
3- Go to the trading view alarm section, click create alert, select the name of the indicator and click OK
4- Good Luck
T e L : @Ar3781
1- قبل از شروع تمام آلارم های تریدینگ ویو را پاک کنید
2- در قسمت تنظیمات اندیکاتور نواحی آلارم و جفت ارز خود را مشخص کنید
3- به قسمت الارم تریدینگ ویو رفته ایجاد هشدار را زده و اسم اندیکاتور را انتخاب کنید و اوکی کنید
4- مـــــــوفق بــــــاشـید

Confirmed market structure buy/sell indicatorOverview
The Swing Point Breakout Indicator with Multi-Timeframe Dashboard is a TradingView tool designed to identify potential buy and sell signals based on swing point breakouts on the primary chart's timeframe while simultaneously providing a snapshot of the market structure across multiple higher timeframes. This dual approach helps traders make informed decisions by aligning short-term signals with broader market trends.
Key Features
Swing Point Breakout Detection
Swing Highs and Lows: Identifies significant peaks and troughs based on a user-defined lookback period.
Breakout Signals:
Bullish Breakout (Buy Signal): Triggered when the price closes above the latest swing high.
Bearish Breakout (Sell Signal): Triggered when the price closes below the latest swing low.
Visual Indicators: Highlights breakout bars with colors (lime for bullish, red for bearish) and plots buy/sell markers on the chart.
Multi-Timeframe Dashboard
Timeframes Monitored: 1m, 5m, 15m, 1h, 4h, 1D, and 1W.
Market Structure Status:
Bullish: Indicates upward market structure.
Bearish: Indicates downward market structure.
Neutral: No clear trend.
Visual Table: Displays each timeframe with its current status, color-coded for quick reference (green for bullish, red for bearish, gray for neutral).
Operational Workflow
Initialization:
Sets up a dashboard table on the chart's top-right corner with headers "Timeframe" and "Status".
Swing Point Detection:
Continuously scans the main timeframe for swing highs and lows using the specified lookback period.
Updates the latest swing high and low levels.
Signal Generation:
Detects when the price breaks above the last swing high (bullish) or below the last swing low (bearish).
Activates potential buy/sell setups and confirms signals based on subsequent price movements.
Dashboard Update:
For each defined higher timeframe, assesses the market structure by checking for breakouts of swing points.
Updates the dashboard with the current status for each timeframe, aiding in trend confirmation.
Visualization:
Colors the bars where breakouts occur.
Plots buy and sell signals directly on the chart for easy identification.

Adaptive VWAP [QuantAlgo]Introducing the Adaptive VWAP by QuantAlgo 📈🧬
Enhance your trading and investing strategies with the Adaptive VWAP , a versatile tool designed to provide dynamic insights into market trends and price behavior. This indicator offers a flexible approach to VWAP calculations by allowing users to adapt it based on lookback periods or fixed timeframes, making it suitable for a wide range of market conditions.
🌟 Key Features:
🛠 Customizable VWAP Settings: Choose between an adaptive VWAP that adjusts based on a rolling lookback period, or switch to a fixed timeframe (e.g., daily, weekly, monthly) for a more structured approach. Adjust the VWAP to suit your trading or investing style.
💫 Dynamic Bands and ATR Filter: Configurable deviation bands with multipliers allow you to visualize price movement around VWAP, while an ATR-based noise filter helps reduce false signals during periods of market fluctuation.
🎨 Trend Visualization: Color-coded trend identification helps you easily spot uptrends and downtrends based on VWAP positioning. The indicator fills the areas between the bands for clearer visual representation of price volatility and trend strength.
🔔 Custom Alerts: Set up alerts for when price crosses above or below the VWAP, signaling potential uptrend or downtrend opportunities. Stay informed without needing to monitor the charts constantly.
✍️ How to Use:
✅ Add the Indicator: Add the Adaptive VWAP to your favourites and apply to your chart. Choose between adaptive or timeframe-based VWAP calculation, adjust the lookback period, and configure the deviation bands to your preferred settings.
👀 Monitor Bands and Trends: Watch for price interaction with the VWAP and its deviation bands. The color-coded signals and band fills help identify potential trend shifts or price extremes.
🔔 Set Alerts: Configure alerts for uptrend and downtrend signals based on price crossing the VWAP, so you’re always informed of significant market movements.
⚙️ How It Works:
The Adaptive VWAP adjusts its calculation based on the user’s chosen configuration, allowing for a flexible approach to market analysis. The adaptive setting uses a rolling lookback period to continuously adjust the VWAP, while the fixed timeframe option anchors VWAP to key timeframes like daily, weekly, or monthly periods. This flexibility enables traders and investors to use the tool in various market environments.
Deviation bands, calculated with customizable multipliers, provide a clear visual of how far the price has moved from the VWAP, helping you gauge potential overbought or oversold conditions. To reduce false signals, an ATR-based filter can be applied, ensuring that only significant price movements trigger trend confirmations.
The tool also includes a fast exponential smoothing function for the VWAP, helping smooth out price fluctuations without sacrificing responsiveness. Trend confirmation is reinforced by the number of bars that price stays above or below the VWAP, ensuring a more consistent trend identification process.
Disclaimer:
The Adaptive VWAP is designed to enhance your market analysis but should not be relied upon as the sole basis for trading or investing decisions. Always combine it with other analytical tools and practices. No statements or signals from this indicator constitute financial advice. Past performance is not indicative of future results.

Volatility-Adjusted DEMA Supertrend [QuantAlgo]Introducing the Volatility-Adjusted DEMA Supertrend by QuantAlgo 📈💫
Take your trading and investing strategies to the next level with the Volatility-Adjusted DEMA Supertrend , a dynamic tool designed to adapt to market volatility and provide clear, actionable trend signals. This innovative indicator is ideal for both traders and investors looking for a more responsive approach to market trends, helping you capture potential shifts with greater precision.
🌟 Key Features:
🛠 Customizable Trend Settings: Adjust the period for trend calculation and fine-tune the sensitivity to price movements. This flexibility allows you to tailor the Supertrend to your unique trading or investing strategy, whether you're focusing on shorter or longer timeframes.
📊 Volatility-Responsive Multiplier: The Supertrend dynamically adjusts its sensitivity based on real-time market volatility. This could help filter out noise in calmer markets and provide more accurate signals during periods of heightened volatility.
✨ Trend-Based Color-Coding: Visualize bullish and bearish trends with ease. The indicator paints candles and plots trend lines with distinct colors based on the current market direction, offering quick, clear insights into potential opportunities.
🔔 Custom Alerts: Set up alerts for key trend shifts to ensure you're notified of significant market changes. These alerts would allow you to act swiftly, potentially capturing opportunities without needing to constantly monitor the charts.
📈 How to Use:
✅ Add the Indicator: Add the Volatility-Adjusted DEMA Supertrend to your chart. Customize the trend period, volatility settings, and price source to match your trading or investing style. This ensures the indicator aligns with your market strategy.
👀 Monitor Trend Shifts: Watch the color-coded trend lines and candles as they dynamically shift based on real-time market conditions. These visual cues help you spot potential trend reversals and confirm your entries and exits with greater confidence.
🔔 Set Alerts: Configure alerts for key trend shifts, allowing you to stay informed of potential market reversals or continuation patterns, even when you're not actively watching the market.
⚙️ How It Works:
The Volatility-Adjusted DEMA Supertrend is designed to adapt to changes in market conditions, making it highly responsive to price volatility. The indicator calculates a trend line based on price and volatility, dynamically adjusting it to reflect recent market behavior. When the market experiences higher volatility, the trend line becomes more flexible, potentially allowing for greater sensitivity to rapid price movements. Conversely, during periods of low volatility, the indicator tightens its range, helping to reduce noise and avoid false signals.
The indicator includes a volatility-responsive multiplier, which further enhances its adaptability to market conditions. This means the trend direction would always be based on the latest market data, potentially helping you stay ahead of shifts or continuation trends. The Supertrend's visual color-coding simplifies the process of identifying bullish or bearish trends, while customizable alerts ensure you can stay on top of significant changes in market direction.
This tool is versatile and could be applied across various markets and timeframes, making it a valuable addition for both traders and investors. Whether you’re trading in fast-moving markets or focusing on longer-term investments, the Volatility-Adjusted DEMA Supertrend could help you remain aligned with the current market environment.
Disclaimer:
This indicator is designed to enhance your analysis by providing trend information, but it should not be used as the sole basis for making trading or investing decisions. Always combine it with other forms of analysis and risk management practices. No statements or claims aim to be financial advice, and no signals from us or our indicators should be interpreted as such. Past performance is not indicative of future results.

Fibonacci-Only StrategyFibonacci-Only Strategy
This script is a custom trading strategy designed for traders who leverage Fibonacci retracement levels to identify potential trade entries and exits. The strategy is versatile, allowing users to trade across multiple timeframes, with built-in options for dynamic stop loss, trailing stops, and take profit levels.
Key Features:
Custom Fibonacci Levels:
This strategy calculates three specific Fibonacci retracement levels: 19%, 82.56%, and the reverse 19% level. These levels are used to identify potential areas of support and resistance where price reversals or breaks might occur.
The Fibonacci levels are calculated based on the highest and lowest prices within a 100-bar period, making them dynamic and responsive to recent market conditions.
Dynamic Entry Conditions:
Touch Entry: The script enters long or short positions when the price touches specific Fibonacci levels and confirms the move with a bullish (for long) or bearish (for short) candle.
Break Entry (Optional): If the "Use Break Strategy" option is enabled, the script can also enter positions when the price breaks through Fibonacci levels, providing more aggressive entry opportunities.
Stop Loss Management:
The script offers flexible stop loss settings. Users can choose between a fixed percentage stop loss or an ATR-based stop loss, which adjusts based on market volatility.
The ATR (Average True Range) stop loss is multiplied by a user-defined factor, allowing for tailored risk management based on market conditions.
Trailing Stop Mechanism:
The script includes an optional trailing stop feature, which adjusts the stop loss level as the market moves in favor of the trade. This helps lock in profits while allowing the trade to run if the trend continues.
The trailing stop is calculated as a percentage of the difference between the entry price and the current market price.
Multiple Take Profit Levels:
The strategy calculates seven take profit levels, each at incremental percentages above (for long trades) or below (for short trades) the entry price. This allows for gradual profit-taking as the market moves in the trade's favor.
Each take profit level can be customized in terms of the percentage of the position to be closed, providing precise control over exit strategies.
Strategy Backtesting and Results:
Realistic Backtesting:
The script has been backtested with realistic account sizes, commission rates, and slippage settings to ensure that the results are applicable to actual trading scenarios.
The backtesting covers various timeframes and markets to ensure the strategy's robustness across different trading environments.
Default Settings:
The script is published with default settings that have been optimized for general use. These settings include a 15-minute timeframe, a 1.0% stop loss, a 2.0 ATR multiplier for stop loss, and a 1.5% trailing stop.
Users can adjust these settings to better fit their specific trading style or the market they are trading.
How It Works:
Long Entry Conditions:
The strategy enters a long position when the price touches the 19% Fibonacci level (from high to low) or the reverse 19% level (from low to high) and confirms the move with a bullish candle.
If the "Use Break Strategy" option is enabled, the script will also enter a long position when the price breaks below the 19% Fibonacci level and then moves back up, confirming the break with a bullish candle.
Short Entry Conditions:
The strategy enters a short position when the price touches the 82.56% Fibonacci level and confirms the move with a bearish candle.
If the "Use Break Strategy" option is enabled, the script will also enter a short position when the price breaks above the 82.56% Fibonacci level and then moves back down, confirming the break with a bearish candle.
Stop Loss and Take Profit Logic:
The stop loss for each trade is calculated based on the selected method (fixed percentage or ATR-based). The strategy then manages the trade by either trailing the stop or taking profit at predefined levels.
The take profit levels are set at increments of 0.5% above or below the entry price, depending on whether the position is long or short. The script gradually exits the trade as these levels are hit, securing profits while minimizing risk.
Usage:
For Fibonacci Traders:
This script is ideal for traders who rely on Fibonacci retracement levels to find potential trade entries and exits. The script automates the process, allowing traders to focus on market analysis and decision-making.
For Trend and Swing Traders:
The strategy's flexibility in handling both touch and break entries makes it suitable for trend-following and swing trading strategies. The multiple take profit levels allow traders to capture profits in trending markets while managing risk.
Important Notes:
Originality: This script uniquely combines Fibonacci retracement levels with dynamic stop loss management and multiple take profit levels. It is not just a combination of existing indicators but a thoughtful integration designed to enhance trading performance.
Disclaimer: Trading involves risk, and it is crucial to test this script in a demo account or through backtesting before applying it to live trading. Users should ensure that the settings align with their individual risk tolerance and trading strategy.

TradeLibrary "Trade"
A Trade Tracking Library
Monitor conditions with less code by using Arrays. When your conditions are met in chronologically, a signal is returned and the scanning starts again.
Create trades automatically with Stop Loss, Take Profit and Entry. The trades will automatically track based on the market movement and update when the targets are hit.
Sample Usage
Enter a buy trade when RSI crosses below 70 then crosses above 80 before it crosses 40.
Note: If RSI crosses 40 before 80, No trade will be entered.
rsi = ta.rsi(close, 21)
buyConditions = array.new_bool()
buyConditions.push(ta.crossunder(rsi, 70))
buyConditions.push(ta.crossover(rsi, 80))
buy = Trade.signal(buyConditions, ta.crossunder(rsi, 40))
trade = Trade.new(close-(100*syminfo.mintick), close +(200*syminfo.mintick), condition=buy)
plot(trade.takeprofit, "TP", style=plot.style_circles, linewidth=4, color=color.lime)
alertcondition(trade.tp_hit, "TP Hit")
method signal(conditions, reset)
Signal Conditions
Namespace types: bool
Parameters:
conditions (bool )
reset (bool)
Returns: Boolean: True when all the conditions have occured
method update(this, stoploss, takeprofit, entry)
Update Trade Parameters
Namespace types: Trade
Parameters:
this (Trade)
stoploss (float)
takeprofit (float)
entry (float)
Returns: nothing
method clear(this)
Clear Trade Parameters
Namespace types: Trade
Parameters:
this (Trade)
Returns: nothing
method track(this, _high, _low)
Track Trade Parameters
Namespace types: Trade
Parameters:
this (Trade)
_high (float)
_low (float)
Returns: nothing
new(stoploss, takeprofit, entry, _high, _low, condition, update)
New Trade with tracking
Parameters:
stoploss (float)
takeprofit (float)
entry (float)
_high (float)
_low (float)
condition (bool)
update (bool)
Returns: a Trade with targets and updates if stoploss or takeprofit is hit
new()
New Empty Trade
Returns: an empty trade
Trade
Fields:
stoploss (series__float)
takeprofit (series__float)
entry (series__float)
sl_hit (series__bool)
tp_hit (series__bool)
open (series__integer)

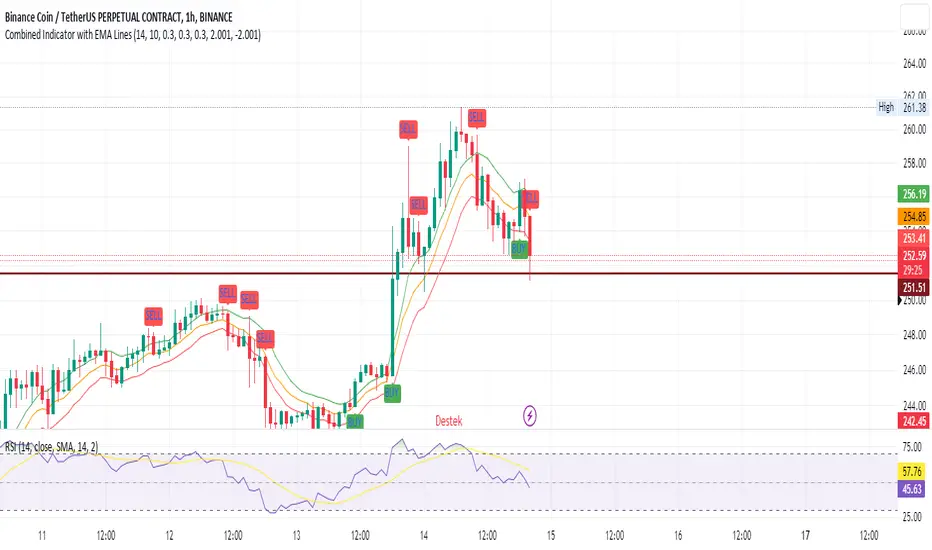
SEC-Combined Indicator with EMA LinesTitle: Combined Indicator with EMA Lines
Description:
The Combined Indicator with EMA Lines is a technical analysis tool that combines multiple indicators to provide insights into the market's strength and potential buying or selling opportunities. It incorporates the Relative Strength Index (RSI), Exponential Moving Average (EMA) lines, and the trend over the past three days to generate signals.
The indicator calculates a combined data value by assigning weights to the RSI, EMA, and past trend. The RSI measures the strength of price movements, while the EMA lines provide an indication of the average price over a specific period. The past trend considers the price behavior over the last three days. By combining these factors, the indicator offers a comprehensive view of market conditions.
Buy and sell signals are generated based on the change in the combined data. A buy signal occurs when there is an increase in the combined data above a specified threshold, indicating a potential buying opportunity. Conversely, a sell signal is triggered when there is a decrease in the combined data below a specified threshold, suggesting a potential selling opportunity.
The indicator also plots the EMA lines, which include the EMA High, EMA Average, and EMA Low. These lines provide additional visual cues about the price trend and potential support and resistance levels.
Traders can use the Combined Indicator with EMA Lines to identify potential entry and exit points in the market. It helps in capturing trends, evaluating price strength, and making informed trading decisions. The buy and sell signals, along with the EMA lines, aid in spotting potential reversals, confirming trends, and managing risk.
It's important to note that this indicator should be used in conjunction with other analysis techniques and risk management strategies. Traders should consider combining it with additional indicators, chart patterns, and fundamental analysis to enhance their trading decisions.
Remember to backtest and validate the indicator's performance using historical data before using it in real-time trading. Adjust the input parameters, such as RSI period, EMA period, and threshold values, to suit your trading style and market conditions.
PositionLibrary "Position"
Allows for simulating trades within an indicator.
newTrade(size, price, timestamp)
Creates a new trade object.
Parameters:
size : The size of the trade (number of shares or contracts).
price : The price at which the trade took place.
timestamp : The timestamp of the trade. Defaults to the current time.
Returns: A new trade object.
start(size, price, timestamp)
Starts a new position.
Parameters:
size : The size of the position (number of shares or contracts).
price : The price at which the position was started.
timestamp : The timestamp of the start of the position. Defaults to the current time.
Returns: A new position object.
trade(pos, size, price, timestamp)
Modifies an existing position.
Parameters:
pos : The position to be modified.
size : The size of the trade (number of shares or contracts).
price : The price at which the trade took place.
timestamp : The timestamp of the trade. Defaults to the current time.
Returns: The modified position object.
exit(pos, price, timestamp)
Closes a position by trading the entire position size at a given price and timestamp.
Parameters:
pos : The position being closed.
price : The price at which the position is being closed.
timestamp : The timestamp of the trade, defaults to the current time.
Returns: The updated position after the trade.
unrealized(pos, price)
Calculates the unrealized gain or loss for a given position and price.
Parameters:
pos : The position for which to calculate unrealized gain/loss.
price : The current market price.
Returns: The calculated unrealized gain or loss.
Trade
Represents a single trade.
Fields:
size : Size of the trade in units.
price : Price of the trade in currency.
value : Total value of the trade in currency units.
time : Timestamp of the trade.
Position
Represents a single position.
Fields:
size : Size of the position in units.
price : Average price of the position in currency.
value : Total value of the position in currency units.
start : Timestamp of the first trade that opened the position.
net : Realized gains and losses of the position in currency units.
history : Array of trades that make up the position.

Trade Travel Chill UtilitiesShows Trading Days starting at 5pm (UTC-4 NY Time)
Shows active Asian, UK and US markets by having a different background colours while those markets are open.
Shows possible Brinks hammer/inverted hammers at 03:45 and 09:45

GenericTradingLibrary "GenericTrading"
This library aims to collect rare but useful operations for
get_most_recent_long_or_short_position_closed_index() : returns most recent long/short closed bar index.
get_most_recent_long_or_short_position_open_index() : returns most recent long/short closed bar index.
These two functions designed to help to speed up the coding for strategies that contains "re-enter" logic.
These two functions also could applies in the situations where time-count is needed in your condition.
3 EMA + Stochastic RSI + ATR 3ESRA
v0.2a
Coded by Vaida Bogdan
3ESRA consists of a 3 EMA cross + a close above (for longs) the quickest EMA
or below (for shorts). Note that I've deactivated the RSI Cross Over/Under
(you can modify the code and activate it). The strategy also uses a stop loss
that's at 1 ATR distance from the entry price and a take profit that's at
4 times the ATR distance from the entry price.
Wide BarsSimple scripts show the wide range bars within in the look back period, visualizing the bigger momentum.
Added four exponential moving averages which define the trend of the instrument.
Wide range candles in the direction of overall trend on higher timeframes; give confluence of higher participation in the same direction.
Note : Decent volume above the average volume with wide range candle adds more value.

example: Event StatisticsEXPERIMENTAL:
A example on how to retrieve statistics from a recurring event.
Can be used to optimized strategy's, trade parameters, etc..
Close Trade at end of day script serves as an example how we can close trades at end of day.
can be session controlled or the time controlled.
the session should be adjusted to be earlier than the candle time.
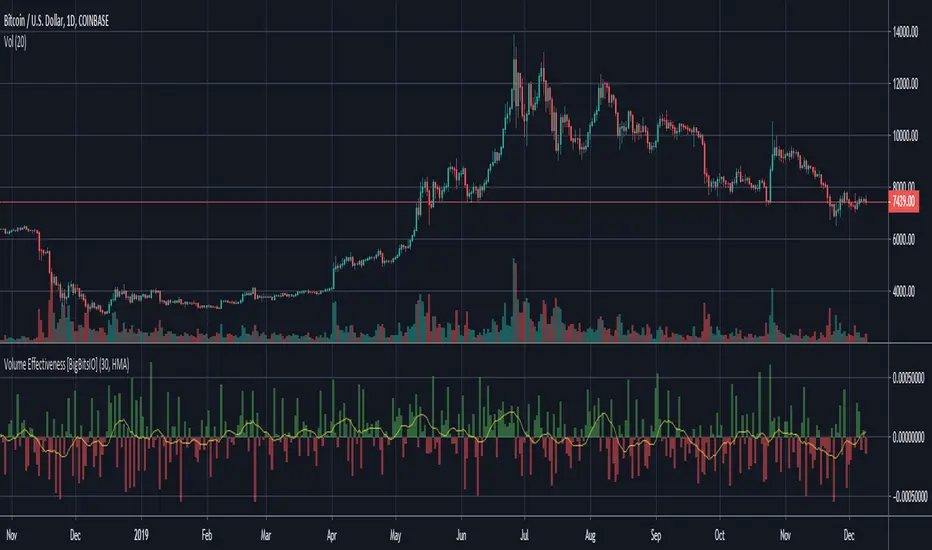
Volume Effectiveness [BigBitsIO]This Volume Effectiveness indicator is designed to allow users to try and identify how effective volume is on each candle, and smoothing those values over time to try to find trends.
Volume Effectiveness is the % change in price for each single unit of volume on the associated candle. The value can be positive or negative, but there is an option to just monitor an absolute value.
Features:
- Volume Effectiveness
- Toggle if Volume Effectiveness should be an absolute value
- Toggle visibility of bars
- Smoothed moving average of Volume Effectiveness
- Adjustable period on the smoothed moving average
- Several moving average types available to use for the smoothed moving average
- Toggle visibility of smoothed moving average
SpreadTrade - Distance (ps4 ver. 2)This script implements a rebrushed distance-based pair trading strategy. In this strategy, normally they trade the difference between the prices of two instruments. This difference is also called spread. Here, however we’ll trade the difference between two time frames of one instrument. And that's the main trick. Common procedure consists of the following steps:
1. Select two CORRELATED stocks. Here we'll use the same instrument in different TFs.
2. Generate the spread by calculating the difference between the prices/instruments. For distance based pair trading, we need to (rescale the data first and then) check the distance between them.
3. Define the logic to trade the spread and generate the trading signals. In this example we’ll calculate the rolling mean and rolling standard deviation of the spread. Whenever the spread goes above a rolling mean by one standard deviation, we’ll short the spread expecting the mean reversion behavior to hold true. And whenever the spread goes below its rolling mean by one standard deviation, we’ll go long on the spread.
Mind that the meaning of the orange and blue signals depends on whether tf variable is smaller or larger than the built-in timeframe.multiplier variable, i.e. tf of the chart.
For details see analyticsprofile.com
Donate: PayPal (paypal.me)

Great Expectations [LucF]Great Expectations helps traders answer the question: What is possible? It is a powerful question, yet exploration of the unknown always entails risk. A more complete set of questions better suited to traders could be:
What opportunity exists from any given point on a chart?
What portion of this opportunity can be realistically captured?
What risk will be incurred in trying to do so, and how long will it take?
Great Expectations is the result of an exploration of these questions. It is a trade simulator that generates visual and quantitative information to help strategy modelers visually identify and analyse areas of optimal expectation on charts, whether they are designing automated or discretionary strategies.
WARNING: Great Expectations is NOT an indicator that helps determine the current state of a market. It works by looking at points in the past from which the future is already known. It uses one definition of repainting extensively (i.e. it goes back in the past to print information that could not have been know at the time). Repainting understood that way is in fact almost all the indicator does! —albeit for what I hope is a noble cause. The indicator is of no use whatsoever in analyzing markets in real-time. If you do not understand what it does, please stay away!
This is an indicator—not a strategy that uses TradingView’s backtesting engine. It works by simulating trades, not unlike a backtest, but with the crucial difference that it assumes a trade (either long or short) is entered on all bars in the historic sample. It walks forward from each bar and determines possible outcomes, gathering individual trade statistics that in turn generate precious global statistics from all outcomes tested on the chart.
Great Expectations provides numbers summarizing trade results on all simulations run from the chart. Those numbers cannot be compared to backtest-produced numbers since all non-filtered bars are examined, even if an entry was taken on the bar immediately preceding the current one, which never happens in a backtest. This peculiarity does NOT invalidate Great Expectations calculations; it just entails that results be considered under a different light. Provided they are evaluated within the indicator’s context, they can be useful—sometimes even more than backtesting results, e.g. in evaluating the impact of parameter-fitting or variations in entry, exit or filtering strats.
Traders and strategy modelers are creatures of hope often suffering from blurred vision; my hope is that Great Expectations will help them appraise the validity of their setup and strat intuitions in a realistic fashion, preventing confirmation bias from obstructing perspective—and great expectations from turning into financial great deceptions.
USE CASES
You’ve identified what looks like a promising setup on other indicators. You load Great Expectations on the chart and evaluate if its high-expectation areas match locations where your setup’s conditions occur. Unless today is your lucky day, chances are the indicator will help you realize your setup is not as promising as you had hoped.
You want to get a rough estimate of the optimal trade duration for a chart and you don’t mind using the entry and exit strategies provided with the indicator. You use the trade length readouts of the indicator.
You’re experimenting with a new stop strategy and want to know how long it will keep you in trades, on average. You integrate your stop strategy in the indicator’s code and look at the average trade length it produces and the TST ratio to evaluate its performance.
You have put together your own entry and exit criteria and are looking for a filter that will help you improve backtesting results. You visually ascertain the suitability of your filter by looking at its results on the charts with great Expectations, to see if your filter is choosing its areas correctly.
You have a strategy that shows backtested trades on your chart. Great Expectations can help you evaluate how well your strategy is benefitting from high-opportunity areas while avoiding poor expectation spots.
You want more complete statistics on your set of strategies than what backtesting will provide. You use Great Expectations, knowing that it tests all bars in the sample that correspond to your criteria, as opposed to backtesting results which are limited to a subset of all possible entries.
You want to fool your friends into thinking you’ve designed the holy grail of indicators, something that identifies optimal opportunities on any chart; you show them the P&L cloud.
FEATURES
For one trade
At any given point on the chart, assuming a trade is entered there, Great Expectations shows you information specific to that trade simulation both on the chart and in the Data Window.
The chart can display:
the P & L Cloud which shows whether the trade ended profitably or not, and by how much,
the Opportunity & Risk Cloud which the maximum opportunity and risk the simulation encountered. When superimposed over the P & L cloud, you will see what I call the managed opportunity and risk, i.e the portion of maximum opportunity that was captured and the portion of the maximum risk that was incurred,
the target and if it was reached,
a background that uses a gradient to show different levels of trade length, P&L or how frequently the target was reached during simulation.
The Data Window displays more than 40 values on individual trades and global results. For any given trade you will know:
Entry/Exit levels, including slippage impact,
It’s outcome and duration,
P/L achieved,
The fraction of the maximum opportunity/risk managed by the trade.
For all trades
After going through all the possible trades on the chart, the indicator will provide you with a rare view of all outcomes expressed with the P&L cloud, which allows us to instantly see the most/least profitable areas of a chart using trade data as support, while also showing its relationship with the opportunity/risk encountered during the simulation. The difference between the two clouds is the managed opportunity and risk.
The Data Window will present you with numbers which we will go through later. Some of them are: average stop size, P/L, win rate, % opportunity managed, trade lengths for different types of trade outcomes and the TST (Target:Stop Travel) ratio.
Let’s see Great Expectations in action… and remember to open your Data Window!
INPUTS
Trade direction : You must first choose if you wish to look at long or short trades. Because of the way the indicator works and the amount of visual information on the chart, it is only practical to look at one type of trades at a time. The default is Longs.
Maximum trade Length (MaxL) : This is the maximum walk forward distance the simulator will go in analyzing outcomes from any given point in the past. It also determines the size of the dead zone among the chart’s last bars. A red background line identifies the beginning of the dead zone for which not enough bars have elapsed to analyze outcomes for the maximum trade length defined. If an ATR-based entry stop is used, that length is added to the wait time before beginning simulations, so that the first entry starts with a clean ATR value. On a sample of around 16000 bars, my tests show that the indicator runs into server errors at lengths of around 290, i.e. having completed ~4,6M simulation loop iterations. That is way too high a length anyways; 100 will usually be amply enough to ring out all the possibilities out of a simulation, and on shorter time frames, 30 can be enough. While making it unduly small will prevent simulations of expressing the market’s potential, the less you use, the faster the indicator will run. The default is 40.
Unrealized P&L base at End of Trade (EOT) : When a simulation ends and the trade is still open, we calculate unrealized P&L from an exit order executed from either the last in-trade stop on the previous bar, or the close of the last bar. You can readily see the impact of this selection on the chart, with the P&L cloud. The default is on the close.
Display : The check box besides the title does nothing.
Show target : Shows a green line displaying the trade’s target expressed as a multiple of X, i.e. the amplitude of the entry stop. I call this value “X” and use it as a unit to express profit and loss on a trade (some call it “R”). The line is highlighted for trades where the close reached the target during the trade, whether the trade ended in profit or loss. This is also where you specify the multiple of X you wish to use in calculating targets. The multiple is used even if targets are not displayed.
Show P&L Cloud : The cloud allows traders to see right away the profitable areas of the chart. The only line printed with the cloud is the “end of trade line” (EOT). The EOT line is the only way one can see the level where a trade ended on the chart (in the Data Window you can see it as the “Exit Fill” value). The EOT level for the trade determines if the trade ended in a profit or a loss. Its value represents one of the following:
- fill from order executed at close of bar where stop is breached during trade (which produces “Realized P/L”),
- simulation of a fill pseudo-fill at the user-defined EOT level (last close or stop level) if the trade runs its course through MaxL bars without getting stopped (producing Unrealized P/L).
The EOT line and the cloud fill print in green when the trade’s outcome is profitable and in red when it is not. If the trade was closed after breaching the stop, the line appears brighter.
Show Opportunity&Risk Cloud : Displays the maximum opportunity/risk that was present during the trade, i.e. the maximum and minimum prices reached.
Background Color Scheme : Allows you to choose between 3 different color schemes for the background gradients, to accommodate different types of chart background/candles. Select “None” if you don’t want a background.
Background source : Determines what value will be used to generate the different intensities of the gradient. You can choose trade length (brighter is shorter), Trade P&L (brighter is higher) or the number of times the target was reached during simulation (brighter is higher). The default is Trade Length.
Entry strat : The check box besides the title does nothing. The default strat is All bars, meaning a trade will be simulated from all bars not excluded by the filters where a MaxL bars future exists. For fun, I’ve included a pseudo-random entry strat (an indirect way of changing the seed is to vary the starting date of the simulation).
Show Filter State : Displays areas where the combination of filters you have selected are allowing entries. Filtering occurs as per your selection(s), whether the state is displayed or not. The effect of multiple selections is additive. The filters are:
1. Bar direction: Longs will only be entered if close>open and vice versa.
2. Rising Volume: Applies to both long and shorts.
3. Rising/falling MA of the length you choose over the number of bars you choose.
4. Custom indicator: You can feed your own filtering signal through this from another indicator. It must produce a signal of 1 to allow long entries and 0 to allow shorts.
Show Entry Stops :
1. Multiple of user-defined length ATR.
2. Fixed percentage.
3. Fixed value.
All entry stops are calculated using the entry fill price as a reference. The fill price is calculated from the current bar’s open, to which slippage is added if configured. This simulates the case where the strategy issued the entry signal on the previous bar for it to be executed at the next bar’s open.
The entry stop remains active until the in-trade stop becomes the more aggressive of the two stops. From then on, the entry stop will be ignored, unless a bar close breaches the in-trade stop, in which case the stop will be reset with a new entry stop and the process repeats.
Show In-trade stops : Displays in bright red the selected in-trade stop (be sure to read the note in this section about them).
1. ATR multiple: added/subtracted from the average of the two previous bars minimum/maximum of open/close.
2. A trailing stop with a deviation expressed as a multiple of entry stop (X).
3. A fixed percentage trailing stop.
Trailing stops deviations are measured from the highest/lowest high/low reached during the trade.
Note: There is a twist with the in-trade stops. It’s that for any given bar, its in-trade stop can hold multiple values, as each successive pass of the advancing simulation loops goes over it from a different entry points. What is printed is the stop from the loop that ended on that bar, which may have nothing to do with other instances of the trade’s in-trade stop for the same bar when visited from other starting points in previous simulations. There is just no practical way to print all stop values that were used for any given bar. While the printed entry stops are the actual ones used on each bar, the in-trade stops shown are merely the last instance used among many.
Include Slippage : if checked, slippage will be added/subtracted from order price to yield the fill price. Slippage is in percentage. If you choose to include slippage in the simulations, remember to adjust it by considering the liquidity of the markets and the time frame you’ll be analyzing.
Include Fees : if checked, fees will be subtracted/added to both realized an unrealized trade profits/losses. Fees are in percentage. The default fees work well for crypto markets but will need adjusting for others—especially in Forex. Remember to modify them accordingly as they can have a major impact on results. Both fees and slippage are included to remind us of their importance, even if the global numbers produced by the indicator are not representative of a real trading scenario composed of sequential trades.
Date Range filtering : the usual. Just note that the checkbox has to be selected for date filtering to activate.
DATA WINDOW
Most of the information produced by this indicator is made available in the Data Window, which you bring up by using the icon below the Watchlist and Alerts buttons at the right of the TV UI. Here’s what’s there.
Some of the information presented in the Data Window is standard trade data; other values are not so standard; e. g. the notions of managed opportunity and risk and Target:Stop Travel ratio. The interplay between all the values provided by Great Expectations is inherently complex, even for a static set of entry/filter/exit strats. During the constant updating which the habitual process of progressive refinement in building strategies that is the lot of strategy modelers entails, another level of complexity is no doubt added to the analysis of this indicator’s values. While I don’t want to sound like Wolfram presenting A New Kind of Science , I do believe that if you are a serious strategy modeler and spend the time required to get used to using all the information this indicator makes available, you may find it useful.
Trade Information
Entry Order : This is the open of the bar where simulation starts. We suppose that an entry signal was generated at the previous bar.
Entry Fill (including slip.) : The actual entry price, including slippage. This is the base price from which other values will be calculated.
Exit Order : When a stop is breached, an exit order is executed from the close of the bar that breached the stop. While there is no “In-trade stop” value included in the Data Window (other than the End of trade Stop previously discussed), this “Exit Order” value is how we can know the level where the trade was stopped during the simulation. The “Trade Length” value will then show the bar where the stop was breached.
Exit Fill (including slip.) : When the exit order is simulated, slippage is added to the order level to create the fill.
Chart: Target : This is the target calculated at the beginning of the simulation. This value also appear on the chart in teal. It is controlled by the multiple of X defined under the “Show Target” checkbox in the Inputs.
Chart: Entry Stop : This value also appears on the chart (the red dots under points where a trade was simulated). Its value is controlled by the Entry Strat chosen in the Inputs.
X (% Fill, including Fees) and X (currency) : This is the stop’s amplitude (Entry Fill – Entry Stop) + Fees. It represents the risk incurred upon entry and will be used to express P&L. We will show R expressed in both a percentage of the Entry Fill level (this value), and currency (the next value). This value represents the risk in the risk:reward ratio and is considered to be a unit of 1 so that RR can be expressed as a single value (i.e. “2” actually meaning “1:2”).
Trade Length : If trade was stopped, it’s the number of bars elapsed until then. The trade is then considered “Closed”. If the trade ends without being stopped (there is no profit-taking strat implemented, so the stop is the only exit strat), then the trade is “Open”, the length is MaxL and it will show in orange. Otherwise the value will print in green/red to reflect if the trade is winning/losing.
P&L (X) : The P&L of the trade, expressed as a multiple of X, which takes into account fees paid at entry and exit. Given our default target setting at 2 units of “X”, a trade that closes at its target will have produced a P&L of +2.0, i.e. twice the value of X (not counting fees paid at exit ). A trade that gets stopped late 50% further that the entry stop’s level will produce a P&L of -1.5X.
P&L (currency, including Fees) : same value as above, but expressed in currency.
Target first reached at bar : If price closed above the target during the trade (even if it occurs after the trade was stopped), this will show when. This value will be used in calculating our TST ratio.
Times Stop/Target reached in sim. : Includes all occurrences during the complete simulation loop.
Opportunity (X) : The highest/lowest price reached during a simulation, i.e. the maximum opportunity encountered, whether the trade was previously stopped or not, expressed as a multiple of X.
Risk (X) : The lowest/highest price reached during a simulation, i.e. the maximum risk encountered, whether the trade was previously stopped or not, expressed as a multiple of X.
Risk:Opportunity : The greater this ratio, the greater Opportunity is, compared to Risk.
Managed Opportunity (%) : The portion of Opportunity that was captured by the highest/low stop position, even if it occurred after a previous stop closed the trade.
Managed Risk (%) : The portion of risk that was protected by the lowest/highest stop position, even if it occurred after a previous stop closed the trade. When this value is greater than 100%, it means the trade’s stop is protecting more than the maximum risk, which is frequent. You will, however, never see close to those values for the Managed Opportunity value, since the stop would have to be higher than the Maximum opportunity. It is much easier to alleviate the risk than it is to lock in profits.
Managed Risk:Opportunity : The ratio of the two preceding values.
Managed Opp. vs. Risk : The Managed Opportunity minus the Managed Risk. When it is negative, which is most often is, it means your strat is protecting a greater portion of the risk than it captures opportunity.
Global Numbers
Win Rate(%) : Percentage of winning trades over all entries. Open trades are considered winning if their last stop/close (as per user selection) locks in profits.
Avg X%, Avg X (currency) : Averages of previously described values:.
Avg Profitability/Trade (APPT) : This measures expectation using: Average Profitability Per Trade = (Probability of Win × Average Win) − (Probability of Loss × Average Loss) . It quantifies the average expectation/trade, which RR alone can’t do, as the probabilities of each outcome (win/lose) must also be used to calculate expectancy. The APPT combine the RR with the win rate to yield the true expectancy of a strategy. In my usual way of expressing risk with X, APPT is the equivalent of the average P&L per trade expressed in X. An APPT of -1.5 means that we lose on average 1.5X/trade.
Equity (X), Equity (currency) : The cumulative result of all trade outcomes, expressed as a multiple of X. Multiplied by the Average X in currency, this yields the Equity in currency.
Risk:Opportunity, Managed Risk:Opportunity, Managed Opp. vs. Risk : The global values of the ones previously described.
Avg Trade Length (TL) : One of the most important values derived by going through all the simulations. Again, it is composed of either the length of stopped trades, or MaxL when the trade isn’t stopped (open). This value can help systems modelers shape the characteristics of the components they use to build their strategies.
Avg Closed Win TL and Avg Closed Lose TL : The average lengths of winning/losing trades that were stopped.
Target reached? Avg bars to Stop and Target reached? Avg bars to Target : For the trades where the target was reached at some point in the simulation, the number of bars to the first point where the stop was breached and where the target was reached, respectively. These two values are used to calculate the next value.
TST (Target:Stop Travel Ratio) : This tracks the ratio between the two preceding values (Bars to first stop/Bars to first target), but only for trades where the target was reached somewhere in the loop. A ratio of 2 means targets are reached twice as fast as stops.
The next values of this section are counts or percentages and are self-explanatory.
Chart Plots
Contains chart plots of values already describes.
NOTES
Optimization/Overfitting: There is a fine line between optimizing and overfitting. Tools like this indicator can lead unsuspecting modelers down a path of overfitting that often turns strategies into over-specialized beasts that do not perform elegantly when confronted to the real-world. Proven testing strategies like walk forward analysis will go a long way in helping modelers alleviate this risk.
Input tuning: Because the results generated by the indicator will vary with the parameters used in the active entry, filtering and exit strats, it’s important to realize that although it may be fun at first, just slapping the default settings on a chart and time frame will not yield optimal nor reliable results. While using ATR as often as possible (as I do in this indicator) is a good way to make strat parametrization adaptable, it is not a foolproof solution.
There is no data for the last MaxL bars of the chart, since not enough trade future has elapsed to run a simulation from MaxL bars back.
Modifying the code: I have tried to structure the code modularly, even if that entails a larger code base, so that you can adapt it to your needs. I’ve included a few token components in each of the placeholders designed for entry strategies, filters, entry stops and in-trade stops. This will hopefully make it easier to add your own. In the same spirit, I have also commented liberally.
You will find in the code many instances of standard trade management tasks that can be lifted to code TV strategies where, as I do in mine, you manage everything yourself and don’t rely on built-in Pine strategy functions to act on your trades.
Enjoy!
THANKS
To @scarf who showed me how plotchar() could be used to plot values without ruining scale.
To @glaz for the suggestion to include a Chandelier stop strat; I will.
To @simpelyfe for the idea of using an indicator input for the filters (if some day TV lets us use more than one, it will be useful in other modules of the indicator).
To @RicardoSantos for the random generator used in the random entry strat.
To all scripters publishing open source on TradingView; their code is the best way to learn.
To my trading buddies Irving and Bruno; who showed me way back how pro traders get it done.
