Highs and Lows (Previous Days Projected + Current Week & Month)Credit to Lachlan Smith created original on 31/03/15 - Edited by Elisa 30/3/19
Historical highs and lows
Includes three previous days projected onto today, plus current week and month.
Settings allow for data to be hidden after weekends for use in traditional markets. (i.e. prior 2 days not useful on a Monday)
Trader

Penunjuk Arah CryRexIndikator ini sangat Berguna Untuk Scalping Dan menentukan Arah tinggal kalian mengganti timeframe saja Bagaimana indikator ini bekerja?jadi di indikator ini ada 3 line/garis Merah,Ungu,Putih Garis merah dan ungu berfungsi sebagai support and resistance dan garis putih adalah Trend bullish/naik atau Trend Bearish atau turun Ketika harga di atas garis putih dan di barengi Oleh garis merah dan ungu itu harga Bullish yang berarti ke 3 garis itu menjadi support kalau bearish maka ke 3 garis itu menjadi resistance untuk entrynya ketika harga melewati garis putih bullish kita buy lalu ketika sampai profit tertentu kita take profitnya lalu selain memanfaatkan menembus garis putih saat harga sedang bullish lalu harga drop ke garis ungu lalu mantul berarti itu menandakan trend akan berlanjut dan bisa masuk di situ garis ini bisa juga sebagai titik stop loss yaitu di bawah garis putih sebagai titik stop lossnya untuk take profitnya kalian bisa meraba raba sendiri silahkan di coba indikatornya dan di pelajari


[AN] Traders Magic OscilatorsOscillator that determines the current trend and signals possible trend reversals.
Best used alongside Gaussian Trendlines ()

Megalodon Pro+ Short Term IsolatorMEGALODON PRO+ Short Term Isolator
Megalodon Pro+ is designed for shorter term investors.
Megalodon Pro+ is really simple to use.
Megalodon Pro+ combines 16 different back-tested indicators , that each have more than 66% win rate.
Megalodon Pro+ lets you turn on or off any setups that have been used for a better analysis.
Megalodon Pro+ works with any kind of market state, and any kind of asset.
Megalodon Pro+ can be used to set alarms as soon as a candle closes with a green or red bar.
Megalodon Pro+ has more features than any other indicator in the market, these features can also be turned off in the settings:
Looks for 6 different shorter time frame setups automatically and prints them out.
Shows Mosasaur isolator and can also show Price, Volume and Momentum isolators.
Prints green or red bar s for shorter term signals .
--------------------------------------
MEGALODON PRO+ Short Term Isolator is designed for shorter term investors!
All you have to do is:
1- Apply it on any asset with 240 minutes and 60 minutes time frame and combine it with 1 Day MEGALODON PRO+ Long Term Isolator.
2- Look for green bar confirmation on all isolators.
3- Define your stop losses.
4- Define your target before you enter.
5-Repeat.
--------------------------------------
iPyra◬
Enlighten others

Megalodon Pro+ Long Term IsolatorMEGALODON PRO+ Long Term Isolator
Megalodon Pro+ is designed for longer term and shorter term investors.
Megalodon Pro+ is really simple to use.
Megalodon Pro+ combines 16 different back-tested indicators , that each have more than 66% win rate .
Megalodon Pro+ lets you turn on or off any setups that has been used for a better analysis.
Megalodon Pro+ works with any kind of market state, and any kind of asset.
Megalodon Pro+ can be used to set alarms as soon as a candle closes with a green or red bar.
Megalodon Pro+ has more features than any other indicator in the market, these features can also be turned off in the settings :
Looks for 12 different investing setups automatically and prints them out.
Shows 2 different viewing options: Setups View that shows how many bear or bull setups are currently formed, Isolator View that shows Megalodon Price,Volume and Momentum isolators.
Prints green or red bars for longer term signals.
--------------------------------------
MEGALODON PRO+ Long Term Isolator is designed for longer term and shorter term investors!
All you have to do is:
1- Apply it on any asset with 1Day time frame and combine it with 240minutes and 60 minutes Megalodon Pro+ Short Term Isolator.
2- Look for green bar confirmation on all isolators.
3- Define your stop losses.
4- Define your target before you enter.
5-Repeat
--------------------------------------
iPyra◬
Enlighten others

Megalodon ProMEGALODON PRO
Megalodon Pro is designed for longer term investors.
Megalodon Pro is really simple to use.
Megalodon Pro combines 16 different back-tested indicators , that each have more than 66% win rate .
Megalodon Pro works with any kind of market state, and any kind of asset.
Megalodon Pro can be used to set alarms as soon as a candle closes with a green or red arrow.
Megalodon Pro has more features than any other indicator in the market, these features can also be turned off in the settings :
Looks for 12 different investing setups automatically and prints them out.
Finds and prints longer term and shorter term Fibonacci Retracement levels.
Prints Long Fibonacci levels or Short Fibonacci levels.
Finds and prints a custom Fibonacci level that you might want.
Shows overlapping Fibonacci levels for longer term and shorter term.
Overlays Bollinger Bands.
--------------------------------------
Megalodon Pro is designed for longer term investors!
All you have to do is:
1- Apply it on any asset with 1Day time frame .
2- Look for green arrow close.
3- Define your stop loss if you prefer to have it.
4- Define your target before you enter.
5-Repeat
--------------------------------------
iPyra◬
Enlighten others

RELEASE THE BEAST! Tortuga V4 FULL RELEASE!GOOD EVENING FELLOW TRADERS!
The Tortuga V.4 indicator is now fully finalized and ready for trading. This indicator utilizes a combination of momentum, volume, volatility, and price action to create top tier condition signals for both long and short positions. In the Tortuga V.4 indicator, I have updated lines of code to: make long signals more common, make long signals more precise, make short signals more precise, and make short signals more common.
If you are interested in the Tortuga V.4 indicator, shoot me a PM.
As always, trade happy!
James

WMHA IndicatorFinalized name of my new indicator - WMHA - is now for sale for $40, on a monthly subscription basis. A free 15 day trial is offered for this indicator as well. This indicator can be used on timeframes above 5 minutes and below 4 hours. On a two week mock portfolio run, the indicator was 76% successful when placing a 0.69% stop-loss. That is right, a stop loss less than 1%. The two week mock portfolio yielded 75% profit compared to your initial trading stack value, and a 15% yield of profit for overall equity. This was using no leverage. With such a successful test run, utilizing such a low stop-loss, one could use 3x-10x leverage when using this indicator to make their profits grow exponentially and successfully. More videos of the WMHA Indicator will be posted shortly, if you have any interest in subscribing to my indicator, shoot me a PM.
As always, trade on.
James

Zanatta Buy & SellThis scrypt is for Long, Shorts, Buy, Sells, Stop Loss and Make Profit.
With this I can calculate the volume x moving average x volatility and shot alerts, that can be integrated easily and execute orders at BitMEX and Bitfinex.

Derivative OscillatorCredit to Lazy Bear for the original script and Constance Brown for the indicator.
Added horizontals to better compare heights of peaks and minor format changes.

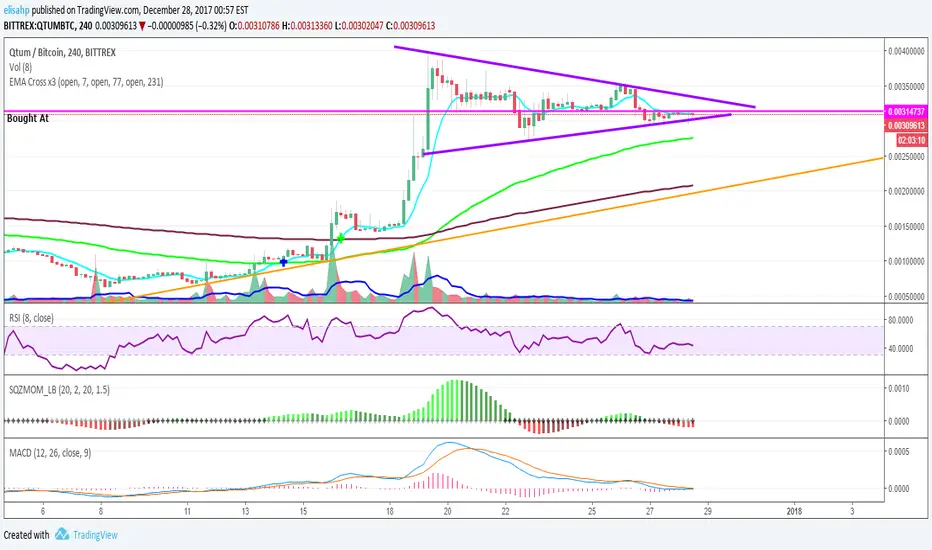
EMA Cross x3 (7, 77, 231)Exponential Moving Average at periods, 7, 77, 231. You will see a blue cross when the short EMA crosses the medium EMA, and a green cross when it crosses the long EMA.
B3 High-Low Trail-TraderSimilar to SuperTrend or the ATR trailing stop lines that are common-place in chart indicator circles, the B3 High-Low Trail-Trader works as a back-break line to flip binary long and short biasing. Here is the strategy set to 7 bars back. You can find this style of trading system in several books, and there are many ways to come to the trailing stop line, so I imagine the bars back length can be slid around to suit certain charts. This happens to be my favorite trailing line.

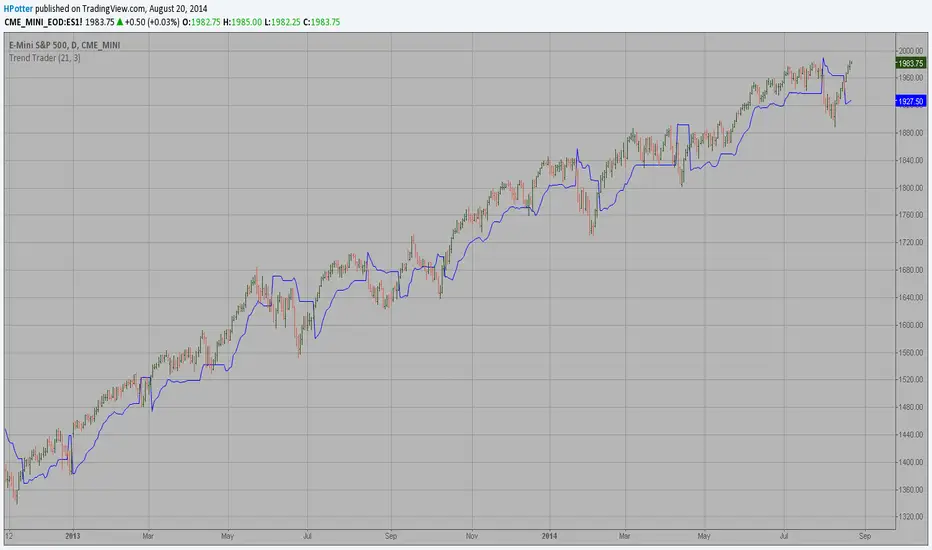
Trend Trader Strategy This is plots the indicator developed by Andrew Abraham
in the Trading the Trend article of TASC September 1998

Trend Trader This is plots the indicator developed by Andrew Abraham
in the Trading the Trend article of TASC September 1998