Moving Averages Traders StreamHello Guys this is a new set of Multiple Moving Averages with Bullish and Bearish coloured. Our Tool Includes SMA, EMA, RMA, VMA and VWMA. So if any comments than please.......
Traders
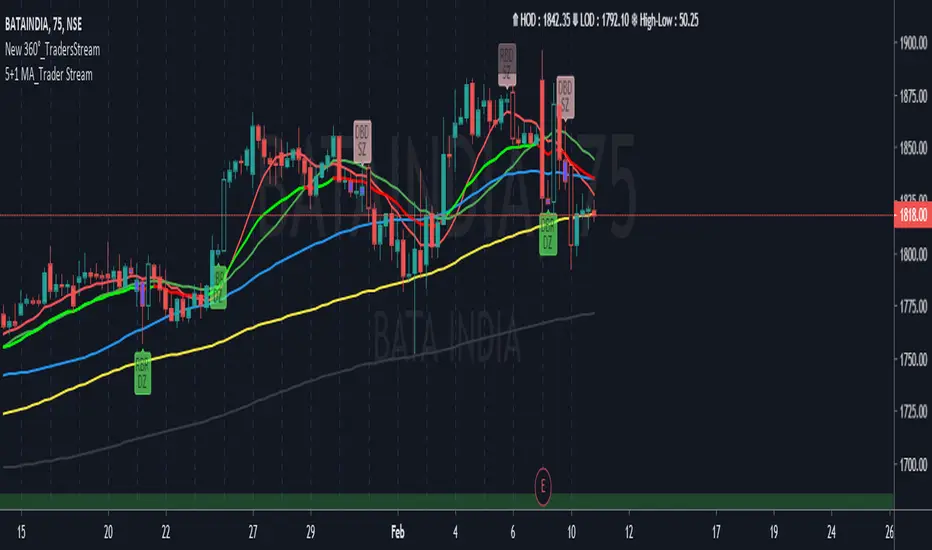
Boring & Explosive Candle TradersStreamHello Guys from now you can easily able get Boring / Basing candle and with Explosive Candle.
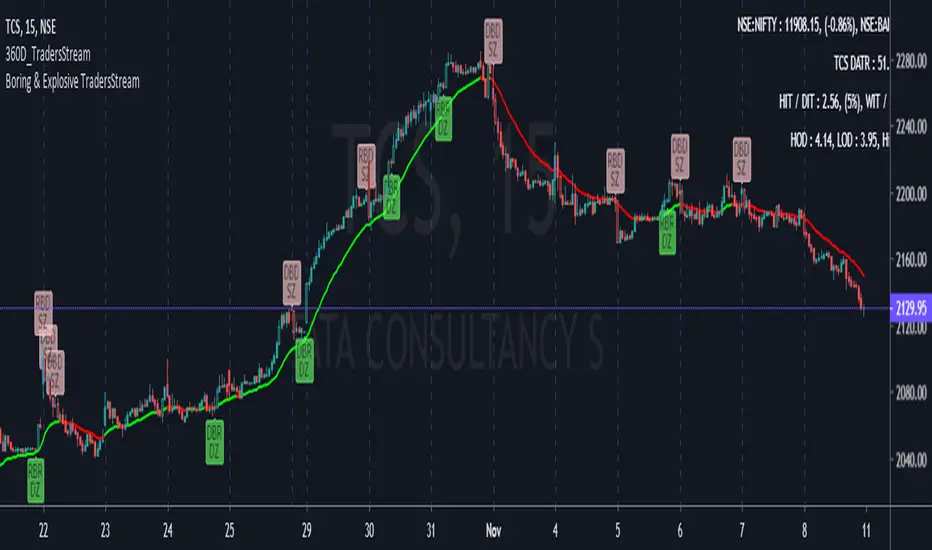
360D_TradersStreamThis is a Ultimate Tool for Trading. This tool includes
1. MA = In that you will find EMA & SMA
2. MA Length = It's Length of MA
3. Explosive Leg-out Strength = It's Explosive Candles Strength
4. RBR Pattern = Up to 6 Bases and you can minimize Base Qty.
5. DBD Pattern, DBR Pattern & RBD Pattern as we mentioned above
6. Curve Time Frame = Choose this thing so, tool can know what is your curve accordingly this it will judge your ITF & LTF
7. High of the Curve & Low of the Curve = Please enter manually the no.'s of your Upper curve & lower curve. and when changing chart don't forget make it "0"
8. Trend @ ITF = Choose your Trend. (Please choose your Trend from your ITF Time frame, to get better results)
9. Intraday Risk in % & Swing Risk in % = Calculates as per DATR
10. 1st Symbol & 2nd Symbol = To have other stocks price in your chart.
11. Tick for White Label & Un-tick for Black Label
12. Explosive Candle & Basing Candle = Tick to view Explosive & Boring candle in zone formations & Untick hide the indication
13. And finally you can change Labels Size as per your requirement,

Open Interest Rank-BuschiEnglish:
One part of the "Commitment of Traders-Report" is the Open Interest which is shown in this indicator (source: Quandl database).
Unlike my also published indicator "Open Interest-Buschi", the values here are not absolute but in a ranking system from 0 to 100 with individual time frames-
The following futures are included:
30-year Bonds (ZB)
10-year Notes ( ZN )
Soybeans (ZS)
Soybean Meal (ZM)
Soybean Oil (ZL)
Corn ( ZC )
Soft Red Winter Wheat (ZW)
Hard Red Winter Wheat (KE)
Lean Hogs (HE)
Live Cattle ( LE )
Gold ( GC )
Silver (SI)
Copper (HG)
Crude Oil ( CL )
Heating Oil (HO)
RBOB Gasoline ( RB )
Natural Gas ( NG )
Australian Dollar (A6)
British Pound (B6)
Canadian Dollar (D6)
Euro (E6)
Japanese Yen (J6)
Swiss Franc (S6)
Sugar ( SB )
Coffee (KC)
Cocoa ( CC )
Cotton ( CT )
S&P 500 E-Mini (ES)
Russell 2000 E-Mini (RTY)
Dow Jones Industrial Mini (YM)
Nasdaq 100 E-Mini (NQ)
Platin (PL)
Palladium (PA)
Aluminium (AUP)
Steel ( HRC )
Ethanol (AEZ)
Brent Crude Oil (J26)
Rice (ZR)
Oat (ZO)
Milk (DL)
Orange Juice (JO)
Lumber (LS)
Feeder Cattle (GF)
S&P 500 ( SP )
Dow Jones Industrial Average Index (DJIA)
New Zealand Dollar (N6)
Deutsch:
Ein Bestandteil des "Commitment of Traders-Report" ist das Open Interest, das in diesem Indikator dargestellt wird (Quelle: Quandl Datenbank).
Anders als in meinem ebenfalls veröffentlichten Indikator "Open Interest-Buschi" werden hier nicht die absoluten Werte dargestellt, sondern in einem Ranking-System von 0 bis 100 mit individuellen Zeitrahmen.
Folgende Futures sind enthalten:
30-jährige US-Staatsanleihen (ZB)
10-jährige US-Staatsanleihen ( ZN )
Sojabohnen(ZS)
Sojabohnen-Mehl (ZM)
Sojabohnen-Öl (ZL)
Mais( ZC )
Soft Red Winter-Weizen (ZW)
Hard Red Winter-Weizen (KE)
Magerschweine (HE)
Lebendrinder ( LE )
Gold ( GC )
Silber (SI)
Kupfer(HG)
Rohöl ( CL )
Heizöl (HO)
Benzin ( RB )
Erdgas ( NG )
Australischer Dollar (A6)
Britisches Pfund (B6)
Kanadischer Dollar (D6)
Euro (E6)
Japanischer Yen (J6)
Schweizer Franken (S6)
Zucker ( SB )
Kaffee (KC)
Kakao ( CC )
Baumwolle ( CT )
S&P 500 E-Mini (ES)
Russell 2000 E-Mini (RTY)
Dow Jones Industrial Mini (YM)
Nasdaq 100 E-Mini (NQ)
Platin (PL)
Palladium (PA)
Aluminium (AUP)
Stahl ( HRC )
Ethanol (AEZ)
Brent Rohöl (J26)
Reis (ZR)
Hafer (ZO)
Milch (DL)
Orangensaft (JO)
Holz (LS)
Mastrinder (GF)
S&P 500 ( SP )
Dow Jones Industrial Average Index (DJIA)
Neuseeland Dollar (N6)

Open Interest-Buschi
English:
One part of the "Commitment of Traders-Report" is the Open Interest which is shown in this indicator (source: Quandl database).
The following futures are included:
30-year Bonds (ZB)
10-year Notes (ZN)
Soybeans (ZS)
Soybean Meal (ZM)
Soybean Oil (ZL)
Corn (ZC)
Soft Red Winter Wheat (ZW)
Hard Red Winter Wheat(KE)
Lean Hogs (HE)
Live Cattle (LE)
Gold (GC)
Silver (SI)
Copper (HG)
Crude Oil (CL)
Heating Oil (HO)
RBOB Gasoline (RB)
Natural Gas (NG)
Australian Dollar (A6)
British Pound (B6)
Canadian Dollar (D6)
Euro (E6)
Japanese Yen (J6)
Swiss Franc (S6)
Sugar (SB)
Coffee (KC)
Cocoa (CC)
Cotton (CT)
S&P 500 E-Mini (ES)
Russell 2000 E-Mini (RTY)
Dow Jones Industrial Mini (YM)
Nasdaq 100 E-Mini (NQ)
Platin (PL)
Palladium (PA)
Aluminium (AUP)
Steel (HRC)
Ethanol (AEZ)
Brent Crude Oil (J26)
Rice (ZR)
Oat (ZO)
Milk (DL)
Orange Juice (JO)
Lumber (LS)
Feeder Cattle (GF)
S&P 500 (SP)
Dow Jones Industrial Average Index (DJIA)
New Zealand Dollar (N6)
Deutsch:
Ein Bestandteil des "Commitment of Traders-Report" ist das Open Interest, das in diesem Indikator dargestellt wird (Quelle: Quandl Datenbank).
Folgende Futures sind enthalten:
30-jährige US-Staatsanleihen (ZB)
10-jährige US-Staatsanleihen (ZN)
Sojabohnen(ZS)
Sojabohnen-Mehl (ZM)
Sojabohnen-Öl (ZL)
Mais(ZC)
Soft Red Winter-Weizen (ZW)
Hard Red Winter-Weizen (KE)
Magerschweine (HE)
Lebendrinder (LE)
Gold (GC)
Silber (SI)
Kupfer(HG)
Rohöl (CL)
Heizöl (HO)
Benzin (RB)
Erdgas (NG)
Australischer Dollar (A6)
Britisches Pfund (B6)
Kanadischer Dollar (D6)
Euro (E6)
Japanischer Yen (J6)
Schweizer Franken (S6)
Zucker (SB)
Kaffee (KC)
Kakao (CC)
Baumwolle (CT)
S&P 500 E-Mini (ES)
Russell 2000 E-Mini (RTY)
Dow Jones Industrial Mini (YM)
Nasdaq 100 E-Mini (NQ)
Platin (PL)
Palladium (PA)
Aluminium (AUP)
Stahl (HRC)
Ethanol (AEZ)
Brent Rohöl (J26)
Reis (ZR)
Hafer (ZO)
Milch (DL)
Orangensaft (JO)
Holz (LS)
Mastrinder (GF)
S&P 500 (SP)
Dow Jones Industrial Average Index (DJIA)
Neuseeland Dollar (N6)

Commercial / Open Interest-Buschi
English:
Another view the Commitment of Traders (CoT) data
Since the Commercials are often a good indicator for future market movements, I tampered a little bit with their positioning (long or short) in relation to the open interest to visualize some kind of "commercial buying (long) or selling (short) power". It's definitely nothing more than work in progress, but I decided to publish it anyway. Critical comments are mostly welcome.
Deutsch:
Ein weiterer Blick auf die Commitment of Traders (CoT) Daten
Da die Commercials häufig ein guter Indikator für zukünftige Marktbewegungen sind, habe ich ein wenig mit ihrer Positionierung (long oder short) im Verhältnis zum Open Interest herumgebastelt, um eine Art von "kommerzieller Kauf- (long) oder Verkaufs-Kraft" abzubilden. Es ist momentan noch im absoluten Teststadium, aber ich habe mich dazu entschlossen, es trotzdem zu veröffentlichen. Kritische Anmerkungen sind sehr willkommen.

Megalodon Pro+ Short Term IsolatorMEGALODON PRO+ Short Term Isolator
Megalodon Pro+ is designed for shorter term investors.
Megalodon Pro+ is really simple to use.
Megalodon Pro+ combines 16 different back-tested indicators , that each have more than 66% win rate.
Megalodon Pro+ lets you turn on or off any setups that have been used for a better analysis.
Megalodon Pro+ works with any kind of market state, and any kind of asset.
Megalodon Pro+ can be used to set alarms as soon as a candle closes with a green or red bar.
Megalodon Pro+ has more features than any other indicator in the market, these features can also be turned off in the settings:
Looks for 6 different shorter time frame setups automatically and prints them out.
Shows Mosasaur isolator and can also show Price, Volume and Momentum isolators.
Prints green or red bar s for shorter term signals .
--------------------------------------
MEGALODON PRO+ Short Term Isolator is designed for shorter term investors!
All you have to do is:
1- Apply it on any asset with 240 minutes and 60 minutes time frame and combine it with 1 Day MEGALODON PRO+ Long Term Isolator.
2- Look for green bar confirmation on all isolators.
3- Define your stop losses.
4- Define your target before you enter.
5-Repeat.
--------------------------------------
iPyra◬
Enlighten others

Megalodon Pro+ Long Term IsolatorMEGALODON PRO+ Long Term Isolator
Megalodon Pro+ is designed for longer term and shorter term investors.
Megalodon Pro+ is really simple to use.
Megalodon Pro+ combines 16 different back-tested indicators , that each have more than 66% win rate .
Megalodon Pro+ lets you turn on or off any setups that has been used for a better analysis.
Megalodon Pro+ works with any kind of market state, and any kind of asset.
Megalodon Pro+ can be used to set alarms as soon as a candle closes with a green or red bar.
Megalodon Pro+ has more features than any other indicator in the market, these features can also be turned off in the settings :
Looks for 12 different investing setups automatically and prints them out.
Shows 2 different viewing options: Setups View that shows how many bear or bull setups are currently formed, Isolator View that shows Megalodon Price,Volume and Momentum isolators.
Prints green or red bars for longer term signals.
--------------------------------------
MEGALODON PRO+ Long Term Isolator is designed for longer term and shorter term investors!
All you have to do is:
1- Apply it on any asset with 1Day time frame and combine it with 240minutes and 60 minutes Megalodon Pro+ Short Term Isolator.
2- Look for green bar confirmation on all isolators.
3- Define your stop losses.
4- Define your target before you enter.
5-Repeat
--------------------------------------
iPyra◬
Enlighten others

Megalodon ProMEGALODON PRO
Megalodon Pro is designed for longer term investors.
Megalodon Pro is really simple to use.
Megalodon Pro combines 16 different back-tested indicators , that each have more than 66% win rate .
Megalodon Pro works with any kind of market state, and any kind of asset.
Megalodon Pro can be used to set alarms as soon as a candle closes with a green or red arrow.
Megalodon Pro has more features than any other indicator in the market, these features can also be turned off in the settings :
Looks for 12 different investing setups automatically and prints them out.
Finds and prints longer term and shorter term Fibonacci Retracement levels.
Prints Long Fibonacci levels or Short Fibonacci levels.
Finds and prints a custom Fibonacci level that you might want.
Shows overlapping Fibonacci levels for longer term and shorter term.
Overlays Bollinger Bands.
--------------------------------------
Megalodon Pro is designed for longer term investors!
All you have to do is:
1- Apply it on any asset with 1Day time frame .
2- Look for green arrow close.
3- Define your stop loss if you prefer to have it.
4- Define your target before you enter.
5-Repeat
--------------------------------------
iPyra◬
Enlighten others

Commercial Index-BuschiThis simple script takes a closer look at the Commercial part of the CoT (Commitment of Traders) Data. It shows thier percentual level on given time frames (default: during the last 6 months, 3 years and 5 years).
This relative perspective is often more useful than the absolute contract numbers.


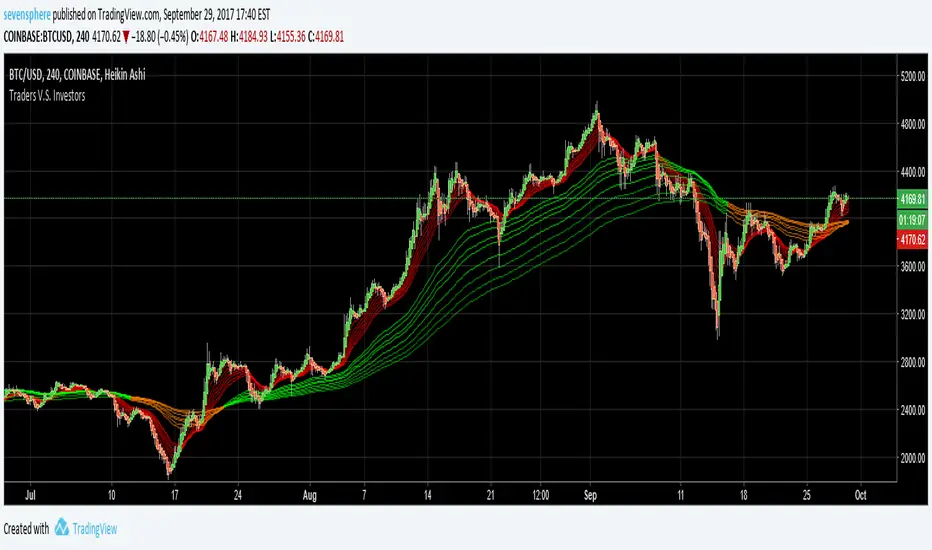
Traders V.S. InvestorsTraders are represented by red lines, they move fast
Investors are represented by green/orange lines, investors move very slow
When you see some quick moves from traders,
you can take the opposite side of the trade because you know investors
are behind you and are very slow to change position.
How to use :
When the green / orange lines are contracting, the indicator tell us that investors are changing position.
When the green /orange lines are expanded, the indicator tell us to go against trader if they go in the wrong direction.

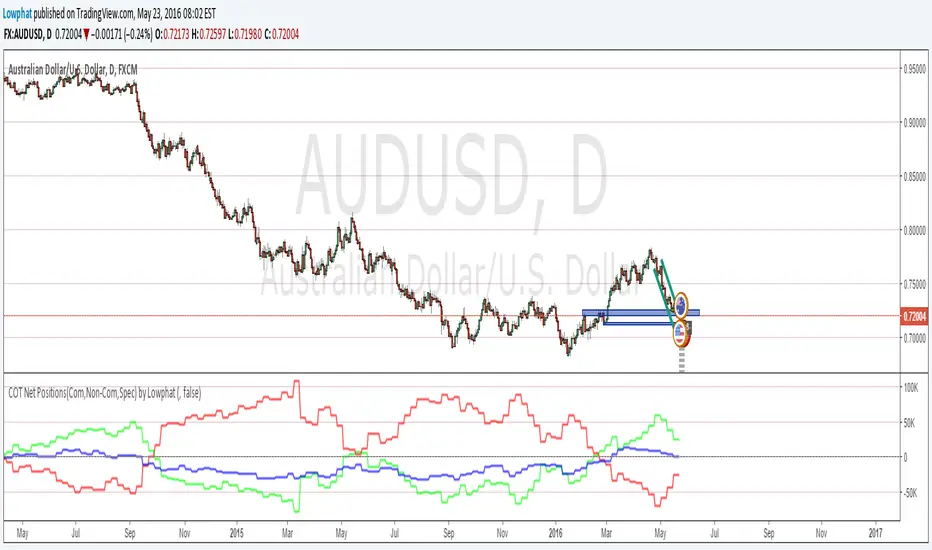
Commitments of Traders(COT) Major's noncom net (beta) By Lowphata charted commitments of traders report
of most majors on one chart.
EUR=red
GBP=blue
CHF=white
CAD=dark green
USD bright green
JPY=yellow
AUD=brown

COT Net Position's (Com,Non-Com and Spec) by LowphatCommitments of Traders with Com's Non-Com's and Spec's in one indicator.