Velocity Divergence Radar [JOAT]
Velocity Divergence Radar - Momentum Physics Edition
Overview
Velocity Divergence Radar is an open-source oscillator indicator that applies physics concepts to market analysis. It calculates price velocity (rate of change), acceleration (rate of velocity change), and jerk (rate of acceleration change) to provide a multi-dimensional view of momentum. The indicator also includes divergence detection and force vector analysis.
What This Indicator Does
The indicator calculates and displays:
Velocity - Rate of price change over a configurable period, smoothed with EMA
Acceleration - Rate of velocity change, showing momentum shifts
Jerk (3rd Derivative) - Rate of acceleration change, indicating momentum stability
Force Vectors - Volume-weighted acceleration representing market force
Kinetic Energy - Calculated as 0.5 * mass (volume ratio) * velocity squared
Momentum Conservation - Tracks momentum relative to historical average
Divergence Detection - Identifies when price and velocity diverge at pivots
How It Works
Velocity is calculated as smoothed rate of change:
calculateVelocity(series float price, simple int period) =>
float roc = ta.roc(price, period)
float velocity = ta.ema(roc, period / 2)
velocity
Acceleration is the change in velocity:
calculateAcceleration(series float velocity, simple int period) =>
float accel = ta.change(velocity, period)
float smoothAccel = ta.ema(accel, period / 2)
smoothAccel
Jerk is the change in acceleration:
calculateJerk(series float acceleration, simple int period) =>
float jerk = ta.change(acceleration, period)
float smoothJerk = ta.ema(jerk, period / 2)
smoothJerk
Force is calculated using F = m * a (mass approximated by volume ratio):
calculateForceVector(series float mass, series float acceleration) =>
float force = mass * acceleration
float forceDirection = math.sign(force)
float forceMagnitude = math.abs(force)
Signal Generation
Signals are generated based on velocity behavior:
Bullish Divergence: Price makes lower low while velocity makes higher low
Bearish Divergence: Price makes higher high while velocity makes lower high
Velocity Cross: Velocity crosses above/below zero line
Extreme Velocity: Velocity exceeds 1.5x the upper/lower zone threshold
Jerk Extreme: Jerk exceeds 2x standard deviation
Force Extreme: Force magnitude exceeds 2x average
Dashboard Panel (Top-Right)
Velocity - Current velocity value
Acceleration - Current acceleration value
Momentum Strength - Combined velocity and acceleration strength
Radar Score - Composite score based on velocity and acceleration
Direction - STRONG UP/SLOWING UP/STRONG DOWN/SLOWING DOWN/FLAT
Jerk - Current jerk value
Force Vector - Current force magnitude
Kinetic Energy - Current kinetic energy value
Physics Score - Overall physics-based momentum score
Signal - Current actionable status
Visual Elements
Velocity Line - Main oscillator line with color based on direction
Velocity EMA - Smoothed velocity for trend reference
Acceleration Histogram - Bar chart showing acceleration direction
Jerk Area - Filled area showing jerk magnitude
Vector Magnitude - Line showing combined vector strength
Radar Scan - Oscillating pattern for visual effect
Zone Lines - Upper and lower threshold lines
Divergence Labels - BULL DIV / BEAR DIV markers
Extreme Markers - Triangles at velocity extremes
Input Parameters
Velocity Period (default: 14) - Period for velocity calculation
Acceleration Period (default: 7) - Period for acceleration calculation
Divergence Lookback (default: 10) - Bars to scan for divergence
Radar Sensitivity (default: 1.0) - Zone threshold multiplier
Jerk Analysis (default: true) - Enable 3rd derivative calculation
Force Vectors (default: true) - Enable force analysis
Kinetic Energy (default: true) - Enable energy calculation
Momentum Conservation (default: true) - Enable momentum tracking
Suggested Use Cases
Identify momentum direction using velocity sign and magnitude
Watch for divergences as potential reversal warnings
Use acceleration to detect momentum shifts before price confirms
Monitor jerk for momentum stability assessment
Combine force and kinetic energy for conviction analysis
Timeframe Recommendations
Works on all timeframes. Higher timeframes provide smoother readings; lower timeframes show more granular momentum changes.
Limitations
Physics analogies are conceptual and not literal market physics
Divergence detection uses pivot-based lookback and may lag
Force calculation uses volume ratio as mass proxy
Kinetic energy is a derived metric, not actual energy
Open-Source and Disclaimer
This script is published as open-source under the Mozilla Public License 2.0 for educational purposes. It does not constitute financial advice. Past performance does not guarantee future results. Always use proper risk management.
- Made with passion by officialjackofalltrades
Tradingview

Entropy Balance Oscillator [JOAT]
Entropy Balance Oscillator - Chaos Theory Edition
Overview
Entropy Balance Oscillator is an open-source oscillator indicator that applies chaos theory concepts to market analysis. It calculates market entropy (disorder/randomness), balance (price position within range), and various chaos metrics to identify whether the market is in an ordered, chaotic, or balanced state. This helps traders understand market regime and adjust their strategies accordingly.
What This Indicator Does
The indicator calculates and displays:
Entropy - Measures market disorder using return distribution analysis
Balance - Price position within the high-low range, normalized to -1 to +1
Lyapunov Exponent - Estimates sensitivity to initial conditions (chaos indicator)
Hurst Exponent - Measures long-term memory in price series (trend persistence)
Strange Attractor - Simulated attractor points for visualization
Bifurcation Detection - Identifies potential regime change points
Chaos Index - Combined entropy and volatility score
Market Phase - Classification as CHAOS, ORDER, or BALANCED
How It Works
Entropy is calculated using return distribution:
calculateEntropy(series float price, simple int period) =>
// Calculate returns and their absolute values
// Sum absolute returns for normalization
// Apply Shannon entropy formula: -sum(p * log(p))
float entropy = 0.0
for i = 0 to array.size(returns) - 1
float prob = math.abs(array.get(returns, i)) / sumAbs
if prob > 0
entropy -= prob * math.log(prob)
entropy
Balance measures price position within range:
calculateBalance(series float high, series float low, series float close, simple int period) =>
float range = high - low
float position = (close - low) / (range > 0 ? range : 1)
float balance = ta.ema(position, period)
(balance - 0.5) * 2 // Normalize to -1 to +1
Lyapunov Exponent estimates chaos sensitivity:
lyapunovExponent(series float price, simple int period) =>
float sumLog = 0.0
for i = 1 to period
float ratio = price > 0 ? math.abs(price / price ) : 1.0
if ratio > 0
sumLog += math.log(ratio)
lyapunov := sumLog / period
Hurst Exponent measures trend persistence:
H > 0.5: Trending/persistent behavior
H = 0.5: Random walk
H < 0.5: Mean-reverting behavior
Signal Generation
Phase changes and extreme conditions generate signals:
Chaos Phase: Normalized entropy exceeds chaos threshold (default 0.7)
Order Phase: Normalized entropy falls below order threshold (default 0.3)
Extreme Chaos: Entropy exceeds 1.5x chaos threshold
Extreme Order: Entropy falls below 0.5x order threshold
Bifurcation: Variance exceeds 2x average variance
Dashboard Panel (Top-Right)
Market Phase - Current phase (CHAOS/ORDER/BALANCED)
Entropy Level - Normalized entropy value
Balance - Current balance reading (-1 to +1)
Chaos Index - Combined chaos score percentage
Volatility - Current price volatility
Lyapunov Exp - Lyapunov exponent value
Hurst Exponent - Hurst exponent value
Chaos Score - Overall chaos assessment
Status - Current market status
Visual Elements
Entropy Line - Main oscillator showing normalized entropy
Entropy EMA - Smoothed entropy for trend reference
Balance Area - Filled area showing balance direction
Chaos/Order Thresholds - Horizontal dashed lines
Lyapunov Line - Step line showing Lyapunov exponent
Strange Attractor - Circle plots showing attractor points
Phase Space - Line showing phase space reconstruction
Phase Background - Background color based on current phase
Extreme Markers - X-cross for extreme chaos, diamond for extreme order
Bifurcation Markers - Circles at potential regime changes
Input Parameters
Entropy Period (default: 20) - Period for entropy calculation
Balance Period (default: 14) - Period for balance calculation
Chaos Threshold (default: 0.7) - Threshold for chaos phase
Order Threshold (default: 0.3) - Threshold for order phase
Lyapunov Exponent (default: true) - Enable Lyapunov calculation
Hurst Exponent (default: true) - Enable Hurst calculation
Strange Attractor (default: true) - Enable attractor visualization
Bifurcation Detection (default: true) - Enable bifurcation detection
Suggested Use Cases
Identify market regime for strategy selection (trend-following vs mean-reversion)
Watch for phase changes as potential trading environment shifts
Use Hurst exponent to assess trend persistence
Monitor chaos index for volatility regime awareness
Avoid trading during extreme chaos phases
Timeframe Recommendations
Best on 1H to Daily charts. Chaos metrics require sufficient data for meaningful calculations.
Limitations
Chaos theory concepts are applied as analogies, not rigorous mathematical implementations
Lyapunov and Hurst calculations are simplified approximations
Strange attractor visualization is conceptual
Bifurcation detection uses variance as proxy
Open-Source and Disclaimer
This script is published as open-source under the Mozilla Public License 2.0 for educational purposes. It does not constitute financial advice. Past performance does not guarantee future results. Always use proper risk management.
- Made with passion by officialjackofalltrades

MTF MACD Dynamic█ MACD PULSE MTF
Multi-timeframe MACD with 4-color dynamic histogram.
█ FEATURES
- Multi-timeframe support
- 4-color histogram (trend strength + direction)
- Dynamic MACD/Signal line colors
- Cross markers for entry signals
█ HOW TO USE
HISTOGRAM COLORS:
🟢 Bright Green = Bullish momentum increasing
🟢 Teal = Bullish momentum decreasing
🔴 Bright Red = Bearish momentum increasing
🟠 Orange = Bearish momentum decreasing
SIGNALS:
- Buy: Histogram turns green + MACD crosses above signal
- Sell: Histogram turns red + MACD crosses below signal
- Circle markers show exact cross points
█ SETTINGS
- Fast EMA: 12 (default)
- Slow EMA: 26 (default)
- Signal SMA: 9 (default)
- Custom timeframe: Select any TF while on current chart
█ TIPS
- Use higher timeframe for trend direction
- Combine with support/resistance levels
- Fading colors = potential reversal warning

Momentum Edge Pro█ MOMENTUM EDGE PRO
A multi-timeframe momentum oscillator designed for scalping on lower timeframes (1m, 5m, 15m).
█ HOW IT WORKS
This indicator combines several momentum analysis techniques:
1. Dual EMA Difference - Calculates the difference between fast (8) and slow (21) exponential moving averages to measure momentum direction and strength.
2. Signal Line Smoothing - Applies a 5-period SMA to the momentum line to identify crossover opportunities.
3. Dynamic Histogram - Visualizes momentum strength with 4 distinct colors based on whether momentum is increasing or decreasing above/below zero.
4. Multi-Timeframe Confirmation - Uses a higher timeframe filter to align trades with the larger trend direction.
5. Volume Confirmation - Filters signals to only appear when volume exceeds the 20-period average by a customizable multiplier.
6. RSI Filter - Prevents long entries in overbought conditions (>70) and short entries in oversold conditions (<30).
█ SIGNAL LOGIC
CALL Signal (Green Triangle Up):
- Momentum line crosses above signal line
- Higher timeframe momentum is bullish
- Volume confirms with above-average activity
- RSI is not in overbought zone
- Histogram shows increasing bullish momentum for 2+ bars
PUT Signal (Red Triangle Down):
- Momentum line crosses below signal line
- Higher timeframe momentum is bearish
- Volume confirms with above-average activity
- RSI is not in oversold zone
- Histogram shows increasing bearish momentum for 2+ bars
Weak crosses appear as faded circles - these are filtered out and should be avoided.
█ HISTOGRAM COLORS
Bright Green: Bullish momentum increasing
Dark Green: Bullish momentum decreasing (potential reversal)
Bright Red: Bearish momentum increasing
Dark Red: Bearish momentum decreasing (potential reversal)
█ RECOMMENDED SETTINGS
For 1-minute charts: HTF = 5m
For 5-minute charts: HTF = 15m
For 15-minute charts: HTF = 1H
█ SETTINGS EXPLAINED
Core Settings:
- Fast Period: Controls sensitivity (lower = more reactive)
- Slow Period: Controls trend smoothing (higher = smoother)
- Signal Period: Controls signal line smoothing
Signal Filters:
- Min Histogram Size: Filters weak momentum (increase to reduce signals)
- Volume Multiplier: Required volume above average (1.2 = 20% above average)
- RSI Overbought/Oversold: Levels for RSI filter
█ BEST PRACTICES
1. Always confirm signals with price action
2. Use higher timeframe for trend direction
3. Avoid trading during news events
4. Fading histogram colors warn of potential reversals
5. Combine with support/resistance levels
█ ALERTS
Three alert conditions available:
- CALL Signal: Triggers on green triangle
- PUT Signal: Triggers on red triangle
- Any Signal: Triggers on either signal
To set alerts: Right-click chart → Add Alert → Select condition

Quantum Flow [JOAT]Quantum Flow Nexus - Advanced Multi-Dimensional Flow Analysis
Overview
Quantum Flow Nexus is an open-source overlay indicator that combines custom EMA-based flow calculations with order flow analysis, multi-timeframe correlation, and liquidity zone detection. It provides traders with a structured framework for analyzing market momentum and identifying potential entry points based on multiple confirming factors.
What This Indicator Does
The indicator calculates several analytical components:
Quantum Flow Oscillator - A custom oscillator built from multiple EMA layers at different depths
Flow Momentum - Rate of change of the flow oscillator
Order Flow Delta - Buy vs sell volume pressure estimation
Smart Money Index - Volume-weighted directional bias metric
Multi-Timeframe Entanglement - Price correlation across 15m and 60m timeframes
Liquidity Zones - Historical swing high/low levels with volume significance
Wave Function State - Momentum-based decisiveness detection
How It Works
The core quantum oscillator uses a custom EMA calculation with depth layering:
quantumOscillator(series float src, simple int len, simple int depth) =>
float osc = 0.0
for i = 1 to depth
int fastLen = len / i
int slowLen = len * i
float emaFast = quantumEMA(src, fastLen)
float emaSlow = quantumEMA(src, slowLen)
osc += (emaFast - emaSlow) / depth
osc
This creates a multi-layered view of momentum by comparing EMAs at progressively different speeds.
Signal Generation
Basic signals occur when:
Bullish: Flow crosses above lower band + positive momentum + positive order flow delta
Bearish: Flow crosses below upper band + negative momentum + negative order flow delta
Strong signals require additional confirmation:
Smart Money Index above/below threshold (50/-50)
Entanglement score above 50%
Wave function in collapsed state (decisive momentum)
Confluence Score Calculation
The indicator combines multiple factors into a single confluence percentage:
float confluenceScore = (flowStrength * 20 + entanglementScore * 0.3 + math.abs(orderFlowDelta) * 0.5) / 3
Dashboard Panel (Top-Right)
Flow Strength - Distance from center line normalized by standard deviation
Momentum - Current rate of change of flow
Trend - BULLISH/BEARISH/NEUTRAL based on flow vs EMA
Confluence Score - Combined factor percentage
Order Flow Delta - Buy/sell pressure percentage
Entanglement - Multi-timeframe correlation score
Wave State - COLLAPSED or SUPERPOSITION
Signal - Current actionable status
Visual Elements
Flow Lines - Center flow line with upper/lower bands
Quantum Zones - Filled areas between bands showing bullish/bearish zones
3D Quantum Field - Five oscillating layers creating depth visualization
Order Flow Blocks - Boxes highlighting significant order flow imbalances
Liquidity Heatmap - Dashed lines at significant historical levels
Signal Markers - Triangles for basic signals, labels for strong signals
Input Parameters
Flow Period (default: 21) - Base period for flow calculations
Quantum Depth (default: 3) - Number of EMA layers
Sensitivity (default: 1.5) - Band width multiplier
Liquidity Max Levels (default: 8) - Maximum liquidity zones displayed
Liquidity Min Strength Ratio (default: 0.10) - Minimum volume significance
Suggested Use Cases
Identify momentum direction using flow oscillator position
Confirm entries with order flow and smart money readings
Use liquidity zones as potential support/resistance areas
Wait for strong signals with multiple factor confirmation
Timeframe Recommendations
Effective on 15m to Daily charts. Lower timeframes may produce more signals with higher noise levels.
Limitations
Order flow is estimated from candle structure, not actual order book data
Multi-timeframe requests add processing time
Liquidity zones are based on historical pivots and may not reflect current market structure
Open-Source and Disclaimer
This script is published as open-source under the Mozilla Public License 2.0 for educational purposes. It does not constitute financial advice. Past performance does not guarantee future results. Always use proper risk management.
- Made with passion by officialjackofalltrades

Ocean Master [JOAT]Ocean Master QE - Advanced Oceanic Market Analysis with Quantum Flow Dynamics
Overview
Ocean Master QE is an open-source overlay indicator that combines multiple analytical techniques into a unified market analysis framework. It uses ATR-based dynamic channels, volume-weighted order flow analysis, multi-timeframe correlation (quantum entanglement concept), and harmonic oscillator calculations to provide traders with a comprehensive view of market conditions.
What This Indicator Does
The indicator calculates and displays several key components:
Dynamic Price Channels - ATR-adjusted upper, middle, and lower channels that adapt to current volatility conditions
Order Flow Analysis - Separates buying and selling volume pressure to calculate a directional delta
Smart Money Index - Volume-weighted order flow metric that highlights potential institutional activity
Harmonic Oscillator - Weighted combination of 10 Fibonacci-period EMAs (5, 8, 13, 21, 34, 55, 89, 144, 233, 377) to identify trend direction
Multi-Timeframe Correlation - Measures price correlation across 1H, 4H, and Daily timeframes
Wave Function Analysis - Momentum-based state detection that identifies when price action becomes decisive
How It Works
The core channel calculation uses ATR with a configurable quantum sensitivity factor:
float atr = ta.atr(i_atrLength)
float quantumFactor = 1.0 + (i_quantumSensitivity * 0.1)
float quantumATR = atr * quantumFactor
upperChannel := ta.highest(high, i_length) - (quantumATR * 0.5)
lowerChannel := ta.lowest(low, i_length) + (quantumATR * 0.5)
midChannel := (upperChannel + lowerChannel) * 0.5
Order flow is calculated by separating volume into buy and sell components based on candle direction:
The harmonic oscillator weights shorter EMAs more heavily using inverse weighting (1/1, 1/2, 1/3... 1/10), creating a responsive yet smooth trend indicator.
Signal Generation
Confluence signals require multiple conditions to align:
Bullish: Harmonic oscillator crosses above zero + positive Smart Money Index + positive Order Flow Delta
Bearish: Harmonic oscillator crosses below zero + negative Smart Money Index + negative Order Flow Delta
Dashboard Panel (Top-Right)
Bias - Current market direction based on price vs mid-channel
Entanglement - Multi-timeframe correlation score (0-100%)
Wave State - COLLAPSED (decisive) or SUPERPOSITION (uncertain)
Volume - Current volume relative to 20-period average
Volatility - ATR as percentage of price
Smart Money - Volume-weighted order flow reading
Visual Elements
Ocean Depth Layers - Gradient fills between channel levels representing different price zones
Channel Lines - Upper (surface), middle, and lower (seabed) dynamic levels
Divergence Markers - Triangle shapes when harmonic oscillator crosses zero
Confluence Labels - BULL/BEAR labels when multiple factors align
Suggested Use Cases
Identify trend direction using the harmonic oscillator and channel position
Monitor order flow for potential institutional activity
Use multi-timeframe correlation to confirm trade direction across timeframes
Watch for confluence signals where multiple factors align
Input Parameters
Length (default: 14) - Base period for channel and indicator calculations
ATR Length (default: 14) - Period for ATR calculation
Quantum Depth (default: 3) - Complexity factor for calculations
Quantum Sensitivity (default: 1.5) - Channel width multiplier
Timeframe Recommendations
Works on all timeframes. Higher timeframes (4H, Daily) provide smoother signals; lower timeframes require faster reaction times and may produce more noise.
Limitations
Multi-timeframe requests add processing overhead
Order flow estimation is based on candle direction, not actual order book data
Correlation calculations require sufficient historical data
Open-Source and Disclaimer
This script is published as open-source under the Mozilla Public License 2.0 for educational purposes. It does not constitute financial advice. Past performance does not guarantee future results. Always use proper risk management and conduct your own analysis before trading.
- Made with passion by officialjackofalltrades

SterlCore FX [JOATSterlCore FX Matrix is a multi-timeframe forex indicator that integrates market structure analysis, central bank policy proxies, currency strength correlation, session-based liquidity tracking, and volatility diagnostics into a single overlay system.
Note: This script is published as an invite-only INDICATOR. It does not generate backtesting results or automated trade execution. Access requires authorization through the script's access control settings.
## Why This Script Merits Invite-Only Protection
This indicator combines multiple analytical dimensions that individually exist as separate tools across the trading community. The value proposition lies in the specific integration methodology and composite scoring system that synthesizes:
Multi-timeframe EMA lattice with adaptive ATR channels for structure analysis
Central bank policy pressure assessment using normalized currency index calculations
Real-time currency strength matrix across eight major currencies with correlation intelligence
Session-specific VWAP calculations with drift metrics and range analysis
Composite macro confluence scoring that weights and combines all analytical modules
The proprietary elements include the mathematical weighting system for the macro confluence score, the specific normalization methods for currency strength calculations, and the integration logic that prevents conflicting signals across modules. While individual components like EMAs and RSI are standard, their specific combination, the composite scoring methodology, and the multi-module integration represent original development work that justifies source code protection.
---
## How Components Work Together
The indicator's value comes from how its modules interact, not from any single component:
Data Flow:
1. Multi-timeframe EMAs establish directional bias across strategic, tactical, and execution timeframes
2. Currency strength matrix identifies which currencies are strengthening/weakening across the broader market
3. Policy proxies assess central bank pressure differentials between base and quote currencies
4. Session VWAPs track intraday institutional positioning and drift
5. Correlation grid monitors whether related pairs confirm or contradict the current pair's signals
6. Momentum and volatility filters ensure signals only fire during favorable market conditions
Integration Logic:
Each module produces a normalized score (-1 to +1). These scores are weighted and combined into the macroConfluence composite:
Structure score receives highest weight (50%) as the primary trend filter
Carry composite (30%) captures policy-driven flows
Currency strength spread (20%) validates pair-specific momentum
Momentum, liquidity, session drift, and correlation act as modifiers that can dampen or amplify signals
Why This Integration Matters:
A standard EMA crossover might signal "buy" while currency strength shows the base currency weakening, session VWAP shows price below fair value, and correlation pairs are diverging. The composite scoring system catches these conflicts and reduces signal confidence accordingly. This multi-dimensional validation is what separates this indicator from simple mashups that display multiple indicators without integration.
---
## Core Functionality
This indicator addresses the challenge of synthesizing multiple analytical dimensions in forex trading. Currency markets operate across multiple timeframes simultaneously, with central bank policy shifts, cross-pair correlations, and session-specific liquidity patterns all influencing price action. Most indicators focus on a single dimension; this script attempts to integrate several.
What This Script Does:
Multi-timeframe structure analysis using synchronized EMAs across strategic (daily), tactical (4-hour), and execution (hourly) timeframes
Central bank policy pressure assessment through normalized currency index proxies
Real-time currency strength matrix tracking eight major currencies (USD, EUR, GBP, JPY, AUD, CAD, CHF, NZD)
Cross-pair correlation monitoring using configurable reference pairs
Session-based VWAP calculations with drift and range metrics for Asia, Europe, and US trading windows
Market structure detection including break-of-structure (BOS) confirmation, liquidity sweep identification, and RSI-based divergence alerts
Composite macro confluence score combining all modules with configurable weights
---
## Technical Architecture
### Multi-Timeframe Structure Lattice
The indicator calculates exponential moving averages (EMAs) across three timeframes:
Strategic EMA (default: Daily timeframe, 96-period EMA) — Anchors to longer-term monetary drift and macro flows
Tactical EMA (default: 4-hour timeframe, 55-period EMA) — Captures rotational pressure during positioning for economic data or policy events
Execution EMA (default: 1-hour timeframe, 21-period EMA) — Tracks microstructure in real time
An adaptive ATR-based channel surrounds the execution EMA to define a "value corridor" for entry consideration. Break-of-structure (BOS) logic requires price to close beyond prior swing highs/lows by a configurable ATR percentage threshold to reduce false breakouts.
### Policy Gradient & Carry Intelligence
The script uses currency index proxies (defaults: FX_IDC:EURUSD and FX_IDC:USDJPY ) to approximate central bank policy pressure. These proxies are smoothed via EMA and normalized over a lookback period.
The carryComposite calculation blends:
Normalized policy spread between base and quote currency proxies
Policy drift (difference between tactical and macro timeframe policy spreads)
Carry acceleration (rate of change in policy spread)
Carry opportunity signals appear when the composite exceeds a threshold and aligns with structure bias and currency strength dispersion.
### Currency Strength Matrix
Eight currency baskets are tracked using configurable symbol inputs (defaults use $FX_IDC pairs). Each currency's strength is normalized to a -1 to +1 scale relative to its lookback range. The heatmap table displays which currencies are dominating, allowing quick assessment of broad market moves before they appear in individual pair price action.
### Correlation Intelligence Grid
Three reference pairs (defaults: FX_IDC:EURUSD , FX_IDC:GBPUSD , FX_IDC:USDJPY ) are monitored on a higher timeframe. The script calculates correlation coefficients and assigns qualitative descriptors: "Lockstep +", "Aligned +", "Loose", "Aligned -", or "Lockstep -". A correlation consensus value feeds into the macro confluence calculation, dampening signals when reference pairs show conflicting behavior.
### Momentum, Volatility & Liquidity Stack
Dual ROC momentum — Fast and slow rate-of-change calculations prevent whipsaw from single-length oscillators
Volatility pulse — Compares current ATR to a slower baseline; signals require volatility above a floor threshold
Volatility forecast slope — Uses linear regression to project ATR 21 bars ahead, warning of imminent expansion or contraction
Liquidity pulse — Compares current volume to smoothed average; low participation is visually indicated via background tinting
### Session Awareness & Performance Console
Asia, Europe, and US trading sessions are tracked with configurable UTC windows. Each session maintains:
Live VWAP that resets at session open
Drift score quantifying price deviation from VWAP in ATR terms
Range percentage showing session expansion relative to VWAP
Session bias composite feeds into macro confluence to reduce signal aggression when all sessions are mean-reverting.
### Liquidity & Market Structure Suite
Liquidity sweeps — Detects stop hunts above prior highs or below prior lows within a configurable lookback
RSI divergence — Identifies momentum divergences using confirmed pivot points only
Supply/demand zones — Automatically generated from pivot highs/lows and projected forward for a set number of bars
### Macro Alignment Engine
The macroConfluence score combines:
Structure score (weighted average of strategic/tactical/execution EMAs)
Carry composite
Currency strength spread (base minus quote)
Momentum score
Liquidity modifier
Session bias composite
Correlation consensus
Long/short alignment signals require:
Macro confluence exceeding configurable threshold (default: 0.55)
Volatility pulse above floor threshold
Optional: Price above/below tactical EMA (execution filter toggle)
---
## Visual Elements
Candle Coloring: Candles are recolored based on macro confluence: teal for bullish alignment, magenta for bearish alignment, neutral gray for distribution phases.
Background Tint: Volatility intensity modulates chart background; bold colors indicate elevated ATR, washed-out tones suggest choppy conditions.
Labels:
Macro Align Long/Short — Primary entry signals when confluence exceeds threshold
BOS↑/↓ — Break-of-structure confirmation
Sweep↑/↓ — Liquidity sweep detection
RSI Bull/Bear Div — Momentum divergence alerts
Carry Bias± — Policy-strength alignment flags
Session Overlays: Transparent background shading indicates active trading sessions (Asia, Europe, US) with configurable opacity.
Session VWAPs: Each region's VWAP is plotted in a distinct color (teal for Asia, blue for Europe, purple for US).
---
## Dashboard Tables
The indicator includes several configurable information tables:
Intelligence Dashboard (top-right, default) — Displays strategic/tactical/execution bias, policy pressure, currency spread, volatility pulse, policy impulse, session drift, correlation, and macro state
Currency Heatmap (bottom-right, default) — Shows normalized strength values for all tracked currencies
Correlation Grid (bottom-left, default) — Lists reference pairs with correlation coefficients and qualitative states
Session Performance Panel (bottom-center, default) — Displays drift scores and range percentages for each session
Diagnostics Table (top-left, optional) — Additional session range metrics and liquidity pulse values
All table positions are configurable via input settings to avoid overlap with TradingView UI elements.
---
## Configuration Parameters
Multi-Timeframe Structure: All EMA timeframes and lengths are adjustable. Default strategic timeframe is Daily; tactical is 4-hour; execution is 1-hour.
Policy Proxies: Base and quote currency policy proxy symbols are user-configurable. Defaults use $FX_IDC pairs for broad compatibility.
Currency Strength: Each currency's tracking can be toggled on/off. Symbol inputs allow substitution of alternative data sources if default indices are unavailable.
Correlation References: Three reference pair symbols, timeframe, and lookback period are all configurable.
Signal Thresholds: Macro alignment trigger, volatility pulse floor, and carry opportunity threshold are adjustable to match different trading styles.
Visual Controls: Label visibility, zone display, session overlays, VWAP plotting, and all dashboard tables can be toggled independently.
---
## Technical Implementation Notes
Pine Script v6 compliant
All request.security calls use lookahead_off to prevent historical repainting
BOS, divergence, and sweep detection rely on confirmed pivot points only
Session VWAP calculations reset strictly on session boundaries
Zone objects are automatically capped and managed to respect TradingView resource limits
All calculations include division-by-zero guards and NA handling for real-time stability
---
## Usage Considerations
Timeframe Selection: The indicator is designed for forex pairs. Default timeframes (D/4H/1H) are optimized for swing and intraday trading. Scalpers may prefer shorter execution timeframes; position traders may extend strategic to weekly.
Pair Compatibility: Tested on major pairs ( FX:EURUSD , FX:GBPUSD , FX:USDJPY , OANDA:USDCHF , OANDA:AUDUSD , OANDA:USDCAD , OANDA:NZDUSD ), cross-pairs, and FX-derived CFDs. Policy proxy symbols should be adjusted to match your data feed availability.
Session Windows: Default UTC windows (Asia: 22:00-06:00, Europe: 06:00-13:00, US: 13:00-21:00) can be customized. Adjust for daylight saving time transitions as needed.
Signal Interpretation: Macro alignment signals indicate confluence across multiple dimensions but do not guarantee profitable outcomes. Use in conjunction with risk management and market context. The indicator is a tool for analysis, not a standalone trading system.
Resource Usage: With all features enabled, the script operates within TradingView's resource budgets. Disable unused modules (currency tracking, correlation grid, diagnostics) if running multiple instances on a single layout.
---
## Limitations & Compromises
Policy proxies are approximations using currency indices; actual central bank policy requires external economic analysis
Correlation calculations use price-based correlation, which may lag during regime shifts
Session VWAPs reset at session boundaries; overlapping sessions (e.g., London/NY) may show conflicting signals
Supply/demand zones are generated from pivots; false zones may appear during ranging markets
Macro confluence is a composite score; individual components may conflict, requiring discretionary interpretation
The indicator is optimized for trending and rotational markets. Performance may degrade during extended consolidation or during major economic event volatility when multiple central banks act simultaneously.
---
## Alert System
The script includes four alert conditions:
SterlCore FX Bullish Alignment — Fires when macro confluence exceeds threshold with volatility and EMA filters satisfied
SterlCore FX Bearish Alignment — Mirror of bullish logic
SterlCore FX Carry Long — Fires when carry composite, currency spread, and structure align for long bias
SterlCore FX Carry Short — Mirror of carry long logic
All alerts fire once per bar at bar close.
-Made with passion by officialjackofalltrades

CryptoFlux Dynamo [JOAT]CryptoFlux Dynamo: Velocity Scalping Strategy
WHAT THIS STRATEGY IS
CryptoFlux Dynamo is an open-source Pine Script v6 strategy designed for momentum-based scalping on cryptocurrency perpetual futures. It combines multiple technical analysis methods into a unified system that adapts its behavior based on current market volatility conditions.
This script is published open-source so you can read, understand, and modify the complete logic. The description below explains everything the strategy does so that traders who cannot read Pine Script can fully understand how it works before using it.
HOW THIS STRATEGY IS ORIGINAL AND WHY THE INDICATORS ARE COMBINED
This strategy uses well-known indicators (MACD, EMA, RSI, MFI, Bollinger Bands, Keltner Channels, ATR). The originality is not in the individual indicators themselves, but in the specific way they are integrated into a regime-adaptive system. Here is the detailed justification for why these components are combined and how they work together:
The Problem Being Solved:
Standard indicator-based strategies use fixed thresholds. For example, a typical MACD strategy might enter when the histogram crosses above zero. However, in cryptocurrency markets, volatility changes dramatically throughout the day and week. A MACD crossover during a low-volatility consolidation period has very different implications than the same crossover during a high-volatility trending period. Using the same entry thresholds and stop distances in both conditions leads to either:
Too many false signals during consolidation (if thresholds are loose)
Missing valid opportunities during expansion (if thresholds are tight)
Stops that are too tight during volatility spikes (causing premature exits)
Stops that are too wide during compression (giving back profits)
The Solution Approach:
This strategy first classifies the current volatility regime using normalized ATR (ATR as a percentage of price), then dynamically adjusts ALL other parameters based on that classification. This creates a context-aware system rather than a static threshold comparison.
How Each Component Contributes to the System:
ATR-Based Regime Classification (The Foundation)
The strategy calculates ATR over 21 periods, smooths it with a 13-period EMA to reduce noise from wicks, then divides by price to get a normalized percentage. This ATR% is classified into three regimes:
- Compression (ATR% < 0.8%): Market is consolidating, breakouts are more likely but false signals are common
- Expansion (ATR% 0.8% - 1.6%): Normal trending conditions
- Velocity (ATR% > 1.6%): High volatility, larger moves but also larger adverse excursions
This regime classification then controls stop distances, profit targets, trailing stop offsets, and signal strength requirements. The regime acts as a "meta-parameter" that tunes the entire system.
EMA Ribbon (8/21/34) - Trend Structure Detection
The three EMAs establish trend direction and structure. When EMA 8 > EMA 21 > EMA 34, the trend structure is bullish. The slope of the middle EMA (21) is calculated over 8 bars and converted to degrees using arctangent. This slope measurement quantifies trend strength, not just direction.
Why these specific periods? The 8/21/34 sequence follows Fibonacci-like spacing and provides good separation on 5-minute cryptocurrency charts. The fast EMA (8) responds to immediate price action, the mid EMA (21) represents the short-term trend, and the slow EMA (34) acts as a trend filter.
The EMA ribbon works with the regime classification: during compression regimes, the strategy requires stronger ribbon alignment before entry because false breakouts are more common.
MACD (8/21/5) - Momentum Measurement
The MACD uses faster parameters (8/21/5) than the standard (12/26/9) because cryptocurrency markets move faster than traditional markets. The histogram is smoothed with a 5-period EMA to reduce noise.
The key innovation is the adaptive histogram baseline. Instead of using a fixed threshold, the strategy calculates a rolling baseline from the smoothed absolute histogram value, then multiplies by a sensitivity factor (1.15). This means the threshold for "significant momentum" automatically adjusts based on recent momentum levels.
The MACD works with the regime classification: during velocity regimes, the histogram baseline is effectively higher because recent momentum has been stronger, preventing entries on relatively weak momentum.
RSI (21 period) and MFI (21 period) - Independent Momentum Confirmation
RSI measures momentum using price changes only. MFI (Money Flow Index) measures momentum using price AND volume. By requiring both to confirm, the strategy filters out price moves that lack volume support.
The 21-period length is longer than typical (14) to reduce noise on 5-minute charts. The trigger threshold (55 for longs, 45 for shorts) is slightly offset from 50 to require momentum in the trade direction, not just neutral readings.
These indicators work together: a signal requires RSI > 55 AND MFI > 55 for longs. This dual confirmation reduces false signals from price manipulation or low-volume moves.
Bollinger Bands (1.5 mult) and Keltner Channels (1.8 mult) - Squeeze Detection
When Bollinger Bands contract inside Keltner Channels, volatility is compressing and a breakout is likely. This is the "squeeze" condition. When the bands expand back outside the channels, the squeeze "releases."
The strategy uses a 1.5 multiplier for Bollinger Bands (tighter than standard 2.0) and 1.8 for Keltner Channels. These values were chosen to identify meaningful squeezes on 5-minute cryptocurrency charts without triggering too frequently.
The squeeze detection works with the regime classification: squeeze releases during compression regimes receive additional signal strength points because breakouts from consolidation are more significant.
Volume Impulse Detection - Institutional Participation Filter
The strategy calculates a volume baseline (34-period SMA) and standard deviation. A "volume impulse" is detected when current volume exceeds the baseline by 1.15x OR when the volume z-score exceeds 0.5.
This filter ensures entries occur when there is meaningful market participation, not during low-volume periods where price moves are less reliable.
Volume impulse is required for all entries and adds points to the composite signal strength score.
Cycle Oscillator - Trend Alignment Filter
The strategy calculates a 55-period EMA as a cycle basis, then measures price deviation from this basis as a percentage. When price is more than 0.15% above the cycle basis, the cycle is bullish. When more than 0.15% below, the cycle is bearish.
This filter prevents counter-trend entries. Long signals require bullish cycle alignment; short signals require bearish cycle alignment.
BTC Dominance Filter (Optional) - Market Regime Filter
The strategy can optionally use BTC.D (Bitcoin Dominance) as a market regime filter. When BTC dominance is rising (slope > 0.12), the market is in "risk-off" mode and long entries on altcoins are filtered. When dominance is falling (slope < -0.12), short entries are filtered.
This filter is optional because the BTC.D data feed may lag during low-liquidity periods.
How The Components Work Together (The Mashup Justification):
The strategy uses a composite scoring system where each signal pathway contributes points:
Trend Break pathway (30 points): Requires EMA ribbon alignment + positive slope + price breaks above recent structure high
Momentum Surge pathway (30 points): Requires MACD histogram > adaptive baseline + MACD line > signal + RSI > 55 + MFI > 55 + volume impulse
Squeeze Release pathway (25 points): Requires BB inside KC (squeeze) then release + momentum bias + histogram confirmation
Micro Pullback pathway (15 points): Requires shallow retracement to fast EMA within established trend + histogram confirmation + volume impulse
Additional modifiers:
+5 points if volume impulse is present, -5 if absent
+5 points in velocity regime, -2 in compression regime
+5 points if cycle is aligned, -5 if counter-trend
A trade only executes when the composite score reaches the minimum threshold (default 55) AND all filters agree (session, cycle bias, BTC dominance if enabled).
This scoring system is the core innovation: instead of requiring ALL conditions to be true (which would generate very few signals) or ANY condition to be true (which would generate too many false signals), the strategy requires ENOUGH conditions to be true, with different conditions contributing different weights based on their reliability.
HOW THE STRATEGY CALCULATES ENTRIES AND EXITS
Entry Logic:
1. Calculate current volatility regime from ATR%
2. Calculate all indicator values (MACD, EMA, RSI, MFI, squeeze, volume)
3. Evaluate each signal pathway and sum points
4. Check all filters (session, cycle, dominance, kill switch)
5. If composite score >= 55 AND all filters pass, generate entry signal
6. Calculate position size based on risk per trade and regime-adjusted stop distance
7. Execute entry with regime name as comment
Position Sizing Formula:
RiskCapital = Equity * (0.65 / 100)
StopDistance = ATR * StopMultiplier(regime)
RawQuantity = RiskCapital / StopDistance
MaxQuantity = Equity * (12 / 100) / Price
Quantity = min(RawQuantity, MaxQuantity)
Quantity = round(Quantity / 0.001) * 0.001
This ensures each trade risks approximately 0.65% of equity regardless of volatility, while capping total exposure at 12% of equity.
Stop Loss Calculation:
Stop distance is ATR multiplied by a regime-specific multiplier:
Compression regime: 1.05x ATR (tighter stops because moves are smaller)
Expansion regime: 1.55x ATR (standard stops)
Velocity regime: 2.1x ATR (wider stops to avoid premature exits during volatility)
Take Profit Calculation:
Target distance is ATR multiplied by regime-specific multiplier and base risk/reward:
Compression regime: 1.6x ATR * 1.8 base R:R * 0.9 regime bonus = approximately 2.6x ATR
Expansion regime: 2.05x ATR * 1.8 base R:R * 1.0 regime bonus = approximately 3.7x ATR
Velocity regime: 2.8x ATR * 1.8 base R:R * 1.15 regime bonus = approximately 5.8x ATR
Trailing Stop Logic:
When adaptive trailing is enabled, the strategy calculates a trailing offset based on ATR and regime:
Compression regime: 1.1x base offset (looser trailing to avoid noise)
Expansion regime: 1.0x base offset (standard)
Velocity regime: 0.8x base offset (tighter trailing to lock in profits during fast moves)
The trailing stop only activates when it would be tighter than the initial stop.
Momentum Fail-Safe Exits:
The strategy closes positions early if momentum reverses:
Long positions close if MACD histogram turns negative OR EMA ribbon structure breaks (fast EMA crosses below mid EMA)
Short positions close if MACD histogram turns positive OR EMA ribbon structure breaks
This prevents holding through momentum reversals even if stop loss hasn't been hit.
Kill Switch:
If maximum drawdown exceeds 6.5%, the strategy disables new entries until manually reset. This prevents continued trading during adverse conditions.
HOW TO USE THIS STRATEGY
Step 1: Apply to Chart
Use a 5-minute chart of a high-liquidity cryptocurrency perpetual (BTC/USDT, ETH/USDT recommended)
Ensure at least 200 bars of history are loaded for indicator stabilization
Use standard candlestick charts only (not Heikin Ashi, Renko, or other non-standard types)
Step 2: Understand the Visual Elements
EMA Ribbon: Three lines (8/21/34 periods) showing trend structure. Bullish when stacked upward, bearish when stacked downward.
Background Color: Shows current volatility regime
- Indigo/dark blue = Compression (low volatility)
- Purple = Expansion (normal volatility)
- Magenta/pink = Velocity (high volatility)
Bar Colors: Reflect signal strength divergence. Brighter colors indicate stronger directional bias.
Triangle Markers: Entry signals. Up triangles below bars = long entry. Down triangles above bars = short entry.
Dashboard (top-right): Real-time display of regime, ATR%, signal strengths, position status, stops, targets, and risk metrics.
Step 3: Interpret the Dashboard
Regime: Current volatility classification (Compression/Expansion/Velocity)
ATR%: Normalized volatility as percentage of price
Long/Short Strength: Current composite signal scores (0-100)
Cycle Osc: Price deviation from 55-period EMA as percentage
Dominance: BTC.D slope and filter status
Position: Current position direction or "Flat"
Stop/Target: Current stop loss and take profit levels
Kill Switch: Status of drawdown protection
Volume Z: Current volume z-score
Impulse: Whether volume impulse condition is met
Step 4: Adjust Parameters for Your Needs
For more conservative trading: Increase "Minimum Composite Signal Strength" to 65 or higher
For more aggressive trading: Decrease to 50 (but expect more false signals)
For higher timeframes (15m+): Increase "Structure Break Window" to 12-15, increase "RSI Momentum Trigger" to 58
For lower liquidity pairs: Increase "Volume Impulse Multiplier" to 1.3, increase slippage in strategy properties
To disable short selling: Uncheck "Enable Short Structure"
To disable BTC dominance filter: Uncheck "BTC Dominance Confirmation"
STRATEGY PROPERTIES (BACKTEST SETTINGS)
These are the exact settings used in the strategy's Properties dialog box. You must use these same settings when evaluating the backtest results shown in the publication:
Initial Capital: $100,000
Justification: This amount is higher than typical retail accounts. I chose this value to demonstrate percentage-based returns that scale proportionally. The strategy uses percentage-based position sizing (0.65% risk per trade), so a $10,000 account would see the same percentage returns with 10x smaller position sizes. The absolute dollar amounts in the backtest should be interpreted as percentages of capital.
Commission: 0.04% (commission_value = 0.04)
Justification: This reflects typical perpetual futures exchange fees. Major exchanges charge between 0.02% (maker) and 0.075% (taker). The 0.04% value is a reasonable middle estimate. If your exchange charges different fees, adjust this value accordingly. Higher fees will reduce net profitability.
Slippage: 1 tick
Justification: This is conservative for liquid pairs like BTC/USDT on major exchanges during normal conditions. For less liquid altcoins or during high volatility, actual slippage may be higher. If you trade less liquid pairs, increase this value to 2-3 ticks for more realistic results.
Pyramiding: 1
Justification: No position stacking. The strategy holds only one position at a time. This simplifies risk management and prevents overexposure.
calc_on_every_tick: true
Justification: The strategy evaluates on every price update, not just bar close. This is necessary for scalping timeframes where waiting for bar close would miss opportunities. Note that this setting means backtest results may differ slightly from bar-close-only evaluation.
calc_on_order_fills: true
Justification: The strategy recalculates immediately after order fills for faster response to position changes.
RISK PER TRADE JUSTIFICATION
The default risk per trade is 0.65% of equity. This is well within the TradingView guideline that "risking more than 5-10% on a trade is not typically considered viable."
With the 12% maximum exposure cap, even if the strategy takes multiple consecutive losses, the total risk remains manageable. The kill switch at 6.5% drawdown provides additional protection by halting new entries during adverse conditions.
The position sizing formula ensures that stop distance (which varies by regime) is accounted for, so actual risk per trade remains approximately 0.65% regardless of volatility conditions.
SAMPLE SIZE CONSIDERATIONS
For statistically meaningful backtest results, you should select a dataset that generates at least 100 trades. On 5-minute BTC/USDT charts, this typically requires:
2-3 months of data during normal market conditions
1-2 months during high-volatility periods
3-4 months during low-volatility consolidation periods
The strategy's selectivity (requiring 55+ composite score plus all filters) means it generates fewer signals than less filtered approaches. If your backtest shows fewer than 100 trades, extend the date range or reduce the minimum signal strength threshold.
Fewer than 100 trades produces statistically unreliable results. Win rate, profit factor, and other metrics can vary significantly with small sample sizes.
STRATEGY DESIGN COMPROMISES AND LIMITATIONS
Every strategy involves trade-offs. Here are the compromises made in this design and the limitations you should understand:
Selectivity vs. Opportunity Trade-off
The 55-point minimum threshold filters many potential trades. This reduces false signals but also misses valid setups that don't meet all criteria. Lowering the threshold increases trade frequency but decreases win rate. There is no "correct" threshold; it depends on your preference for fewer higher-quality signals vs. more signals with lower individual quality.
Regime Classification Lag
The ATR-based regime detection uses historical data (21 periods + 13-period smoothing). It cannot predict sudden volatility spikes. During flash crashes or black swan events, the strategy may be classified in the wrong regime for several bars before the classification updates. This is an inherent limitation of any lagging indicator.
Indicator Parameter Sensitivity
The default parameters (MACD 8/21/5, EMA 8/21/34, RSI 21, etc.) are tuned for BTC/ETH perpetuals on 5-minute charts during 2024 market conditions. Different assets, timeframes, or market regimes may require different parameters. There is no guarantee that parameters optimized on historical data will perform similarly in the future.
BTC Dominance Filter Limitations
The CRYPTOCAP:BTC.D data feed may lag during low-liquidity periods or weekends. The dominance slope calculation uses a 5-bar SMA, adding additional delay. If you notice the filter behaving unexpectedly, consider disabling it.
Backtest vs. Live Execution Differences
TradingView backtesting does not replicate actual broker execution. Key differences:
Backtests assume perfect fills at calculated prices; real execution involves order book depth, latency, and partial fills
The calc_on_every_tick setting improves backtest realism but still cannot capture sub-bar price action or order book dynamics
Commission and slippage settings are estimates; actual costs vary by exchange, time of day, and market conditions
Funding rates on perpetual futures are not modeled in backtests and can significantly impact profitability over time
Exchange-specific limitations (position limits, liquidation mechanics, order types) are not modeled
Market Condition Dependencies
This strategy is designed for trending and breakout conditions. During extended sideways consolidation with no clear direction, the strategy may generate few signals or experience whipsaws. No strategy performs well in all market conditions.
Cryptocurrency-Specific Risks
Cryptocurrency markets operate 24/7 without session boundaries. This means:
No natural "overnight" risk reduction
Volatility can spike at any time
Liquidity varies significantly by time of day
Exchange outages or issues can occur at any time
WHAT THIS STRATEGY DOES NOT DO
To be straightforward about limitations:
This strategy does not guarantee profits. Past backtest performance does not indicate future results.
This strategy does not predict the future. It reacts to current conditions based on historical patterns.
This strategy does not account for funding rates, which can significantly impact perpetual futures profitability.
This strategy does not model exchange-specific execution issues (partial fills, requotes, outages).
This strategy does not adapt to fundamental news events or black swan scenarios.
This strategy is not optimized for all market conditions. It may underperform during extended consolidation.
IMPORTANT RISK WARNINGS
Past performance does not guarantee future results. The backtest results shown reflect specific historical market conditions and parameter settings. Markets change constantly, and strategies that performed well historically may underperform or lose money in the future. A single backtest run does not constitute proof of future profitability.
Trading involves substantial risk of loss. Cryptocurrency derivatives are highly volatile instruments. You can lose your entire investment. Only trade with capital you can afford to lose completely.
This is not financial advice. This strategy is provided for educational and informational purposes only. It does not constitute investment advice, trading recommendations, or any form of financial guidance. The author is not a licensed financial advisor.
You are responsible for your own decisions. Before using this strategy with real capital:
Thoroughly understand the code and logic by reading the open-source implementation
Forward test with paper trading or very small positions for an extended period
Verify that commission, slippage, and execution assumptions match your actual trading environment
Understand that live results will differ from backtest results
Consider consulting with a qualified financial advisor
No guarantees or warranties. This strategy is provided "as is" without any guarantees of profitability, accuracy, or suitability for any purpose. The author is not responsible for any losses incurred from using this strategy.
OPEN-SOURCE CODE STRUCTURE
The strategy code is organized into these sections for readability:
Configuration Architecture: Input parameters organized into logical groups (Core Controls, Optimization Constants, Regime Intelligence, Signal Pathways, Risk Architecture, Visualization)
Helper Functions: calcQty() for position sizing, clamp01() and normalize() for value normalization, calcMFI() for Money Flow Index calculation
Core Indicator Engine: EMA ribbon, ATR and regime classification, MACD with adaptive baseline, RSI, MFI, volume analytics, cycle oscillator, BTC dominance filter, squeeze detection
Signal Pathway Logic: Trend break, momentum surge, squeeze release, micro pullback pathways with composite scoring
Entry/Exit Orchestration: Signal filtering, position sizing, entry execution, stop/target calculation, trailing stop logic, momentum fail-safe exits
Visualization Layer: EMA plots, regime background, bar coloring, signal labels, dashboard table
You can read and modify any part of the code. Understanding the logic before deployment is strongly recommended.
- Made with passion by officialjackofalltrades

Trend Strength Matrix [JOAT]Trend Strength Matrix — Multi-Timeframe Confluence Analysis System
This indicator addresses a specific analytical challenge: how to efficiently compare multiple technical measurements across different timeframes while accounting for their varying scales and interpretations. Rather than managing separate indicator windows with different scales, this tool normalizes four distinct analytical approaches to a common -1 to +1 scale and presents them in a unified matrix format.
Why This Combination Adds Value
The core problem this indicator solves is analytical fragmentation. Traders often use multiple indicators but struggle with:
1. **Scale Inconsistency**: RSI ranges 0-100, MACD has no fixed range, ADX ranges 0-100 but measures strength not direction
2. **Timeframe Coordination**: Checking multiple timeframes requires switching between charts or cramming multiple indicators
3. **Cognitive Load**: Processing different indicator types simultaneously creates mental overhead
4. **Confluence Assessment**: Determining when multiple approaches agree requires manual comparison
This indicator specifically addresses these issues by creating a standardized analytical framework where different measurement approaches can be directly compared both within and across timeframes.
Originality and Technical Innovation
While the individual components (RSI, MACD, ADX, Moving Average) are standard, the originality lies in:
1. **Unified Normalization System**: Each component is mathematically transformed to a -1 to +1 scale using component-specific normalization that preserves the indicator's core characteristics
2. **Multi-Timeframe Weighting Algorithm**: Higher timeframes receive proportionally more weight (40% current, 25% next, 20% third, 15% fourth) based on the principle that longer timeframes provide more significant context
3. **Real-Time Confluence Scoring**: The composite calculation provides an instant assessment of how much the different analytical approaches agree
4. **Adaptive Visual Encoding**: The heatmap format allows immediate pattern recognition of agreement/disagreement across both indicators and timeframes
How the Components Work Together
Each component measures a different aspect of market behavior, and their combination provides a more complete analytical picture:
**Momentum Component (RSI-based)**: Measures the velocity of price changes by comparing average gains to losses
**Trend Component (MACD-based)**: Measures the relationship between fast and slow moving averages, indicating trend acceleration/deceleration
**Strength Component (ADX-based)**: Measures trend strength regardless of direction, then applies directional bias
**Position Component (MA-based)**: Measures price position relative to a reference average
The mathematical relationship between these components creates a comprehensive view:
- When all four agree (similar colors), it suggests multiple analytical approaches are aligned
- When they disagree (mixed colors), it highlights analytical uncertainty or transition periods
- The composite score quantifies the degree of agreement numerically
Detailed Component Analysis
**1. Momentum Oscillator Component**
This component transforms RSI into a centered oscillator by subtracting 50 and dividing by 50, creating a -1 to +1 range where 0 represents equilibrium between buying and selling pressure.
// Momentum calculation normalized to -1 to +1 scale
float rsi = ta.rsi(close, rsiLength)
float rsiScore = (rsi - 50) / 50
// Result: 0 at equilibrium, +1 at extreme overbought, -1 at extreme oversold
**2. Moving Average Convergence Component**
MACD is normalized by its own volatility (standard deviation) to create a bounded oscillator. This prevents the unbounded nature of MACD from dominating the composite calculation.
// MACD normalized by its historical volatility
= ta.macd(close, macdFast, macdSlow, macdSignal)
float macdStdev = ta.stdev(macdLine, 100)
float macdScore = macdStdev != 0 ? math.max(-1, math.min(1, macdLine / (macdStdev * 2))) : 0
**3. Directional Movement Component**
This combines ADX (strength) with directional movement (+DI vs -DI) to create a directional strength measurement. ADX alone shows strength but not direction; this component adds directional context.
// ADX-based directional strength
= calcADX(adxLength)
float adxStrength = math.min(adx / 50, 1) // Normalize ADX to 0-1
float adxDirection = plusDI > minusDI ? 1 : -1 // Direction bias
float adxScore = adxStrength * adxDirection // Combine strength and direction
**4. Price Position Component**
This measures price deviation from a moving average, weighted by the magnitude of deviation to distinguish between minor and significant displacements.
// Price position relative to moving average
float ma = ta.sma(close, maLength)
float maDirection = close > ma ? 1 : -1
float maDeviation = math.abs(close - ma) / ma * 10 // Percentage deviation scaled
float maScore = math.max(-1, math.min(1, maDirection * math.min(maDeviation, 1)))
Multi-Timeframe Integration Logic
The multi-timeframe system uses a weighted average that gives more influence to higher timeframes:
// Timeframe weighting system
float currentTF = composite * 0.40 // Current timeframe: 40%
float higherTF1 = composite_tf2 * 0.25 // Next higher: 25%
float higherTF2 = composite_tf3 * 0.20 // Third higher: 20%
float higherTF3 = composite_tf4 * 0.15 // Fourth higher: 15%
float multiTFComposite = currentTF + higherTF1 + higherTF2 + higherTF3
This weighting reflects the principle that higher timeframes provide more significant context for market direction, while lower timeframes provide timing precision.
What the Dashboard Shows
The heatmap displays a grid where:
Each row represents a timeframe
Each column shows one component's normalized reading
Colors indicate the value: green shades for positive, red shades for negative, gray for neutral
The rightmost column shows the composite average for that timeframe
Visual Elements
Moving Average Line — A simple moving average plotted on the price chart
Background Tint — Subtle coloring based on the composite score
Shift Labels — Markers when the composite crosses threshold values
Dashboard Table — The main heatmap display
Inputs
Calculation Parameters:
Momentum Length (default: 14)
MACD Fast/Slow/Signal (default: 12/26/9)
Directional Movement Length (default: 14)
Moving Average Length (default: 50)
Timeframe Settings:
Enable/disable multi-timeframe analysis
Select additional timeframes to display
How to Read the Display
Similar colors across a row indicate the components are showing similar readings
Mixed colors indicate the components are showing different readings
The composite percentage shows the average of all four components
Alerts
Composite crossed above/below threshold values
Strong readings (above 50% or below -50%)
Important Limitations and Realistic Expectations
This indicator displays current analytical conditions—it does not predict future price movements
Agreement between components indicates current analytical alignment, not future price direction
All four components are based on historical price data and inherently lag price action
Market conditions can change rapidly, making current readings irrelevant
Different parameter settings will produce different readings and interpretations
No combination of technical indicators can reliably predict future market behavior
Strong readings in one direction do not guarantee continued movement in that direction
The composite score reflects mathematical relationships, not market fundamentals or sentiment
This tool should be used as one input among many in a comprehensive analytical approach
Appropriate Use Cases
This indicator is designed for:
- Analytical organization and efficiency
- Multi-timeframe confluence assessment
- Pattern recognition in indicator relationships
- Educational study of how different analytical approaches relate
- Supplementary analysis alongside other methods
This indicator is NOT designed for:
- Standalone trading signals
- Guaranteed profit generation
- Market timing precision
- Replacement of fundamental analysis
- Automated trading systems
— Made with passion by officialjackofalltrades

Volatility Squeeze Pro [JOAT]
Volatility Squeeze Pro — Advanced Volatility Compression Analysis System
This indicator addresses a specific analytical challenge in volatility analysis: how to identify periods when different volatility measurements show compression relationships that may indicate potential energy buildup in the market. It combines two distinct volatility calculation methods—standard deviation-based bands and ATR-based channels—with a momentum oscillator to provide comprehensive volatility state analysis.
Why This Combination Provides Unique Analytical Value
Traditional volatility indicators typically focus on single measurements, but markets exhibit different types of volatility that require different analytical approaches:
1. **Closing Price Volatility** (Standard Deviation): Measures how much closing prices deviate from their average
2. **Trading Range Volatility** (ATR): Measures the actual high-to-low trading ranges
3. **Directional Momentum**: Measures where price sits within its recent range
The problem with using these individually:
- Standard deviation alone doesn't account for intraday volatility
- ATR alone doesn't consider closing price clustering
- Momentum alone doesn't provide volatility context
- No single measurement captures the complete volatility picture
This indicator's originality lies in creating a comprehensive volatility analysis system that:
**Identifies Volatility Compression**: When closing price volatility contracts inside trading range volatility, it suggests potential energy buildup
**Provides Momentum Context**: Shows directional bias during compression periods
**Offers Multi-Dimensional Analysis**: Combines three different analytical approaches into one coherent system
**Delivers Real-Time Assessment**: Continuously monitors the relationship between different volatility types
Technical Innovation and Originality
While individual components (Bollinger Bands, Keltner Channels, Linear Regression) are standard, the innovation lies in:
1. **Volatility Relationship Detection**: The mathematical comparison between standard deviation bands and ATR channels creates a unique compression identification system
2. **Integrated Momentum Analysis**: Linear regression-based momentum calculation provides directional context specifically during volatility compression periods
3. **Multi-State Visualization**: The indicator provides clear visual encoding of different volatility states (compressed vs. normal) with momentum direction
4. **Adaptive Threshold System**: The squeeze detection automatically adapts to different instruments and timeframes without manual calibration
How the Components Work Together Analytically
The three components create a comprehensive volatility analysis framework:
**Standard Deviation Component**: Measures closing price dispersion around the mean
float bbBasis = ta.sma(close, bbLength)
float bbDev = bbMult * ta.stdev(close, bbLength)
float bbUpper = bbBasis + bbDev
float bbLower = bbBasis - bbDev
**ATR Channel Component**: Measures actual trading range volatility
float kcBasis = ta.ema(close, kcLength)
float kcRange = ta.atr(atrLength)
float kcUpper = kcBasis + kcRange * kcMult
float kcLower = kcBasis - kcRange * kcMult
**Squeeze Detection Logic**: Identifies when closing price volatility compresses within trading range volatility
bool squeezeOn = bbLower > kcLower and bbUpper < kcUpper
// This condition indicates closing prices are clustering more tightly
// than the typical trading range would suggest
**Momentum Context Component**: Provides directional bias during compression
float highestHigh = ta.highest(high, momLength)
float lowestLow = ta.lowest(low, momLength)
float momentum = ta.linreg(close - math.avg(highestHigh, lowestLow), momLength, 0)
float momSmooth = ta.sma(momentum, smoothLength)
The analytical relationship creates a system where:
- Squeeze detection identifies WHEN volatility compression occurs
- Momentum analysis shows WHERE price is positioned during compression
- Combined analysis provides both timing and directional context
How the Volatility Comparison Works
The indicator compares two volatility measurements:
Standard Deviation Bands
These measure how much closing prices deviate from their average. When prices cluster tightly around the average, the bands contract.
// Standard deviation bands calculation
float bbBasis = ta.sma(close, bbLength)
float bbDev = bbMult * ta.stdev(close, bbLength)
float bbUpper = bbBasis + bbDev
float bbLower = bbBasis - bbDev
ATR-Based Channels
These measure volatility using Average True Range—the typical distance between high and low prices. They respond to the actual trading range rather than closing price dispersion.
// ATR-based channels calculation
float kcBasis = ta.ema(close, kcLength)
float kcRange = ta.atr(atrLength)
float kcUpper = kcBasis + kcRange * kcMult
float kcLower = kcBasis - kcRange * kcMult
The Squeeze Condition
A "squeeze" is detected when the standard deviation bands are completely contained within the ATR channels:
// Squeeze detection
bool squeezeOn = bbLower > kcLower and bbUpper < kcUpper
This condition indicates that closing price volatility has compressed relative to the overall trading range.
The Momentum Component
The momentum oscillator measures where price sits relative to its recent high-low range, using linear regression for smoothing:
// Momentum calculation
float highestHigh = ta.highest(high, momLength)
float lowestLow = ta.lowest(low, momLength)
float momentum = ta.linreg(close - math.avg(highestHigh, lowestLow), momLength, 0)
float momSmooth = ta.sma(momentum, smoothLength)
Positive values indicate price is above the midpoint of its recent range; negative values indicate below.
Why Display Both Together
The squeeze detection shows WHEN volatility is compressed. The momentum reading shows the current directional bias of price within that compression. Together, they provide two pieces of information:
1. Is volatility currently compressed? (squeeze status)
2. Where is price leaning within the current range? (momentum)
These are observations about current conditions, not predictions about future movement.
Visual Elements
Momentum Histogram — Bars showing momentum value
- Green shades: Positive momentum (price above range midpoint)
- Red shades: Negative momentum (price below range midpoint)
- Brighter colors: Momentum increasing
- Faded colors: Momentum decreasing
Squeeze Dots — Circles on the zero line
- Red: Squeeze condition active
- Green: No squeeze condition
Release Markers — Triangle markers when squeeze condition ends
Dashboard — Current readings and status
Color Scheme
Squeeze Active — #FF5252 (red)
No Squeeze — #4CAF50 (green)
Momentum Positive — #00E676 / #81C784 (green shades)
Momentum Negative — #FF5252 / #E57373 (red shades)
Inputs
Standard Deviation Bands:
Length (default: 20)
Multiplier (default: 2.0)
ATR Channels:
Length (default: 20)
Multiplier (default: 1.5)
ATR Period (default: 10)
Momentum:
Length (default: 12)
Smoothing (default: 3)
How to Read the Display
Red dots indicate the squeeze condition is present
Green dots indicate normal volatility relationship
Histogram direction shows current momentum bias
Histogram color brightness shows whether momentum is increasing or decreasing
Alerts
Squeeze condition started
Squeeze condition ended
Squeeze ended with positive momentum
Squeeze ended with negative momentum
Extended squeeze (8+ bars)
Important Limitations and Realistic Expectations
Volatility compression detection is a mathematical relationship between calculations—it does not predict future price movements
Many compression periods do not result in significant price expansion or directional moves
Momentum direction during compression does not reliably indicate future breakout direction
This indicator analyzes current and historical volatility conditions only—it cannot predict future volatility
False signals are common—not every squeeze leads to tradeable price movement
Different parameter settings will produce different compression detection sensitivity
Market conditions, news events, and fundamental factors often override technical volatility patterns
No volatility indicator can predict the timing, direction, or magnitude of future price movements
This tool should be used as one component of comprehensive market analysis
Appropriate Use Cases
This indicator is designed for:
- Volatility state analysis and monitoring
- Educational study of volatility relationships
- Multi-dimensional volatility assessment
- Supplementary analysis alongside other technical tools
- Understanding market compression/expansion cycles
This indicator is NOT designed for:
- Standalone trading signal generation
- Guaranteed breakout prediction
- Automated trading system triggers
- Market timing precision
- Replacement of fundamental analysis
Understanding Volatility Analysis Limitations
Volatility analysis, while useful for understanding market conditions, has inherent limitations:
- Past volatility patterns do not guarantee future patterns
- Compression periods can extend much longer than expected
- Expansion periods may be brief and insufficient for trading
- External factors (news, fundamentals) often override technical patterns
- Different markets and timeframes exhibit different volatility characteristics
— Made with passion by officialjackofalltrades

Smart Money Fluid [JOAT]
Smart Money Fluid — Accumulation and Distribution Flow Analysis
Smart Money Fluid tracks institutional-style accumulation and distribution patterns using a sophisticated combination of Money Flow Index, Chaikin Money Flow, and VWAP-relative price analysis. It aims to reveal whether larger participants may be accumulating (buying) or distributing (selling)—information that can precede significant price moves.
What Makes This Indicator Unique
Unlike single money flow indicators, Smart Money Fluid:
Combines three different money flow methodologies into one composite signal
Detects divergences between price and money flow automatically
Identifies high-volume conditions that add conviction to signals
Provides both the composite signal and individual component values
Features a momentum histogram showing flow acceleration
What This Indicator Does
Combines multiple money flow indicators into a composite signal (0-100 scale)
Identifies accumulation zones (potential institutional buying) and distribution zones (potential selling)
Detects divergences between price and money flow
Highlights high-volume conditions for stronger signals
Tracks momentum direction within the flow
Provides comprehensive dashboard with all component values
Composite Calculation Explained
The Smart Money Flow composite combines three proven money flow methodologies:
// Component 1: Money Flow Index (MFI) - 40% weight
// Measures buying/selling pressure using price and volume
float mfi = 100 - (100 / (1 + mfRatio))
// Component 2: Chaikin Money Flow (CMF) - 30% weight
// Measures accumulation/distribution based on close position within range
float cmf = sum(mfVolume, length) / sum(volume, length) * 100
// Component 3: VWAP Price Strength - 30% weight
// Measures price position relative to volume-weighted average price
float priceVsVWAP = (close - vwap) / vwap * 100
// Final Composite (scaled to 0-100)
float rawSMF = (mfi * 0.4 + (cmf + 50) * 0.3 + (50 + priceVsVWAP * 5) * 0.3)
float smf = ta.ema(rawSMF, smoothLength)
State Classification
Accumulating (Green Zone) — SMF above accumulation threshold (default: 60). Suggests institutional buying may be occurring.
Distributing (Red Zone) — SMF below distribution threshold (default: 40). Suggests institutional selling may be occurring.
Neutral (Gray Zone) — SMF between thresholds. No clear accumulation or distribution detected.
Divergence Detection
The indicator automatically detects divergences using pivot analysis:
Bullish Divergence — Price makes a lower low while SMF makes a higher low. This suggests selling pressure is weakening despite lower prices—potential reversal signal.
Bearish Divergence — Price makes a higher high while SMF makes a lower high. This suggests buying pressure is weakening despite higher prices—potential reversal signal.
Divergences are marked with "DIV" labels on the chart.
Visual Features
SMF Line with Glow — Main composite line with gradient coloring and glow effect
Signal Line — Slower EMA of SMF for crossover signals
Flow Momentum Histogram — Shows the difference between SMF and signal line with four-color coding:
- Bright green: Positive and accelerating
- Faded green: Positive but decelerating
- Bright red: Negative and accelerating
- Faded red: Negative but decelerating
Zone Backgrounds — Green tint in accumulation zone, red tint in distribution zone
Reference Lines — Dashed lines at accumulation/distribution thresholds, dotted line at 50
Strong Signal Markers — Triangles appear when accumulation/distribution occurs with high volume
Divergence Labels — "DIV" markers when divergences are detected
Color Scheme
Accumulation Color — Default: #00E676 (bright green)
Distribution Color — Default: #FF5252 (red)
Neutral Color — Default: #9E9E9E (gray)
Gradient Coloring — SMF line transitions smoothly between colors based on value
Dashboard Information
The on-chart table (top-right corner) displays:
Current SMF value with state coloring
State classification (ACCUMULATING, DISTRIBUTING, or NEUTRAL)
Flow momentum direction (Up/Down with magnitude)
MFI component value
CMF component value with directional coloring
Volume status (High or Normal)
Active divergence detection (Bullish, Bearish, or None)
Inputs Overview
Calculation Settings:
Money Flow Length — Period for flow calculations (default: 14, range: 5-50)
Smoothing Length — EMA smoothing period (default: 5, range: 1-20)
Divergence Lookback — Bars for pivot detection in divergence analysis (default: 5, range: 2-20)
Sensitivity:
Accumulation Threshold — Level above which accumulation is detected (default: 60, range: 50-90)
Distribution Threshold — Level below which distribution is detected (default: 40, range: 10-50)
High Volume Multiplier — Multiple of average volume for "high volume" classification (default: 1.5x, range: 1.0-3.0)
Visual Settings:
Accumulation/Distribution/Neutral Colors — Customizable color scheme
Show Flow Histogram — Toggle momentum histogram
Show Divergences — Toggle divergence detection and labels
Show Dashboard — Toggle the information table
Show Zone Background — Toggle colored backgrounds in accumulation/distribution zones
Alerts:
Await Bar Confirmation — Wait for bar close before triggering (recommended)
How to Use It
For Trend Confirmation:
Accumulation during uptrends confirms buying pressure
Distribution during downtrends confirms selling pressure
Divergence between price trend and SMF warns of potential reversal
For Reversal Detection:
Bullish divergence at price lows suggests potential bottom
Bearish divergence at price highs suggests potential top
Strong signals (triangles) with high volume add conviction
For Entry Timing:
Enter longs when SMF crosses into accumulation zone
Enter shorts when SMF crosses into distribution zone
Wait for high volume confirmation for stronger signals
Use divergences as early warning for position management
Alerts Available
SMF Accumulation Started — SMF entered accumulation zone
SMF Distribution Started — SMF entered distribution zone
SMF Strong Accumulation — Accumulation with high volume
SMF Strong Distribution — Distribution with high volume
SMF Bullish Divergence — Bullish divergence detected
SMF Bearish Divergence — Bearish divergence detected
Best Practices
High volume during accumulation/distribution adds significant conviction
Divergences are early warnings—don't trade them alone
Use in conjunction with price action and support/resistance
Works best on liquid markets with reliable volume data
This indicator is provided for educational purposes. It does not constitute financial advice. Past performance does not guarantee future results. Always conduct your own analysis and use proper risk management before making trading decisions.
— Made with passion by officialjackofalltrades

Neural Trend Engine [JOAT]Neural Trend Engine - Multi-Layer Adaptive Trend Detection
Neural Trend Engine uses a multi-layer filtering approach inspired by neural network concepts. It combines multiple adaptive moving averages with proprietary momentum and volatility weighting to generate trend signals with reduced lag and improved confidence scoring.
Why This Script is Protected
This script is published as closed-source to protect the proprietary signal composition algorithm and the specific weighting methodology from unauthorized republishing. The unique combination of adaptive layer calculations, momentum normalization, and volatility integration represents original work that goes beyond standard indicator implementations.
What Makes This Indicator Unique
Unlike simple moving average crossover systems, Neural Trend Engine:
Uses three Kaufman Adaptive Moving Averages (KAMA) that automatically adjust their smoothing based on market efficiency
Combines layer alignment, momentum, and volatility into a single "neural signal"
Provides signal strength percentages so you know the conviction level of each signal
Creates a visual trend cloud that makes direction immediately obvious
What This Indicator Does
Plots three adaptive moving average "layers" that respond dynamically to market efficiency
Creates a trend cloud between fast and slow layers for visual trend identification
Generates weighted composite signals from layer alignment, momentum, and volatility
Displays buy/sell labels with signal strength percentages
Provides a comprehensive dashboard with multi-component breakdown
Colors the neural line and cloud based on current trend direction
Core Methodology
The indicator employs a three-layer adaptive system where each layer responds to market conditions at different speeds:
Fast Layer (default: 8) — Quick response for short-term direction changes
Medium Layer (default: 21) — Intermediate trend reference
Slow Layer (default: 55) — Long-term trend anchor
Each layer uses efficiency-based adaptation, meaning they become more responsive during trending conditions and smoother during choppy markets.
The neural signal is a proprietary composite that weighs three distinct market components:
Momentum Component (default: 40%) — Measures directional price velocity, normalized to its recent range
Trend Component (default: 35%) — Evaluates alignment between the three adaptive layers
Volatility Component (default: 25%) — Incorporates market volatility state into signal generation
These components are combined using a weighted formula that has been calibrated to balance responsiveness with noise reduction.
Signal Generation
Direction changes occur when the smoothed neural signal crosses a configurable strength threshold:
Bullish — Signal exceeds positive threshold with layer alignment confirmation
Bearish — Signal drops below negative threshold with layer alignment confirmation
Neutral — Signal remains within threshold range, indicating consolidation
Signal strength percentages indicate the conviction level of each signal, helping traders assess trade quality. Higher percentages suggest stronger trend conviction.
Visual Features
Trend Cloud — Filled area between fast and slow layers, colored by trend direction
Neural Line with Glow — Weighted average of all three layers with glow effect
Medium Layer — Subtle white line showing intermediate trend
Signal Labels — BUY/SELL labels with strength percentages at signal points
Small Markers — Alternative triangle markers when labels are disabled
Color Scheme
Bullish Color — Default: #26A69A (teal green) — Used for bullish trends and signals
Bearish Color — Default: #EF5350 (red) — Used for bearish trends and signals
Cloud Fill — 85% transparent version of trend color
Neural Line Glow — 60% transparent version for glow effect
Dashboard Information
The on-chart table (top-right corner) displays:
Current direction (BULLISH, BEARISH, or NEUTRAL)
Neural signal percentage
Layer alignment status (ALIGNED UP, ALIGNED DOWN, or MIXED)
Momentum direction and percentage
Trend strength percentage
Inputs Overview
Neural Layers:
Fast Layer — Period for fast adaptive MA (default: 8, range: 2-50)
Medium Layer — Period for medium adaptive MA (default: 21, range: 5-100)
Slow Layer — Period for slow adaptive MA (default: 55, range: 10-200)
Source — Price source for calculations (default: close)
Sensitivity:
Momentum Weight — Weight for momentum component (default: 0.4)
Trend Weight — Weight for trend/layer alignment (default: 0.35)
Volatility Weight — Weight for volatility component (default: 0.25)
ATR Period — Period for volatility calculations (default: 14)
Visual Settings:
Bullish/Bearish Colors — Customizable color scheme
Show Trend Cloud — Toggle the filled cloud area
Show Signal Labels — Toggle BUY/SELL labels with percentages
Show Neural Line — Toggle the main trend line
Show Dashboard — Toggle the information table
Alerts:
Await Bar Confirmation — Wait for bar close before triggering (recommended)
Min Signal Strength — Threshold for direction changes (default: 0.3 = 30%)
How to Use It
For Trend Following:
Follow the trend cloud color for overall market direction
Enter long when cloud turns bullish (teal) and signal strength is high
Enter short when cloud turns bearish (red) and signal strength is high
Use the neural line as a trailing stop reference
For Signal Trading:
Wait for BUY/SELL labels to appear
Check the signal strength percentage—higher is better
Confirm with dashboard showing aligned layers
Avoid signals during MIXED layer alignment
For Confirmation:
Use Neural Trend Engine to confirm signals from other systems
Strong confirmation when all three layers are aligned
Dashboard shows momentum and trend strength for additional context
Alerts Available
NTE Buy Signal — Bullish direction change detected
NTE Sell Signal — Bearish direction change detected
NTE Direction Change — Any trend direction change
Best Practices
Higher signal strength percentages indicate more reliable signals
Wait for layer alignment (shown in dashboard) before entering trades
Use on higher timeframes for more reliable trend identification
Combine with support/resistance levels for entry timing
This indicator is provided for educational purposes. It does not constitute financial advice. Past performance does not guarantee future results. Always conduct your own analysis and use proper risk management before making trading decisions.
— Made with passion by officialjackofalltrades

Iridescent Liquidity Prism [JOAT]Iridescent Liquidity Prism | Peer Momentum HUD
A multi-layered order-flow indicator that combines microstructure analysis, smart-money footprint detection, and intermarket momentum signals. The script uses dynamic color-shifting themes to visualize liquidity patterns, structure, and peer momentum data directly on the chart.
There is so much to choose from inside the settings, if you think it's a mess on the chart it's because you have to personally customize it based on your needs...
Core Functionality
The indicator calculates and displays several analytical layers simultaneously:
Order-Flow Imbalance (OFI): Calculates buy vs. sell volume pressure using volume-weighted price distribution within each bar. Uses an EMA filter (default: 55 periods) to smooth the signal. Values are normalized using standard deviation to identify significant imbalances.
Smart Money Footprints: Detects accumulation and distribution zones by comparing volume rate of change (ROC) against price ROC. When volume ROC exceeds a threshold (default: 65%) and price ROC is positive, accumulation is detected. When volume ROC is high but price ROC is negative, distribution is detected.
Fractal Structure Mapping: Identifies pivot highs and lows using a fractal detection algorithm (default: 5-bar period). Maintains a rolling window of recent structure points (default: 4 levels) and draws connecting lines to show trend structure.
Fair Value Gap (FVG) Detection: Automatically detects price gaps where three consecutive candles create an imbalance. Bullish FVGs occur when the current low exceeds the high two bars ago. Bearish FVGs occur when the current high is below the low two bars ago. Gaps persist for a configurable duration (default: 320 bars) and fade when price fills the gap.
Liquidity Void Detection: Identifies candles where the high-low range exceeds an ATR threshold (default: 1.7x ATR) while volume is below average (default: 65% of 20-bar average). These conditions suggest areas where liquidity may be thin.
Price/Volume Divergence: Uses linear regression to detect when price trend direction disagrees with volume trend direction. A divergence alert appears when price is trending up while volume is trending down, or vice versa.
Peer Momentum Heatmap (PMH): Calculates composite momentum scores for up to 6 symbols across 4 timeframes. Each score combines RSI (default: 14 periods) and StochRSI (default: 14 periods, 3-bar smooth) to create a momentum composite between -1 and +1. The highest absolute momentum score across all combinations is displayed in the HUD.
Custom settings using Fractal Pivots, Skeleton Structure, Pulse Liquidity Voids, Bottom Colorful HeatMaps, and Iridescent Field.
---
Visual Components
Spectrum Aura Glow: ATR-weighted bands (default: 0.25x ATR) that expand and contract around price action, indicating volatility conditions. The thickness adapts to market volatility.
Chromatic Flow Trail: A blended line combining EMA and WMA of price (default: 8-period EMA blended with WMA at 65% ratio). The trail uses gradient colors that shift based on a phase oscillator, creating an iridescent effect.
Volume Heat Projection: Creates horizontal volume profile bands at price levels (default: 14 levels). Scans recent bars (default: 150 bars) to calculate volume concentration. Each level is colored based on its volume density relative to the maximum volume level.
Structure Skeleton: Dashed lines connecting fractal pivot points. Uses two layers: a primary line (2-3px width) and an optional glow overlay (4-5px width) for enhanced visibility.
Fractal Markers: Diamond shapes placed at pivot high and low points. Color-coded: primary color for highs, secondary color for lows.
Iridescent Color Themes: Five color themes available: Iridescent (default), Pearlescent, Prismatic, ColorShift, and Metallic. Colors shift dynamically using a phase oscillator that cycles through the color spectrum based on bar index and a speed multiplier (default: 0.35).
---
HUD Console Metrics
The right-side HUD displays seven key metrics:
Flow: Shows OFI status: ▲ FLOW BUY when normalized OFI exceeds imbalance threshold (default: 2.2), ▼ FLOW SELL when below -2.2, or ◆ FLOW BAL when balanced.
Struct: Structure trend bias: ▲ STRUCT BULL when microtrend > 2, ▼ STRUCT BEAR when < -2, or ◆ STRUCT RANGE when neutral.
Smart$: Institutional activity: ◈ ACCUM when smart money index = 1, ◈ DISTRIB when = -1, or ○ IDLE when inactive.
Liquid: Liquidity state: ⚡ VOID when a liquidity void is detected, or ● NORMAL otherwise.
Diverg: Divergence status: ⚠ ALERT when price/volume divergence detected, or ✓ CLEAR when aligned.
PMH: Peer Momentum Heatmap status: Shows dominant timeframe and momentum score. Displays 🪩 for bull surge (above 0.55 threshold) or 🧨 for bear surge (below -0.55).
FVG: Fair Value Gap status: Shows active gap count or CLEAR when no gaps exist. Displays GAP LONG when bullish gap detected, GAP SHORT when bearish gap detected.
Pearlscent Color with Volume Heatmap.
Parameters and Settings
Microstructure Engine:
Analysis Depth: 20-250 bars (default: 55) - Controls OFI smoothing period
Liquidity Threshold ATR: 1.0-4.0 (default: 1.7) - Multiplier for void detection
Imbalance Ratio: 1.5-6.0 (default: 2.2) - Standard deviations for OFI significance
Smart Money Layer:
Smart Money Window: 10-150 bars (default: 24) - Period for ROC calculations
Accumulation Threshold: 40-95% (default: 65%) - Volume ROC threshold
Structural Mapping:
Fractal Pivot Period: 3-15 bars (default: 5) - Period for pivot detection
Structure Memory: 2-8 levels (default: 4) - Number of structure points to track
Volume Heat Projection:
Heat Map Lookback: 60-400 bars (default: 150) - Bars to analyze for volume profile
Heat Map Levels: 5-30 levels (default: 14) - Number of price level bands
Heat Map Opacity: 40-100% (default: 92%) - Transparency of heat map boxes
Heat Map Width Limit: 6-80 bars (default: 26) - Maximum width of heat map boxes
Heat Map Visibility Threshold: 0.0-0.5 (default: 0.08) - Minimum density to display
Iridescent Enhancements:
Visual Theme: Iridescent, Pearlescent, Prismatic, ColorShift, or Metallic
Color Shift Speed: 0.05-1.00 (default: 0.35) - Speed of color phase oscillation
Aura Thickness (ATR): 0.05-1.0 (default: 0.25) - Multiplier for aura band width
Chromatic Trail Length: 2-50 bars (default: 8) - Period for trail calculation
Trail Blend Ratio: 0.1-0.95 (default: 0.65) - EMA/WMA blend percentage
FVG Persistence: 50-600 bars (default: 320) - Bars to keep FVG boxes active
Max Active FVG Boxes: 10-200 (default: 40) - Maximum boxes on chart
FVG Base Opacity: 20-95% (default: 80%) - Transparency of FVG boxes
Peer Momentum Heatmap:
Peer Symbols: Comma-separated list of up to 6 symbols (e.g., "BTCUSD,ETHUSD")
Peer Timeframes: Comma-separated list of up to 4 timeframes (default: "60,240,D")
PMH RSI Length: 5-50 periods (default: 14)
PMH StochRSI Length: 5-50 periods (default: 14)
PMH StochRSI Smooth: 1-10 periods (default: 3)
Super Momentum Threshold: 0.2-0.95 (default: 0.55) - Threshold for surge detection
Clarity & Readability:
Liquidity Void Opacity: 5-90% (default: 30%)
Smart Money Footprint Opacity: 5-90% (default: 35%)
HUD Background Opacity: 40-95% (default: 70%)
Iridescent Field:
Field Opacity: 20-100% (default: 86%) - Background color intensity
Field Smooth Length: 10-200 bars (default: 34) - Smoothing for background gradient
---
Alerts
The indicator provides seven alert conditions:
Liquidity Void Detected - Triggers when void conditions are met
Strong Order Flow - Triggers when normalized OFI exceeds imbalance ratio
Smart Money Activity - Triggers when accumulation or distribution detected
Price/Volume Divergence - Triggers when divergence conditions occur
Structure Shift - Triggers when structure polarity changes significantly
PMH Bull Surge - Triggers when PMH exceeds positive threshold (if enabled)
PMH Bear Surge - Triggers when PMH exceeds negative threshold (if enabled)
Bull/Bear Prismatic FVG - Triggers when new FVG is detected (if FVG display enabled)
---
Usage Considerations
Performance may vary on lower timeframes due to the volume heat map calculations scanning multiple bars. Consider reducing heat map lookback or levels if experiencing slowdowns.
The PMH feature requires data requests to other symbols/timeframes, which may impact performance. Limit the number of peer symbols and timeframes for optimal performance.
FVG boxes automatically expire after the persistence period to prevent chart clutter. The maximum box limit (default: 40) prevents excessive memory usage.
Color themes affect all visual elements. Choose a theme that provides good contrast with your chart background.
The indicator is designed for overlay display. All visual elements are positioned relative to price action.
Structure lines are drawn dynamically as new pivots form. On fast-moving markets, structure may update frequently.
Volume calculations assume typical volume data availability. Symbols without volume may show incomplete data for volume-dependent features.
---
Technical Notes
Built on Pine Script v6 with dynamic request capability for PMH functionality.
Uses exponential moving averages (EMA) and weighted moving averages (WMA) for trail calculations to balance responsiveness and smoothness.
Volume profile calculation uses price level buckets. Higher levels provide finer granularity but require more computation.
Iridescent color engine uses a phase oscillator with sine wave calculations for smooth color transitions.
Box management includes automatic cleanup of expired boxes to maintain performance.
All visual elements use color gradients and transparency for smooth blending with price action.
---
Customization Examples
Intraday Scalping Setup:
Analysis Depth: 30 bars
Heat Map Lookback: 100 bars
FVG Persistence: 150 bars
PMH Window: 15 bars
Fast color shift speed: 0.5+
Macro Structure Tracking:
Analysis Depth: 100+ bars
Heat Map Lookback: 300+ bars
FVG Persistence: 500+ bars
Structure Memory: 6-8 levels
Slower color shift speed: 0.2
---
Limitations
Volume heat map calculations may be computationally intensive on lower timeframes with high lookback values.
PMH requires valid symbol names and accessible timeframes. Invalid symbols or timeframes will return no data.
FVG detection requires at least 3 bars of history. Early bars may not show FVG boxes.
Structure lines connect points but do not predict future structure. They reflect historical pivot relationships.
Color themes are aesthetic choices and do not affect calculation logic.
The indicator does not provide trading signals. All visual elements are analytical tools that require interpretation in context of market conditions.
Open Source
This indicator is open source and available for modification and distribution. The code is published with Pine Script v6 compliance. Users are free to customize parameters, modify calculations, and adapt the visual elements to their trading needs.
For questions, suggestions, or anything please talk to me in private messages or comments below!
Would love to help!
- officialjackofalltrades

Auto TrendLine ProAuto TrendLine Pro is a smart, automated trendline tool designed for traders who value quality over quantity.
Most indicators draw too many lines, making the chart messy and confusing. This engine solves that by filtering out the " noise. " It hunts for mathematically precise connections between market pivots. It gives you a clean view of the strongest Support and Resistance levels that the market is actually respecting.
Menu Options Explained
Here is how you can control the indicator using the settings menu:
1. Swing Length
This setting controls the "eyes" of the engine—how it finds the Highs and Lows.
Swing Length determines how far back the engine looks.
Small numbers (1 or 2): It finds more short-term swings.
Big numbers(3 to 10): It ignores small moves and only looks for major market turns.
2. Trendline Strength
This shows how strong the trendline is. 1 is a good score for a valid trendline. If you increase this number you will get stronger trendlines.
3. Touch Threshold
How strict should the engine be?
Low value: Very strict. Price must touch the line perfectly.
High value: More relaxed. Near-misses are counted as touches.
4. Breakout Threshold
This prevents false alarms. If a candle wick pokes through the line just a little bit but closes back inside, this setting tells the engine to ignore it and keep the trendline alive.
5. Source
This controls where a trendline starts.
Wick: The line must start at the very tip of the candle's Wick (High/Low). This usually gives the most precise touches.
Body: The line starts from the candle's Body (Close). This is usually recommended for line charts.
Best Match(Recommended): The engine tries both and picks the one that fits the math better.
6. Display Mode
This controls how many lines you see on the screen.
Oldest Line: Shows only the single best Support and Resistance line.
Recent Lines: Shows the top 2 or 3 best lines.
Only Specific Line: Shows only a specific line(e.g., only the 2nd best line).
7. Lines to Display
This option controls exactly how many trendlines appear on your chart at the same time, such as showing only the single oldest line or the top 3. It helps declutter your view by hiding weaker lines so you can focus only on the most critical support and resistance levels.
Trendline Types:
1. Confirmed Trendlines
These are solid, established lines that have been tested by price enough times to be locked in as reliable barriers. Unlike live lines, they are permanent and will not disappear or move, providing a trustworthy reference for Support and Resistance.
2. Live Trendlines
These are tentative lines that have just started to form but have not been fully confirmed yet. They show you potential setups early, but they are risky because they might disappear if the price invalidates them before they become strong.
3. Broadening Trendlines
Broadening Trendlines open up wider like a Loudspeaker as they move forward, instead of squeezing together like a normal triangle.
4. Freeze on Live
This option stops the trendlines from moving or flickering while the current candle is still forming. The lines will only update once the candle finishes and closes, keeping your chart stable. Trade-off: You are sacrificing Real-time Reaction to get Stability.
Breached Trendlines, Visuals and Alerts are self Explanatory.
Future updates will have lots of other features.
⚠️ DISCLAIMER
This indicator is for educational purposes only and does not constitute financial advice. Trading involves substantial risk of loss. Past performance does not guarantee future results. Use at your own risk.
© Auto TrendLine Pro - All rights reserved. Copying, redistribution, or reverse-engineering is prohibited without written consent.

INSTITUTIONAL MOMENTUM [@Ash_TheTrader]⚡ The Impulse Engine: Institutional Velocity & Smart Structure System
Subtitle/Short Description: Stop looking at just Open and Close. Visualize the speed of price action, detect institutional footprints, and trade off dynamic "living" market structure that flips and burns automatically. Developed by @Ash_TheTrader.
The Hidden Dimension of Price Action
Most traders look at a standard candlestick and see four data points: Open, High, Low, and Close.
But this hides the most critical information: The struggle.
Did the buyers step in aggressively in the first 5 minutes, pushing price to highs instantly? (Institutional buying)
Or did it take 59 minutes of slow, grinding effort to reach that high? (Retail exhaustion/Trap)
Standard candles look identical in both scenarios. The Impulse Engine, developed by @Ash_TheTrader, solves this by visualizing the "Speed of Price" (Velocity) directly onto your chart, combined with a state-of-the-art, dynamic market structure system.
It’s not just an indicator; it’s a complete market X-ray.
1. The Velocity Painter: See the Speed ⚡
The core of this system is the Velocity Engine. It looks "inside" your current timeframe bar (using lower timeframe data) to calculate how fast price traveled to its extremes.
It paints the bars based on institutional urgency, allowing you to ignore the noise and focus on the momentum.
The Visual Code:
⚡ NEON CYAN (Bullish Impulse) : Aggressive buying. Price ripped from the open to the high very quickly. This is where the smart money is stepping on the gas.
⚡ NEON MAGENTA (Bearish Impulse): Aggressive selling. Price crashed from the open to the low immediately.
💤 FADED GREY (Exhaustion/Trap): The "grind." Price took a long time to reach its extremes. These are often low-momentum environments or potential traps waiting to reverse.
STANDARD GREEN/RED: Normal market flow with no significant velocity extremes.
"Trade the Neon, Ignore the Grey." — @Ash_TheTrader
2. Smart Structure: "Living" Levels 🏗️
Old-school pivot indicators clutter your chart with endless historical lines that are no longer relevant. The Impulse Engine uses a "Living Structure" algorithm that manages the lifecycle of every support and resistance level.
It only shows you the two most relevant Resistance levels (R1, R2) above price, and the two most relevant Support levels (S1, S2) below price.
Risk-Based Classification:
You choose the structure based on your trading style in the settings:
Scalp Mode: Detects short-term, 5-bar swings. (Thin dotted lines).
Trend Mode: Detects standard trend swings (21-bar). (Dashed lines).
Major Swing: Detects deep, major structural points (60-bar). (Thick solid lines).
The "Flip & Burn" Mechanic (Viral Feature) 🔥
This is where the system gets smart. It understands market mechanics:
The Flip (Role Reversal): If a Resistance level is broken by a candle close, it automatically turns Gold and becomes Support (Flip). The same applies to Support turning into Resistance. You no longer need to guess if an old level will hold from the other side.
The Burn (Auto-Cleaning): If a "Flipped" level is broken again, the system recognizes it has lost its structural integrity. The line is instantly "burned" (removed from the chart).
This ensures your chart only ever shows levels that are active and respected.
3. Whale Signs: The Footprint of Big Money 🐋
Sometimes, velocity isn't enough. You need to see raw power.
The Whale Sign feature detects massive expansions in volatility. It flags any candle whose range is significantly larger (default 2x) than the average of the previous two candles.
💚 Green Triangle + $ (Below Bar): A massive bullish expansion candle. A "Wake Up" call for longs.
❤️ Red Triangle + $ (Above Bar): A massive bearish expansion candle. A warning sign for shorts.
These often precede sustained velocity moves.
4. The Pro HUD (Heads-Up Display) 💻
In the bottom right corner, the dynamic HUD gives you a real-time health check of the current candle.
Status Header: Instantly tells you if the current candle is IMPULSE, EXHAUSTION, or NORMAL.
Live Velocity %: The exact speed score. The text color changes to Neon during impulses and fades to grey during exhaustion.
Mode Info: Reminds you which risk setting you are currently using (e.g., Mode: ).
Signature: The official @Ash_TheTrader stamp of quality.
How to Trade With The Impulse Engine
This system is designed for confluence. Never trade a signal in isolation.
📈 Strategy 1 : The "Velocity Bounce" (Trend Continuation)
Ensure the market is trending (e.g., making higher highs).
Wait for price to pull back to a Smart Support level (Cyan dashed line or Gold "Flip" line).
Trigger: Look for a Neon Cyan Impulse Candle to form right off that support level. This confirms institutions are defending the structure with speed.
📉 Strategy 2: The "Whale Breakout"
Identify a consolidation zone below a Smart Resistance level.
Trigger: A Whale Sign ($) appears on a candle that successfully closes above the Resistance level.
Confirmation: The very next candle should ideally be a Neon Impulse candle continuing the move.
Conclusion
The markets are moved by aggression and speed. By obscuring this data, standard charts put you at a disadvantage.
The Impulse Engine brings this hidden data to the forefront, combining institutional velocity detection with smart, automated market structure that reacts to price just like a professional trader would.
Trade faster, trade smarter.
Developed by @Ash_TheTrader.
(Disclaimer: This tool is for informational purposes only and does not constitute financial advice. Always manage your risk.)

SNP420/TRCS_MASTERMicro Body Candle Highlighter is a visual tool for TradingView that continuously scans the active timeframe and highlights all candles with an extremely small body.
For every bar (including the currently forming one), the indicator compares the absolute distance between Open and Close to a user-defined threshold in ticks (default: 1 tick, based on syminfo.mintick).
If the candle’s body size is less than or equal to this threshold, the indicator draws a red frame around the candle – either around the body only or the full high-to-low range, depending on user settings.
Optionally, the indicator can also trigger alerts whenever such a “micro body” candle is detected, allowing traders to react immediately to potential indecision, pauses, or micro-reversals in price action.
author: SNP_420
project: FNXS
ps: Piece and love

Friday & Monday HighlighterFriday & Monday Institutional Range Marker — Know Where Big Firms Set the Trap!
🧠 Description
This indicator automatically highlights Friday and Monday sessions on your chart — days when institutional players and algorithmic firms (like Citadel, Jane Street, or Tower Research) quietly shape the upcoming week’s price structure.
🔍 Why Friday & Monday matter
Friday : Large institutions often book profits or hedge into the weekend. Their final-hour moves reveal the next week’s bias.
Monday : Big players rebuild positions, absorbing liquidity left behind by retail traders.
Together, these two days define the range traps and breakout zones that often control price action until midweek.
> In short, the Friday–Monday high and low often act as invisible walls — guiding scalpers, option sellers, and swing traders alike.
🧩 What this tool does
✅ Highlights Friday (red) and Monday (green) sessions
✅ Adds optional day labels above bars
✅ Works across all timeframes (best on 15min to 1hr charts)
✅ Helps you visually identify where institutions likely built their positions
Use it to quickly spot:
* Range boundaries that trap traders
* Gap zones likely to get filled
* High–low sweeps before reversals
⚙️ Recommended Use
1. Mark Friday’s high–low → Watch for liquidity sweeps on Monday.
2. When Monday holds above Friday’s high , breakout continuation is likely.
3. When Monday fails below Friday’s low , expect a reversal or trap.
4. Combine this with OI shifts, IV crush, and FII–DII flow data for confirmation.
⚠️ Disclaimer
This indicator is for **educational and analytical purposes only**.
It does **not constitute financial advice** or a trading signal.
Markets are dynamic — always perform your own research before trading or investing.

SMA Vertical OffsetThis Indicator allow you to adjust the SMA offset vertically instead of horizontally
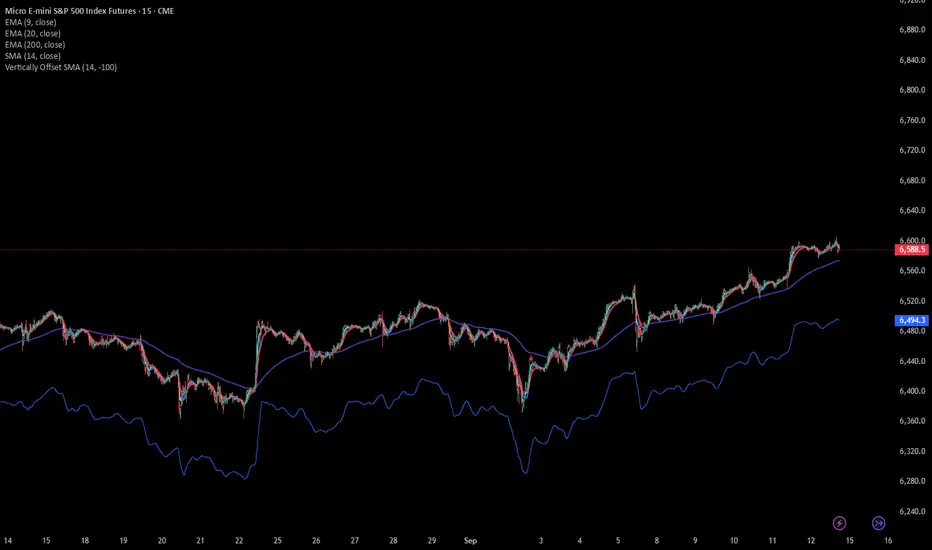
STRATEGY WITH POINT TP/SL BY SKBTSThe formula for the standard middle band is simply a moving average, often set to 20 periods:
Middle Band = 20-period moving average (close)
The upper and lower bands are calculated from the standard deviation, which measures how dispersed the price data is from the average.
Upper Band = Middle Band + (2 standard deviations of 20-period close)
Lower Band = Middle Band - (2 standard deviations of 20-period close)
The key inputs are the 20-period moving average, the number of standard deviations (typically 2), and the 20-period standard deviation. The bands will expand and contract based on the standard deviation value.
Some traders increase the standard deviation multiplier to 2.1 or 2.2 to make the bands looser and more sensitive. Decreasing the number of periods for the moving average and standard deviation will also increase sensitivity.
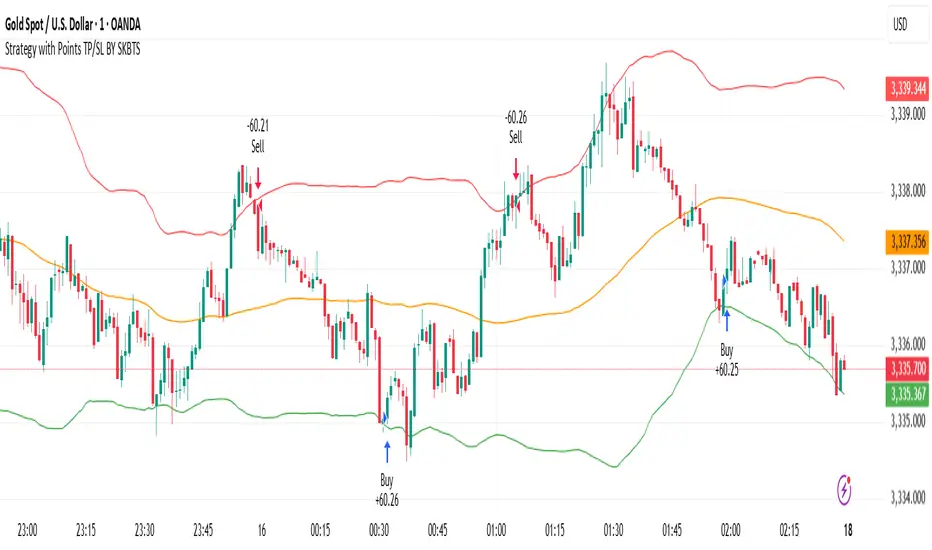
TCP | Market Session | Session Analyzer📌 TCP | Market Session Indicator | Crypto Version
A powerful, real-time market session visualization tool tailored for crypto traders. Track the heartbeat of Asia, Europe, and US trading hours directly on your chart with live session boxes, behavioral analysis, liquidity grab detection, and countdown timers. Know when the action starts, how the market behaves, and where the traps lie.
🔰 Introduction:
Trade the Right Hours with the Right Tools
Time matters in trading. Most significant moves happen during key sessions—and knowing when and how each session unfolds can give you a sharp edge. The TCP Market Session Indicator, developed by Trade City Pro (TCP), puts professional session tracking and behavioral insights at your fingertips.
Whether you're a scalper or swing trader, this indicator gives you the timing context to enter and exit trades with greater confidence and clarity.
🕒 Core Features
• Live Session Boxes :
Highlight active ranges during Asia, Europe, and US sessions with dynamic high/low updates.
• Session Start/End Labels :
Know exactly when each session begins and ends plotted clearly on your chart with context.
• Session Behavior Analysis :
At the end of each session, the indicator classifies the price action as:
- Trend Up
- Trend Down
- Consolidation
- Manipulation
• Liquidity Grab Detection: Automatically detects possible stop hunts (fake breakouts) and marks them on the chart with precision filters (volume, ATR, reversal).
• Session Countdown Table: A live dashboard showing:
- Current active session
- Time left in session
- Upcoming session and how many minutes until it starts
- Utility time converter (e.g. 90 min = 01:30)
• Vertical Session Lines: Visualize past and upcoming session boundaries with customizable history and future range.
• Multi-Day Support: Draw session ranges for previous, current, and future days for better backtesting and forecasting.
⚙️ Settings Panel
Customize everything to fit your trading style and schedule:
• Session Time Settings:
Set the opening and closing time for each session manually using UTC-based minute inputs.
→ For example, enter Asia Start: 0, Asia End: 480 for 00:00–08:00 UTC.
This gives full flexibility to adjust session hours to match your preferred market behavior.
• Enable or Disable Elements:
Toggle the visibility of each session (Asia, Europe, US), as well as:
- Session Boxes
- Countdown Table
- Session Lines
- Liquidity Grab Labels
• Timezone Selection:
Choose between using UTC or your chart’s local timezone for session calculations.
• Customization Options:
Select number of past and future days to draw session data
Adjust vertical line transparency
Fine-tune label offset and spacing for clean layout
📊 Smart Session Boxes
Each session box tracks high, low, open, and close in real time, providing visual clarity on market structure. Once a session ends, the box closes, and the behavior type is saved and labeled ideal for spotting patterns across sessions.
• Asia: Green Box
• Europe: Orange Box
• US: Blue Box
💡 Why Use This Tool?
• Perfect Timing: Don’t get chopped in low-liquidity hours. Focus on sessions where volume and volatility align.
• Pattern Recognition: Study how price behaves session-to-session to build better strategies.
• Trap Detection: Spot manipulation moves (liquidity grabs) early and avoid common retail pitfalls.
• Macro Session Mapping: Use as a foundational layer to align trades with market structure and news cycles.
🔍 Example Use Case
You're watching BTC at 12:45 UTC. The indicator tells you:
The Asia session just ended (label shows “Asia Session End: Trend Up”)
Europe session starts in 15 minutes
A liquidity grab just triggered at the previous high—label confirmed
Now you know who’s active, what the market just did, and what’s about to start—all in one glance.
✅ Why Traders Trust It
• Visual & Intuitive: Fully chart-based, no clutter, no guessing
• Crypto-Focused: Designed specifically for 24/7 crypto markets (not outdated forex models)
• Non-Repainting: All labels and boxes stay as printed—no tricks
• Reliable: Tested across multiple exchanges, pairs, and timeframes
🧩 Built by Trade City Pro (TCP)
The TCP Market Session Indicator is part of a suite of professional tools used by over 150,000 traders. It’s coded in Pine Script v6 for full compatibility with TradingView’s latest capabilities.
🔗 Resources
• Tutorial: Learn how to analyze sessions like a pro in our TradingView guide:
"TradeCityPro Academy: Session Mapping & Liquidity Traps"
• More Tools: Explore our full library of indicators on

Order Blocks v2Order Blocks v2 – Smart OB Detection with Time & FVG Filters
Order Blocks v2 is an advanced tool designed to identify potential institutional footprints in the market by dynamically plotting bullish and bearish order blocks.
This indicator refines classic OB logic by combining:
Fractal-based break conditions
Time-level filtering (Power of 3)
Optional Fair Value Gap (FVG) confirmation
Real-time plotting and auto-invalidation
Perfect for traders using ICT, Smart Money, or algorithmic timing models like Hopplipka.
🧠 What the indicator does
Detects order blocks after break of bullish/bearish fractals
Supports 3-bar or 5-bar fractal structures
Allows OB detection based on close breaks or high/low breaks
Optionally confirms OBs only if followed by a Fair Value Gap within N candles
Filters OBs based on specific time levels (3, 7, 11, 14) — core anchors in many algorithmic models
Automatically deletes invalidated OBs once price closes through the zone
⚙️ How it works
The indicator:
Tracks local fractal highs/lows
Once a fractal is broken by price, it backtracks to identify the best OB candle (highest bullish or lowest bearish)
Validates the level by checking:
OB type logic (close or HL break)
Time stamp match with algorithmic time anchors (e.g. 3, 7, 11, 14 – known from the Power of 3 concept)
Optional FVG confirmation after OB
Plots OB zones as lines (body or wick-based) and removes them if invalidated by a candle close
This ensures traders see only valid, active levels — removing noise from broken or out-of-context zones.
🔧 Customization
Choose 3-bar or 5-bar fractals
OB detection type: close break or HL break
Enable/disable OBs only on times 3, 7, 11, 14 (Hopplipka style)
Optional: require nearby FVG for validation
Line style: solid, dashed, or dotted
Adjust OB length, width, color, and use body or wick for OB height
🚀 How to use it
Add the script to your chart
Choose your preferred OB detection mode and filters
Use plotted OB zones to:
Anticipate price rejections and reversals
Validate Smart Money or ICT-based entry zones
Align setups with algorithmic time sequences (3, 7, 11, 14)
Filter out invalid OBs automatically, keeping your chart clean
The tool is useful on any timeframe but performs best when combined with a liquidity-based or time-anchored trading model.
💡 What makes it original
Combines fractal logic with OB confirmation and time anchors
Implements time-based filtering inspired by Hopplipka’s interpretation of the "Power of 3"
Allows OB validation via optional FVG follow-up — rarely available in public indicators
Auto-cleans invalidated OBs to reduce clutter
Designed to reflect market structure logic used by institutions and algorithms
💬 Why it’s worth using
Order Blocks v2 simplifies one of the most nuanced parts of SMC: identifying clean and high-probability OBs.
It removes subjectivity, adds clear timing logic, and integrates optional confluence tools — like FVG.
For traders serious about algorithmic-level structure and clean setups, this tool delivers both logic and clarity.
⚠️ Important
This indicator:
Is not a signal generator or financial advice tool
Is intended for experienced traders using OB/SMC/time-based logic
Does not predict market direction — it provides visual structural levels only

Cumulative Intraday Volume with Long/Short LabelsThis indicator calculates a running total of volume for each trading day, then shows on the price chart when that total crosses levels you choose. Every day at 6:00 PM Eastern Time, the total goes back to zero so it always reflects only the current day’s activity. From that moment on, each time a new candle appears the indicator looks at whether the candle closed higher than it opened or lower. If it closed higher, the candle’s volume is added to the running total; if it closed lower, the same volume amount is subtracted. As a result, the total becomes positive when buyers have dominated so far today and negative when sellers have dominated.
Because futures markets close at 6 PM ET, the running total resets exactly then, mirroring the way most intraday traders think in terms of a single session. Throughout the day, you will see this running total move up or down according to whether more volume is happening on green or red candles. Once the total goes above a number you specify (for example, one hundred thousand contracts), the indicator will place a small “Long” label at that candle on the main price chart to let you know buying pressure has reached that level. Similarly, once the total goes below a negative number you choose (for example, minus one hundred thousand), a “Short” label will appear at that candle to signal that selling pressure has reached your chosen threshold. You can set these threshold numbers to whatever makes sense for your trading style or the market you follow.
Because raw volume alone never turns negative, this design uses candle direction as a sign. Green candles (where the close is higher than the open) add volume, and red candles (where the close is lower than the open) subtract volume. Summing those signed volume values tells you in a single number whether buying or selling has been stronger so far today. That number resets every evening, so it does not carry over any buying or selling from previous sessions.
Once you have this indicator on your chart, you simply watch the “summed volume” line as it moves throughout the day. If it climbs past your long threshold, you know buyers are firmly in control and a long entry might make sense. If it falls past your short threshold, you know sellers are firmly in control and a short entry might make sense. In quieter markets or times of low volume, you might use a smaller threshold so that even modest buying or selling pressure will trigger a label. During very active periods, a larger threshold will prevent too many signals when volume spikes frequently.
This approach is straightforward but can be surprisingly powerful. It does not rely on complex formulas or hidden statistical measures. Instead, it simply adds and subtracts daily volume based on candle color, then alerts you when that total reaches levels you care about. Over several years of historical testing, this formula has shown an ability to highlight moments when intraday sentiment shifts decisively from buyers to sellers or vice versa. Because the indicator resets every day at 6 PM, it always reflects only today’s sentiment and remains easy to interpret without carrying over past data. You can use it on any intraday timeframe, but it works especially well on five-minute or fifteen-minute charts for futures contracts.
If you want a clear gauge of whether buyers or sellers are dominating in real time, and you prefer a rule-based method rather than a complex model, this indicator gives you exactly that. It shows net buying or selling pressure at a glance, resets each session like most intraday traders do, and marks the moments when that pressure crosses the levels you decide are important. By combining a daily reset with signed volume, you get a single number that tells you precisely what the crowd is doing at any given moment, without any of the guesswork or hidden calculations that more complicated indicators often carry.

$ADD LevelsThis Pine Script is designed to track and visualize the NYSE Advance-Decline Line (ADD). The Advance-Decline Line is a popular market breadth indicator, showing the difference between advancing and declining stocks on the NYSE. It’s often used to gauge overall market sentiment and strength.
1. //@version=5
This line tells TradingView to use Pine Script v5, the latest and most powerful version of Pine.
2. indicator(" USI:ADD Levels", overlay=false)
• This creates a new indicator called ” USI:ADD Levels”.
• overlay=false means it will appear in a separate pane, not on the main price chart.
3. add = request.security(...)
This fetches real-time data from the symbol USI:ADD (Advance-Decline Line) using a 1-minute timeframe. You can change the timeframe if needed.
add_symbol = input.symbol(" USI:ADD ", "Market Breadth Symbol")
add = request.security(add_symbol, "1", close)
4. Key Thresholds
These define the market sentiment zones:
Zone. Value. Meaning
Overbought +1500 Extremely bullish
Bullish +1000 Generally bullish trend
Neutral ±500 Choppy, unclear market
Bearish -1000 Generally bearish trend
Oversold -1500 Extremely bearish
5. Plot the ADD Line hline(...)
Draws static lines at +1500, +1000, +500, -500, -1000, -1500 for reference so you can visually assess where ADD stands.
6. Horizontal Threshold Lines bgcolor(...)
• Green background if ADD > +1500 → extremely bullish.
• Red background if ADD < -1500 → extremely bearish.
7. Background Highlights alertcondition(...)
• Green background if ADD > +1500 → extremely bullish.
• Red background if ADD < -1500 → extremely bearish.
8. Alert Conditions. alertcondition(...)
Lets you create automatic alerts for:
• USI:ADD being very high or low.
• Crosses above +1000 (bullish trigger).
• Crosses below -1000 (bearish trigger).
You can use these to trigger trades or monitor sentiment shifts.
Summary: When to Use It
• Use this script in a market breadth dashboard.
• Combine it with price action and volume analysis.
• Monitor for ADD crosses to signal potential market reversals or momentum.
