Combined MA Trend FilterToday I propose a simple but an effective tool to use as a trend identifier.
It is simple because it doesn't require user to tinker with it and it works on all scripts and all time frames.
It is effective because it's based on what I believe to be the most used ma's by the traders who are successful and usually trade with large qty.
So, what's under the hood?
-It's a combination of MA's and its alpha multiplier to replicate effect of higher TF MA without producing the weird square shapes.
-We are utilizing the range between the two as a way to identify "noise areas" or "ranging areas" for the price action, where taking a trade might not be the best decision.
-As soon as bar starts closing above the both MA and its alpha multiplier, it is in strong bullish zone
-And as soon as bar start closing below the same we have a strong bearish zone.
-Bar Colour coding
Lime - Strong Bullish sentiment
Yellow - Weak Sentiment (Ranged area)
Red - Strong bearish sentiment
-This indicator works in two modes, one is noise mode and one is noiseless mode.
When we select noiseless mode, we are utilizing here a filter to reduce noise, which can be also plotted on chart and option for doing so is given in settings.
Some examples?
I've used alpha of 5 in above examples (You can change it to anything you want, depending on your script and TF)
As you can see, it produces far better filtering and keeps you out from possible "noise areas" when trading, it is also good at working as scaling in and out tool for purpose of maximizing the profits when you do catch the trend.
Please note that higher the alpha you use, you will be shifting to higher TF MA, while its difficult to have a set number of set TimeFrame effect replication, its best to keep the alpha multiplier value around 5.
Authors note:
This indicator is free to use for all, I'm only protecting the code to avoid people selling it to unsuspecting new users. It happens a lot on TV.
Past performance does not mean future profit and trader is responsible for his own losses or profits, author does not take any responsibility to wrong application of the tool provided here.
Have a profitable trading journey and enjoy~
Trailing

Wilder's Volatility Trailing Stop Strategy with various MA'sFor Educational Purposes. Results can differ on different markets and can fail at any time. Profit is not guaranteed.
This only works in a few markets and in certain situations. Changing the settings can give better or worse results for other markets. This strategy is based on Wilder's Volatility System. It is an ATR trailing stop that is used for long term trends. This strategy focuses on the trailing stop alone and goes long and short only when it goes above or below the trailing line. It is similar to Donchian channels except it does not include the certain period channel breakout, only the trailing signal. This is only the trailing stop and an attempt to show how well it works standalone as Wilder described.
In his book, Wilder recommends a multiplier of 2.8-3.1 and an ATR lookback of 7 periods along with a running moving average or otherwise known as Wilder's moving average. The calculation and programming part for the trailing stop varies everywhere. I opted to keep it as simple and accurate as I could think of and interpret from the book. The variations to these types of indicators are numerous unfortunately, but Wilder seems to be the original author of ATR and this ATR-based trailing stop. In his book he says to use the significant closing price or highest/lowest closing price for the calculation part but I also included the option of choosing the highest high and lowest low, and the option to choose various moving averages in case anyone wants to experiment.
Comparing this and Donchian channels, it seems that a 2.5 multiplier is somewhat similar to the middle band of DCs and a 3.0 multiplier is somewhat similar to a double length middle band of DCs. It's hard to say which is the better trailing stop for a long term strategy. It's hard to beat the simplicity of DCs but maybe some might find a need for more inputs in a trailing stop or maybe an ATR based one like Wilder's can work better depending on what setting or strategy it's used in.

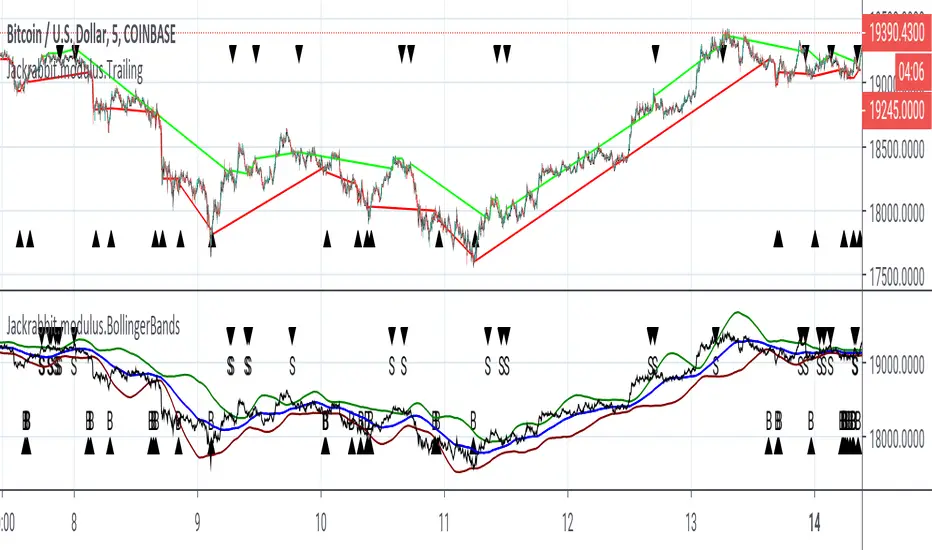
Jackrabbit.modulus.TrailingThis is a full, true, and pure implementation of trailing buy/sell for the Jackrabbit suite and modulus framework.
This module is not a standalone and relies on previous modules to send a signal data in order to function properly. This module acts on buy and sell data from within the indicator on indicator framework that TradingView supports.
This module adds the ability to trail a buying position to its lowest value or if it breaks a retracement percentage (user defined). It also allows trailing a sell position with an user defined retracement. It can managing buy and selling or just buying or selling.
This module does NOT allow accumulation during the trailing process. If a buy signal is received while the module is already trailing a previous position, if the price is lower then the previous position, the current position is used, otherwise it is ignored. The same holds true for selling. Once the position is bought, accumulation will resume as normal for the next position.
The chart displays (for both buying and selling):
The current price, its retracement value, and the original price.
Note that the buy or sell does NOT actually take place until the price action crosses retracement.
The Jackrabbit modulus framework is a plug in play paradigm built to operate through TradingView's indicator on indicatior (IoI) functionality. As such, this script receives a signal line from the previous script in the IoI chain, and evaluates the buy/sell signals appropriate to the current analysis.
This script is by invitation only. To learn more about accessing this script, please see my signature or send me a PM. Thank you.
Trailing StopThis indicator is a simple trailing stop.
with this we can trail our price.
inputs that we can put with this indicator are:
1. Entry price: open, close, high, low, etc.
2. Position: Long, Short
3. Stop loss range: integer value only
4. Entry hour, Entry minute, Entry month, Entry Year, Entry Day
By taking all the above input this will work according to the input.
Thank You.

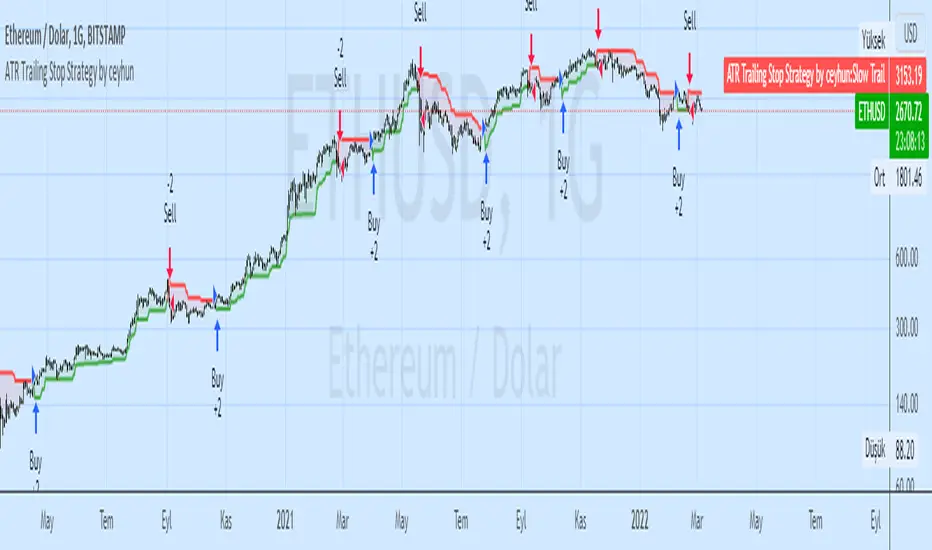
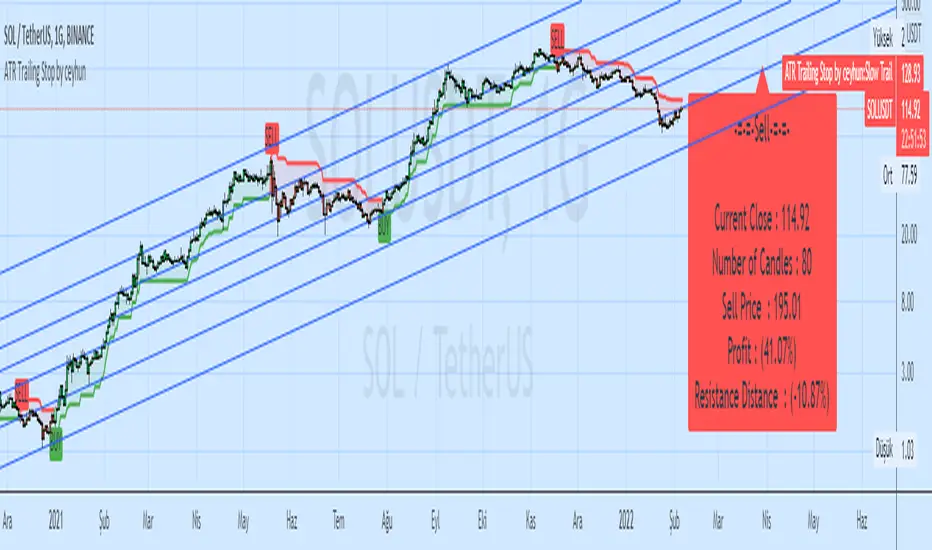
ATR Trailing Stop Strategy by ceyhunSame coding only coloring and strategy version added
//Barcolor
Green = Trail1 > Trail2 and close > Trail2 and low > Trail2
Blue = Trail1 > Trail2 and close > Trail2 and low < Trail2
Red = Trail2 > Trail1 and close < Trail2 and high < Trail2
Yellow = Trail2 > Trail1 and close < Trail2 and high > Trail2
//It gives White color where there is deterioration.
Let's not use InfoPanel in strategy, it would be wrong as it signals the next day.
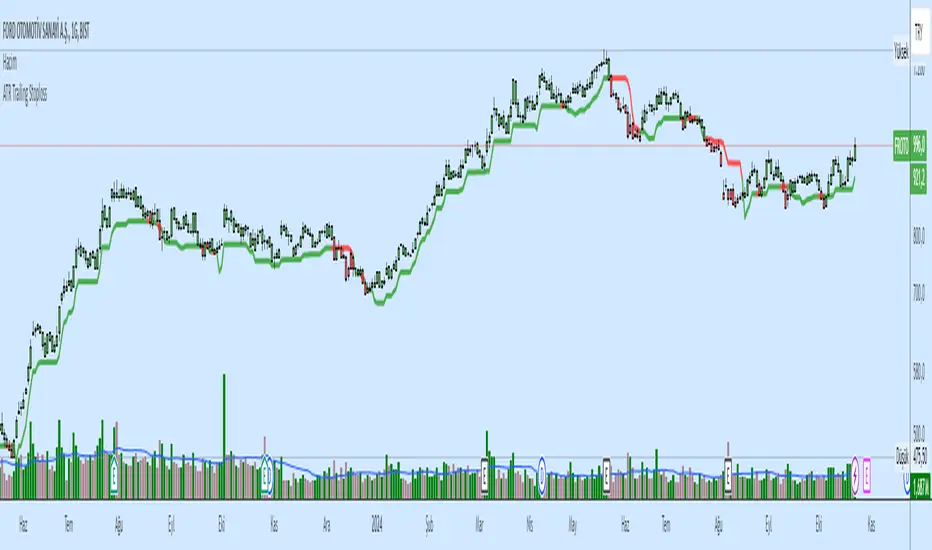
ATR Trailing Stoploss StrategyI am sharing the strategy version of the indicator used before. It is very simple to use.
These are the settings I use, you can change, test and use as you wish.
Atr Period 5
Highest High Period 10
Multiplier 2.5
It can generate more signals in shorter time frames.
The success rate will be higher in longer time frames.

[STRATEGY] Buy/Sell/TP/SL/TSL Alerts ModuleA strategy version of the Buy/Sell/TP/SL/TSL Alerts Module .
It works the same way:
1) You choose a specific indicator and apply it to your chart
2) You create a special signal form of that indicator
3) You connect that form to the module
4) Bob's your uncle
If you have any questions don't hesitate to ask and contact me either via private messages on TradingView or via Telegram.
Thanks!
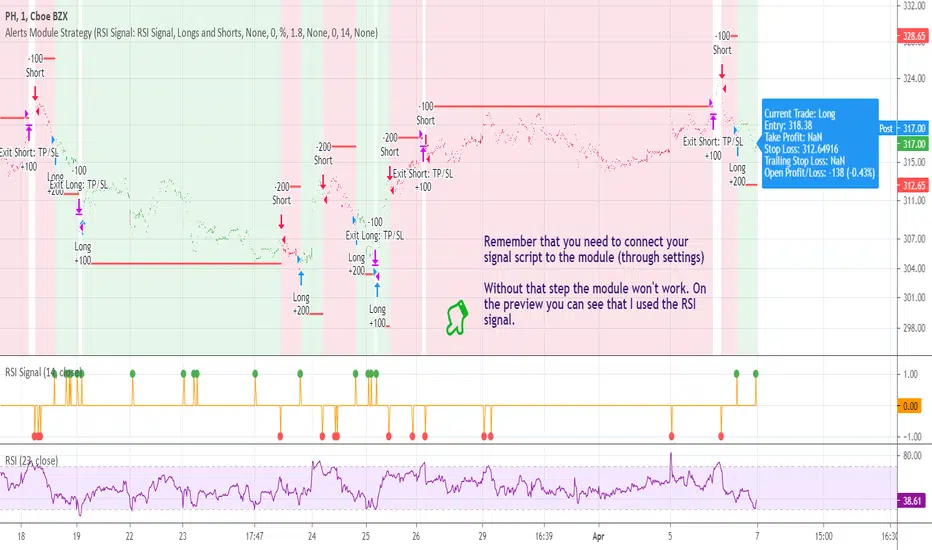
Buy/Sell/TP/SL/TSL Alerts ModuleThis tool is not a self-sufficient indicator, just an attachable module that allows you to enhance a specific indicator with risk management components without having a headache.
What you need to do, and actually this is the most important step, is to rewrite your indicator to a buy-sell signal form which will output only -1, 0, 1 values and then connect it to the module.
After that the module gives you a lot of possibilities to customize Take Profit, Stop Loss and Trailing Stop Loss levels through the settings window and to set all the alerts you need up.
Simple Buy/Sell setup for the RSI:
Now I am adding Stop Loss:
and Take Profit:
and finally Trailing Stop Loss:
Okay, I have shown how it works with RSI signals. Here is example for the MACD:
and example for the WaveTrend Oscillator:
If you have any questions don't hesitate to ask and contact me either via private messages on TradingView or via Telegram

Trailing EngulferTrailing Engulfer is a price action strategy that uses trailing orders that makes use of any timeframe although shorter timeframes are typically used with price action trading. due to it being price action related, there are some differences needed when trading with different assets. This strategy is recommended to be used for stocks and futures only although it can be used on others. There are two specific inputs that pertain to futures: trailing trigger and trailing offset. Futures price changes in ticks and tick values are supposed to be used here, whereas the percentage fields are primarily for stocks.
Inputs:
Futures: Trailing Trigger - used for futures only and the value represents the number of ticks you wish for a trailing order to enter. For example: if set to 4 ticks, the trailing stop will not be created until after 4 ticks of profit has been reached.
Futures: Trailing Offset - used for futures only and the value represents the number of ticks you wish the stop to trail the price. For example: if set trigger is set to 4 and offset is set to 3, then the trailing stop order will be created once a profit of 4 ticks has been reached and the trailing stop will be 3 ticks against you.
Max Loss (%) - used for stocks only and the value represents the maximum loss you are willing to take in case the trailing stop hasn't yet been made. For example: you wish the trailing stop to be created once it has made 1% profit. If it never reaches that, it will close at this Max Loss value.
Trailing Trigger (%) - used for stocks only. It works similar to the futures trigger other than the fact that it uses % rather than ticks.
Trailing Offset (%) - used for stocks only. It works similar to the futures trigger offset other than the fact that it uses % rather than ticks.
Futures also have a "Max Loss" but it is not user defined. For futures, the max loss is not based on a tick loss but rather entirely on the asset's price action.
Futures also makes use of shorting.

SuperTrailThe SuperTrail indicator is similar to the very popular and widely used SuperTrend but it has been improved to use a percentage value instead that helps users to determine the natural trading range of a stock over a period of time, and set stop losses (especially trailing stops) accordingly.
The best way to use it is to find stocks in a steady trend (upwards if you are going long or downwards if you are going short) and keep changing the indicator percentage levels until you identify a percentage that keeps you in the trade for longer without getting stopped out too often. You can then set this value in your trading program, or set an alert within Trading View to notify you if something changes and you need to take an action.
Some stocks might have little volatility and only require an 8% trail. Some might be more volatile and work better with a wider 20% trail. It also depends on your time frame. Shorter time frames are typically shorter stops. Longer time frames work better with wider stop values. The best thing about this tool is that it helps you identify the best optimised stop loss range to set for each individual stock based on its range.
The indicator works on any time frame - minutes to hours to weeks. If you want to hold stocks for a shorter time you might look at the natural range over the last 7 days, medium term the range over the last 3 months, or if you want to hold a stock for a much longer period of time then perhaps look to identify the range over the last 12 months. If you get stopped out of a stock you like, then set an alert, and when the stock moves back up within its range you can decide on whether or not you re-enter.
It is a super simple indicator. As always it is meant only as a visual guide to assist you with your trading and you will get better results by combining it with another indicator like an OBV or RSI. You can check out my Trading View channel to see how I have used it across different stocks and based it on different time periods.
I have also made and uploaded a video to my Trading View account showing how it works and how I use it.
Message me if you would like access.

ATR Trailing Stop by ceyhunSame coding only coloring and information panel was added.
CDC ATR Trailing Stop V2.1 (2013)
//Barcolor
Green = Trail1 > Trail2 and close > Trail2 and low > Trail2
Blue = Trail1 > Trail2 and close > Trail2 and low < Trail2
Red = Trail2 > Trail1 and close < Trail2 and high < Trail2
Yellow = Trail2 > Trail1 and close < Trail2 and high > Trail2
//It gives White color where there is deterioration.
//InfoPanel
Buy Price = Blue draws the circles at the purchase price.
Profit Long>20 = Risk level taken as a percentage, I got the highest 20%, you can determine as you wish.
Sell Price = Red draws the circles at the purchase price.
Profit Short>20 = Risk level taken as a percentage, I got the highest 20%, you can determine as you wish.
Percent Trailing Stop (%) - For Study Scripts===========
Percent Trailing Stop (%) - { FOR STUDY SCRIPTS }
===========
Wow - this is an example of how to implement Alerts relating to a Trailing Stop (%) within your Study Script. It's taken a bit of effort to get this working but I think we got there!
Alerts include Open Long/Short, Trailing Stop Hit, and (the most important one) Movement of Trailing Stop! <- this is actually really quite good, by the way! :)
You can ignore the actual entry/exit orders - they're based on a simple MA cross and are therefore NOT relevant, NOT profitable and NOT recommended!
You should be using this code as a way of adding a Trailing Stop to your own scripts - hope it helps!
Set your "Open Long/Short" Alert to "Once per Bar Close" - Set your "Trailing Stop Hit" Alert to "Once per Bar" - Set your "Move TSL" Alert to "Once per Bar Close". - You're all done! Enjoy.
-----------
Good Luck and Happy Trading!

Guppy Count Back LineThe Guppy Count Back Line was created by Daryl Guppy and is essentially a trailing stop indicator. I have color coded the indicator to tell you if you should go long or short.
This was a special request so let me know if you would like me to write more scripts for other indicators!

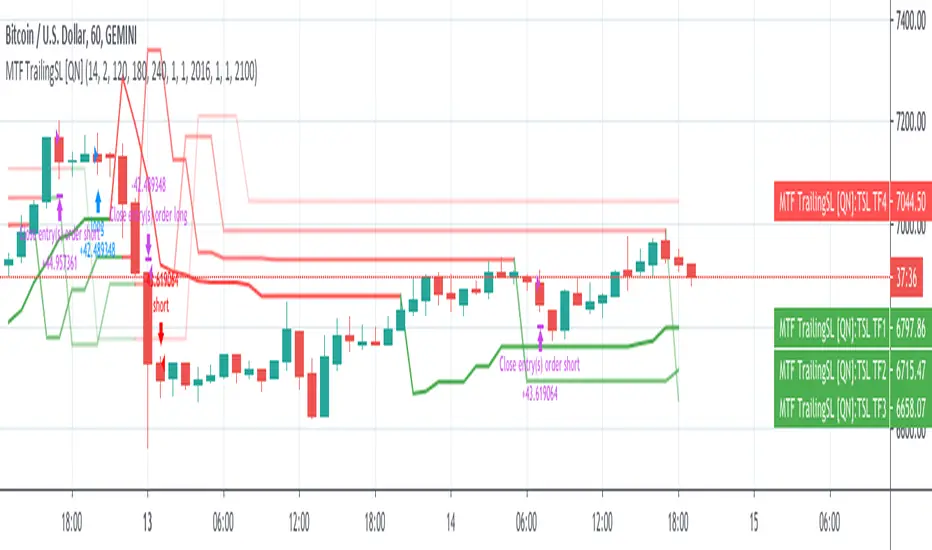
MTF Trailing SL Alerts [QuantNomad]These are alerts for my MTF Trailing SL Strategy.
Entry Long position if all 4 time-frames agree on the long signal.
Exit Long positions when at least 2 time-frames disagree on the long signals.
Entry to Short position if all 4 time-frames agree on Short signal.
Exit from Short positions when at least 2 time-frames disagree on Short signal.
Use "Once Per Bar Close" when creating alerts.
Link to the strategy:
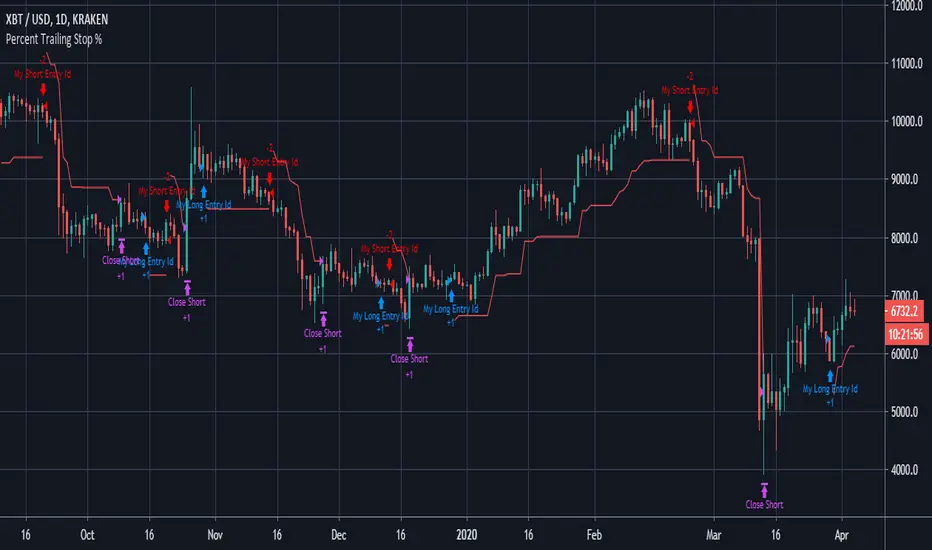
Percent Trailing Stop %===========
Percent Trailing Stop %
===========
Another Stop Loss Indicator today - our last Fixed SL/TP script went down quite well, this one is for adding a Percent Trailing Stop from Entry Price to your own strategy.
You can ignore the actual entry/exit orders - they're based on a simple MA cross and are therefore NOT relevant, NOT profitable and NOT recommended!
You should be using this code as a way of adding a % Trailing Stop to your own scripts - hope it helps!
You should also notice that a generally considered losing strategy (a simple MA cross) could actually become profitable with careful money management - try combining this Trailing Stop script with our Fixed Stop/Take Profit script for really accurate management of your capital.
-----------
Good Luck and Happy Trading!
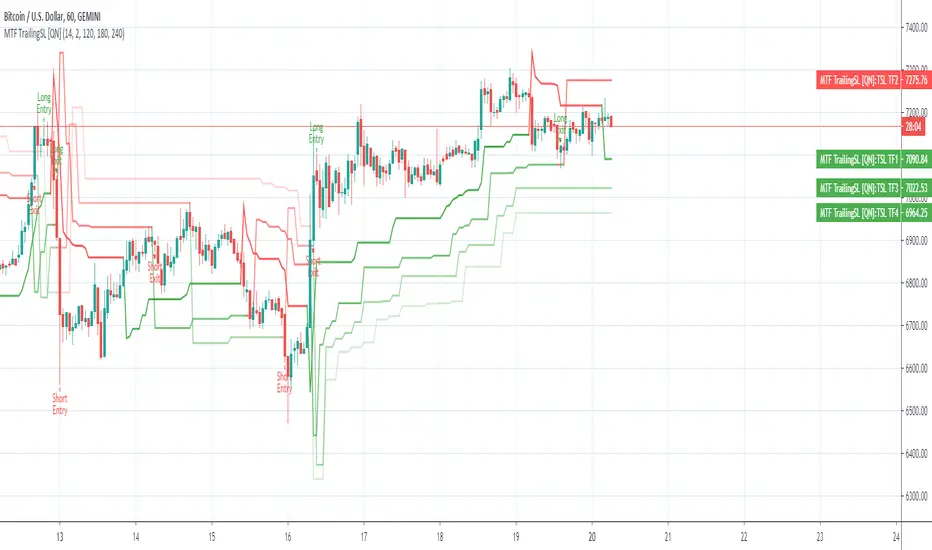
MTF Trailing SL Strategy [QuantNomad]This is a Multi-Timeframe version of my Trailing SL Strategy.
Few weeks ago I published Trailing SL Strategy. There I used only basic Trailing SL to enter positions.
It worked pretty well so I tried to work on it a bit. I thought what if you can use the same ATR TSL on different timeframes and combine them into one signal.
In this strategy you can use only ATR stops and choose 3 other higher timeframes in addition to your current timeframe.
You'll see Trailing SL plotted on the chart form all these timeframes.
Entry Long position if all 4 time-frames agree on long signal.
Exit Long positions when at least 2 time-frames disagree on long signal.
Entry to Short position if all 4 time-frames agree on Short signal.
Exit from Short positions when at least 2 time-frames disagree on Short signal.
Here is the link to my basic Trailing SL Strategy:
XPloRR S&P500 Stock Market Crash Detection Strategy v2XPloRR S&P500 Stock Market Crash Detection Strategy v2
Long-Term Trailing-Stop strategy detecting S&P500 Stock Market Crashes/Corrections and showing Volatility as warning signal for upcoming crashes
Detecting or avoiding stock market crashes seems to be the 'Holy Grail' of strategies.
Since none of the strategies that I tested can beat the long term Buy&Hold strategy, the purpose was to detect a stock market crash on the S&P500 and step out in time to minimize losses and beat the Buy&Hold strategy. So beat the Buy&Hold strategy with around 10 trades. 100% capitalize sold trade into new trade.
With the default parameters the strategy generates 10262% profit (starting at 01/01/1962 until release date), with 10 closed trades, 100% profitable, while the Buy&Hold strategy only generates 3633% profit, so this strategy beats the Buy&Hold strategy by 2.82 times !
Also the strategy detects all major S&P500 stock market crashes and corrections since 1962 depending on the Trailing Stop Smoothness parameter, and steps out in time to cut losses and steps in again after the bottom has been reached. The 5 major crashes/corrections of 1987, 1990, 2001, 2008 and 2010 were successfully detected with the default parameters.
The script was first released on November 03 2019 and detected the Corona Crash on March 04 2020 with a Volatility crash-alert and a Sell crash-alert.
I have also created an Alerter Study Script based on the engine of this script, which generates Buy, Sell and Volatility signals.
If you are interested in this Alerter version script, please drop me a mail.
The script shows a lot of graphical information:
the Close value is shown in light-green. When the Close value is temporarily lower than the Buy value, the Close value is shown in light-red. This way it is possible to evaluate the virtual losses during the current trade.
the Trailing Stop value is shown in dark-green. When the Sell value is lower than the Buy value, the last color of the trade will be red (best viewed when zoomed)
the EMA and SMA values for both Buy and Sell signals are shown as colored graphs
the Buy signals are labeled in blue and the Sell signals are labeled in purple
the Volatility is shown below in green and red. The Alert Threshold (red) is default set to 2 (see Volatility Threshold parameter below)
How to use this Strategy?
Select the SPX (S&P500) graph and add this script to the graph.
Look in the strategy tester overview to optimize the values Percent Profitable and Net Profit (using the strategy settings icon, you can increase/decrease the parameters), then keep using these parameters for future Buy/Sell signals on the S&P500.
More trades don't necessarily generate more overall profit. It is important to detect only the major crashes and avoid closing trades on the smaller corrections. Bearing the smaller corrections generates a higher profit.
Watch out for the Volatility Alerts generated at the bottom (red). The Threshold can by changed by the Volatility Threshold parameter (default=2% ATR). In almost all crashes/corrections there is an alert ahead of the crash.
Although the signal doesn't predict the exact timing of the crash/correction, it is a clear warning signal that bearish times are ahead!
The correction in December 2018 was not a major crash but there was already a red Volatility warning alert. If the Volatility Alert repeats the next weeks/months, chances are higher that a bigger crash or correction is near. As can be seen in the graphic, the deeper the crash is, the higher and wider the red Volatility signal goes. So keep an eye on the red flag!
Here are the parameters:
Fast MA Buy: buy trigger when Fast MA Buy crosses over the Slow MA Buy value (use values between 10-20)
Slow MA Buy: buy trigger when Fast MA Buy crosses over the Slow MA Buy value (use values between 21-50)
Minimum Buy Strength: minimum upward trend value of the Fast MA Buy value (directional coefficient)(use values between 10-100)
Fast MA Sell: sell trigger when Fast MA Sell crosses under the Slow MA Sell value (use values between 10-20)
Slow MA Sell: sell trigger when Fast MA Sell crosses under the Slow MA Sell value (use values between 21-50)
Minimum Sell Strength: minimum downward trend value of the Fast MA Sell value (directional coefficient)(use values between 10-100)
Trailing Stop ATR: trailing stop % distance from the smoothed Close value (use values between 2-20)
Trailing Stop Smoothness: MA value for smoothing out the Trailing Stop close value
Buy On Start Date: force Buy on start date even without Buy signal (default: true)
Sell On End Date: force Sell on end date even without Sell signal (default: true)
Volatility EMA Period: MA value of the Volatility value (default 15)
Volatility Threshold: Threshold value to change volatility graph to red (default 2)
Volatility Graph Scaler: Scaling of the volatility graph (default 5)
Important : optimizing and using these parameters is no guarantee for future winning trades!

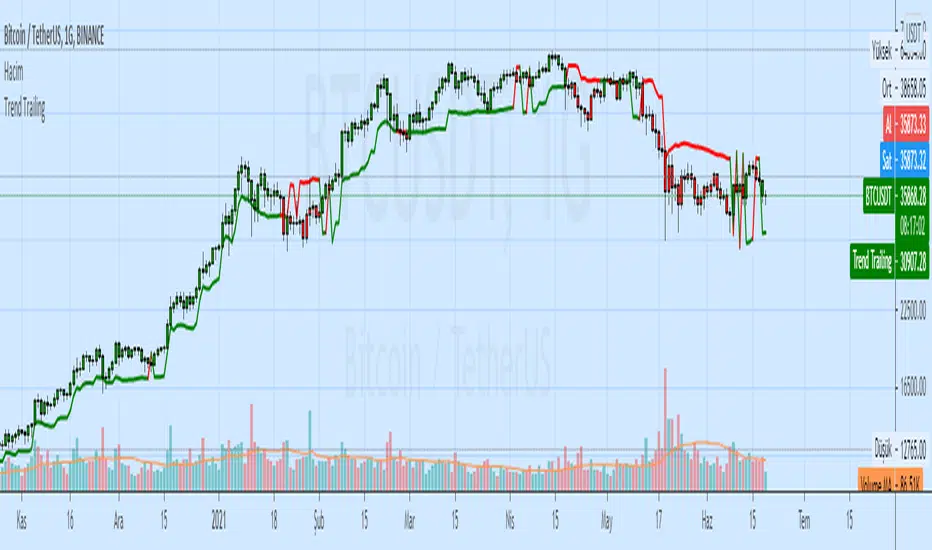
Trend TrailingAndrew Abraham
It can be used as:
- stop loss indicator
- indicator of support and resistance
- buy and sell signals
Simple Moving Average - ATR Trailing StopThe old adage goes "Cut losers fast and let the winners run"
With this in mind, this will plot a dynamic trailing stop by subtracting any multiplier of the Average True Range (ATR) from the SMA of your choice.

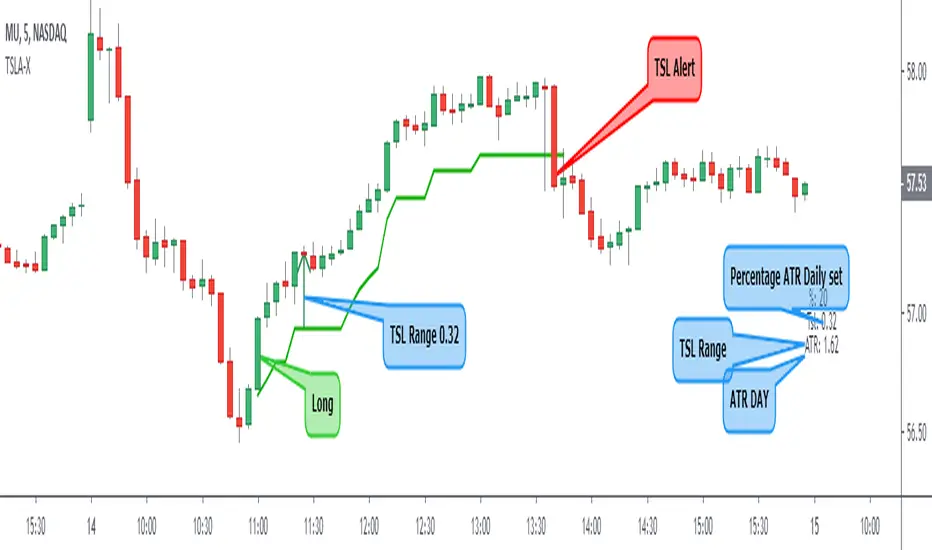
Trailing Stop Loss ATR + AlertI share this TSL indicator with alert (I use it only for Stocks), the configuration is very simple, you must select if it is a Short or Long operation, time at which the operation was opened,% of the daily ATR for TSL. It also contains:
- Alert
- Panel Info
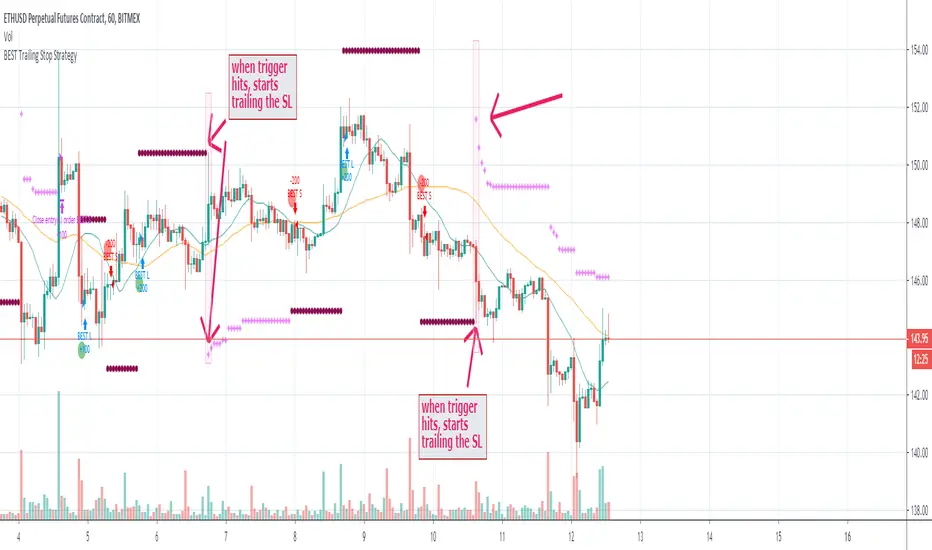
BEST Trailing Stop StrategyHello traders
Here we go again.... with the second strategy snippet.
Reminder: the first snipper was a Trailing Profit strategy script
What's on the menu?
A trailing stop is designed to protect gains by enabling a trade to remain open and continue to profit as long as the price is moving in the investor's favor.
The order closes the trade if the price changes direction by a specified percentage or dollar amount.
Trigger me I'm famous
I developed many trading strategies in my career and often I've been asked to trigger a trailing-stop once a certain % move has been made.
On the screenshot below, the SL trigger is plotted in maroon.
Once the price goes past that level for the first time, I'll start trailing the trailing stop level.
In other words, when we see a price makes an interesting move in percentage value - we decide to trail the stop for at least not losing any more
All the BEST
Dave
BEST Trailing Take Profit StrategyHello traders
Hope you enjoyed your weekend on my behalf. Was staying home working ... ^^
This is my first strategy educational post I'm doing ever
While I'm generally against posting strategies because it's very easy to fake performance numbers... I cannot prevent myself from sharing a few cool strategy snippets anyway.
So from now on, I'll be sharing a few strategies also - generally not to showcase performance but only to show what pinescript can do.
As once again strategy performance can be faked is so many ways... :)
What's on the menu?
We all know what a trailing-stop is. right? right? Ok... sharing the definition here :)
A trailing stop is designed to protect gains by enabling a trade to remain open and continue to profit as long as the price is moving in the investor's favor. The order closes the trade if the price changes direction by a specified percentage or dollar amount.
But...do you know what a trailing profit is?
Short definition : Well the same but with your profit limit order.
Long definition : A trailing profit is designed to increase your gains by enabling a trade to remain open and continue to profit as long as the price is moving in the investor's favor. The order closes the trade if the price hits the trailing profit level specified percentage or dollar amount.
Some trading strategies used both a trailing stop AND trailing profit. Not making any recommendation here - only sharing what's possible in the realm of trading and pinescripting
Trigger me I'm famous
I developed many trading strategies in my career and often I've been asked to trigger a trailing-stop or trailing-profit once a certain % move has been made.
I integrated here a Take Profit trigger - once hit, it will activate the trailing profit
On the screenshot below, the TP trigger is plotted in orange. Once the price goes past that level for the first time, I'll start trailing the profit level.
In other words, when we see a price makes an interesting move in percentage value - we decide to offset the profit as we concluded that once it reached such distance - then it leads often to more profit
Of course, using only a trailing profit without stop/trailing-stop/invalidation isn't smart and the surest way to kiss goodbye a trading capital and trading and your good mood
See you tomorrow for another strategy snippet
All the BEST
Dave