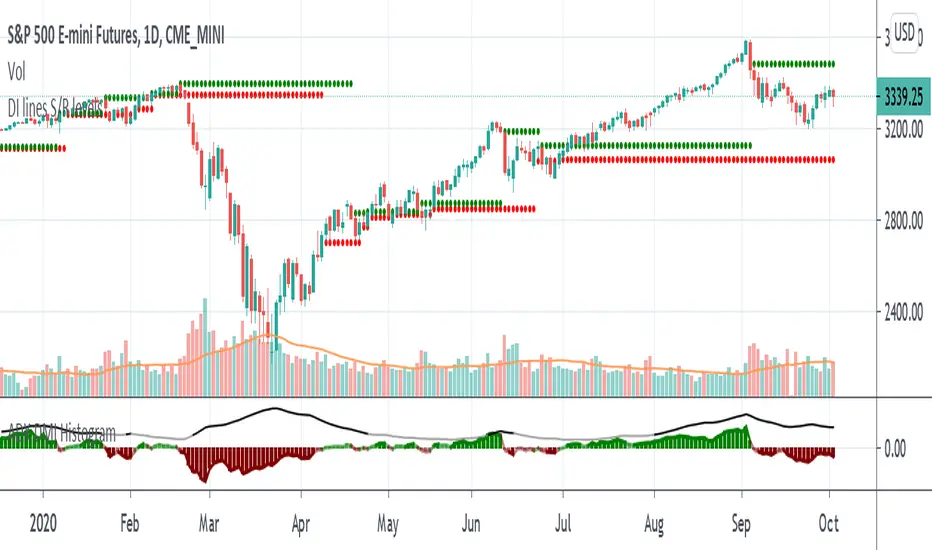
Support and Resistance levels - DMI - DI trailing stop linesThis can be used to compliment the Directional Movement Index if used as a standalone trading system. In addition to using the ADX and DI lines, a trailing stop can be used when the DI lines cross. If the plus line is above to show a buy signal, then the low of the price of when which the cross took place is used as a trailing stop. If the minus line is above to show a sell signal, then the high of the price of when which the cross took place is used as a trailing stop. This helps cut losses sooner whenever the price would end up going through these trailing stops or support/resistance levels yet the DMI system would show an upward or downward move.
Trailingstop
Profit Maximizer PMaxPMax is a brand new indicator developed by KivancOzbilgic in earlier 2020.
It's a combination of two trailing stop loss indicators;
One is Anıl Özekşi's MOST (Moving Stop Loss) Indicator
and the other one is well known ATR based SuperTrend.
Both MOST and SuperTrend Indicators are very good at trend following systems but conversely their performance is not bright in sideways market conditions like most of the other indicators.
Profit Maximizer - PMax tries to solve this problem. PMax combines the powerful sides of MOST (Moving Average Trend Changer) and SuperTrend (ATR price detection) in one indicator.
Backtest and optimization results of PMax are far better when compared to its ancestors MOST and SuperTrend. It reduces the number of false signals in sideways and give more reliable trade signals.
PMax is easy to determine the trend and can be used in any type of markets and instruments. It does not repaint.
The first parameter in the PMax indicator set by the three parameters is the period/length of ATR.
The second Parameter is the Multiplier of ATR which would be useful to set the value of distance from the built in Moving Average.
I personally think the most important parameter is the Moving Average Length and type.
PMax will be much sensitive to trend movements if Moving Average Length is smaller. And vice versa, will be less sensitive when it is longer.
As the period increases it will become less sensitive to little trends and price actions.
In this way, your choice of period, will be closely related to which of the sort of trends you are interested in.
We are under the effect of the uptrend in cases where the Moving Average is above PMax;
conversely under the influence of a downward trend, when the Moving Average is below PMax.
Built in Moving Average type defaultly set as EMA but users can choose from 8 different Moving Average types like:
SMA : Simple Moving Average
EMA : Exponential Movin Average
WMA : Weighted Moving Average
TMA : Triangular Moving Average
VAR : Variable Index Dynamic Moving Average aka VIDYA
WWMA : Welles Wilder's Moving Average
ZLEMA : Zero Lag Exponential Moving Average
TSF : True Strength Force
Tip: In sideways VAR would be a good choice
You can use PMax default alarms and Buy Sell signals like:
1-
BUY when Moving Average crosses above PMax
SELL when Moving Average crosses under PMax
2-
BUY when prices jumps over PMax line.
SELL when prices go under PMax line.

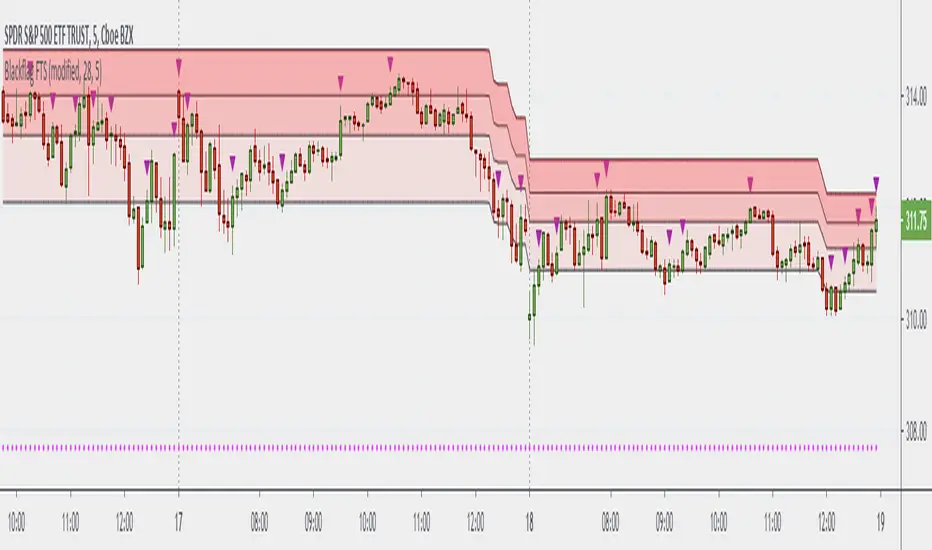
SwingArm ATR Trend IndicatorThe general idea of using SwingArms is to provide a visual confirmation of a trend change.
Green for bullish (BUY)
Red for bearish (SELL)
A color-coded system providing an easy way for a novice to understand.
Converted to TradingView based on the work of Jose Azcarate.
I hope you guys enjoy.
Simple Moving Average Double HelixThis one is a mix of colour-coded moving averages and Ichimoku. It features two pairs of SMAs--default values of 9/20 and 50/200. Each SMA will be green when it rises and red when it falls. The spaces between each pair will fill with green or red depending on which line is on top. 9 over 20 or 50 over 200 makes a green cloud; if 9 or 50 falls below, the cloud will switch to green.
There's also the Ichimoku lagging span and a 35-period SMA (grey) that can be used as a trailing stop loss guideline.
Ideal long setup:
9, 20, 50, and 200 SMA are all green
both clouds are green
lagging span is above historic price action
Ideal short setup:
9, 20, 50, and 200 SMA are all red
both clouds are red
lagging span is below historic price action

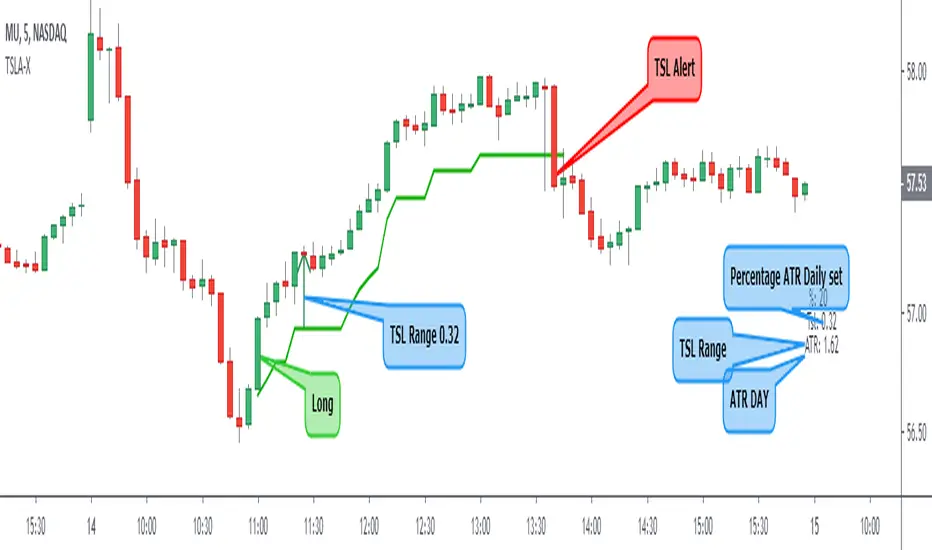
Trailing Stop LossTrailing stop loss indicator to determine when to exit a position.
Multiple trailing stop loss calculation techniques are implemented:
ATR: Determines stop loss using a gap from recent highest value, that gap is defined by the ATR value and a multiplier
MA: Just a simple moving average used as a stop-loss
Percentage: Uses a percentage of the price
The script also implements alerting to be notified when the stop loss price is reached.

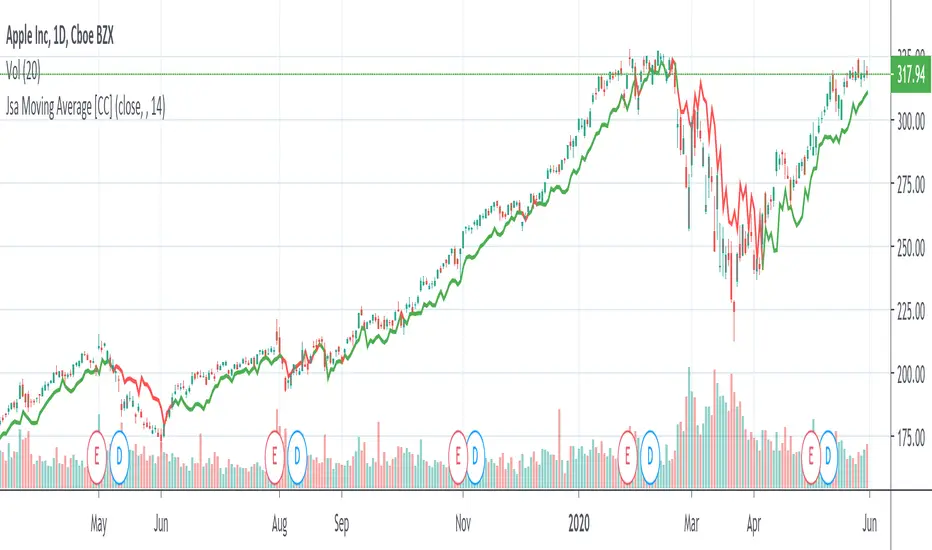
Jsa Moving Average [CC]The Jsa Moving Average was created by George R. Arrington, Ph .D. (Stocks & Commodities V. 11:10 (427-431)) and it is an extremely simple formula but has very many great uses. For one thing it acts as support and resistance levels and it also acts like a trailing stop. It gives a wide enough berth during extended up or down trends to let you ride the wave up or down and when it gets close to the price it means that it is a choppy market. Buy when the indicator line is green and sell when it turns red.
Let me know if you would like to see me publish other indicators or if you want something custom done!
Note: I'm republishing this because the original script couldn't be found in searches so this will fix that.
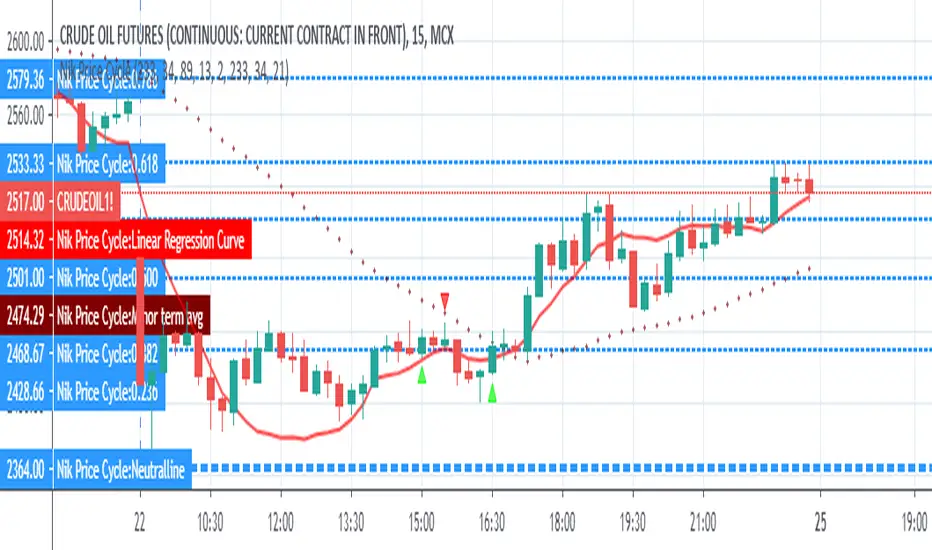
Nik Price CycleEvery script follow a pattern in their price cycle. This can be defined by division of price cycle. Division line will act as pivot point.Above this bar this any price movement is indication of bullish trend while below this line any price movement is indication of bearish trend. This Nik price signal will give great result in combination of magicsignal which is also one of our developed signal. Although we have included various calculation for analysis purpose in this indicator. i suggest to go in setting and uncheck all channel lines and shapes for getting clear picture of trend and entry point. for more details on how to use this indicator people can message us
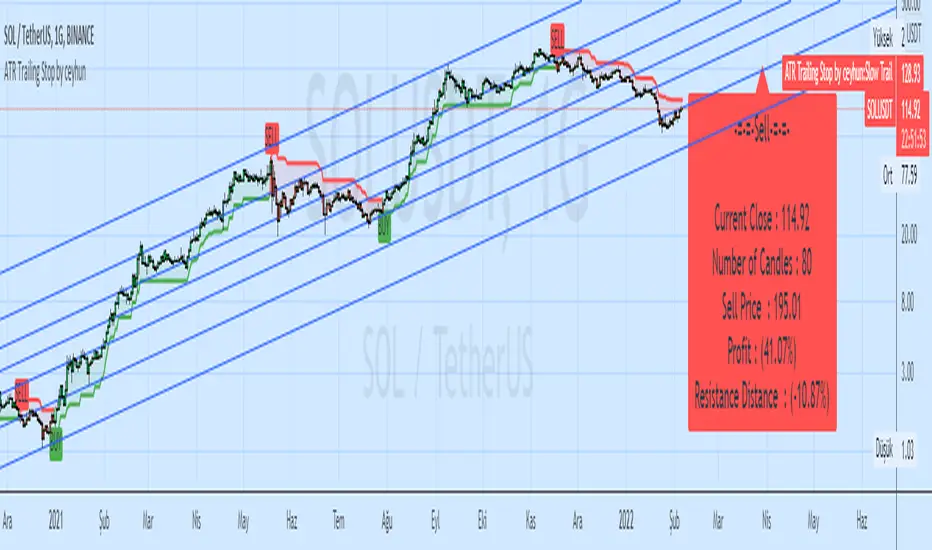
ATR Trailing Stop by ceyhunSame coding only coloring and information panel was added.
CDC ATR Trailing Stop V2.1 (2013)
//Barcolor
Green = Trail1 > Trail2 and close > Trail2 and low > Trail2
Blue = Trail1 > Trail2 and close > Trail2 and low < Trail2
Red = Trail2 > Trail1 and close < Trail2 and high < Trail2
Yellow = Trail2 > Trail1 and close < Trail2 and high > Trail2
//It gives White color where there is deterioration.
//InfoPanel
Buy Price = Blue draws the circles at the purchase price.
Profit Long>20 = Risk level taken as a percentage, I got the highest 20%, you can determine as you wish.
Sell Price = Red draws the circles at the purchase price.
Profit Short>20 = Risk level taken as a percentage, I got the highest 20%, you can determine as you wish.
TrenderTrender is a popular trailing stop indicator on the Bloomberg system and since I didn't have source code to work with, this is a close approximation of that indicator. Let me know if you spot any discrepancies and I will adjust accordingly.
This indicator is a trailing stop system along with a trend confirmation. When the blue line falls below the black line, that is a confirmation of a down trend and when it rises above the black line, it is a confirmation of an up trend. When the trender line is above the price, then that means the stock is in a general down trend and vice versa. I have color coded the trender line to show you when to buy or sell that stock to keep it easy.
This was a special request so let me know if you want to see more scripts from me or if you want something custom!

Guppy Count Back LineThe Guppy Count Back Line was created by Daryl Guppy and is essentially a trailing stop indicator. I have color coded the indicator to tell you if you should go long or short.
This was a special request so let me know if you would like me to write more scripts for other indicators!

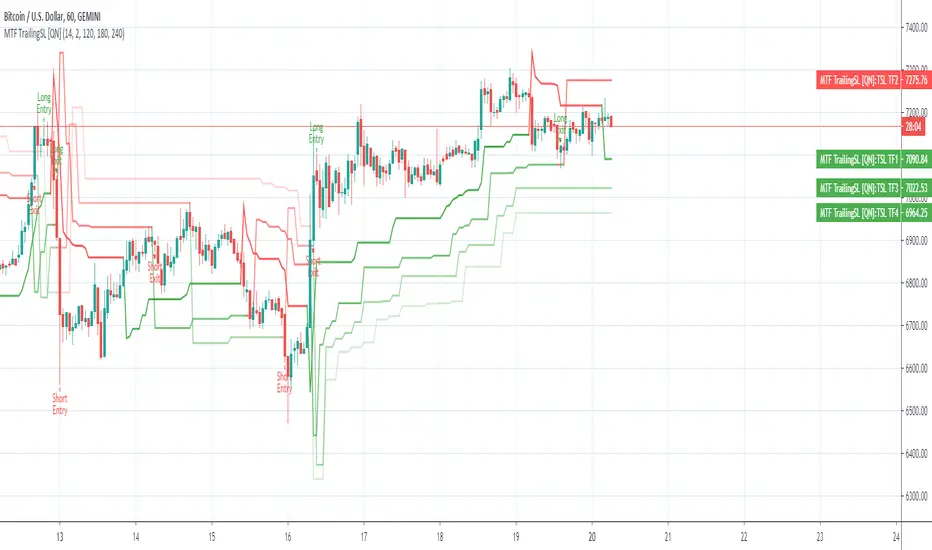
MTF Trailing SL Alerts [QuantNomad]These are alerts for my MTF Trailing SL Strategy.
Entry Long position if all 4 time-frames agree on the long signal.
Exit Long positions when at least 2 time-frames disagree on the long signals.
Entry to Short position if all 4 time-frames agree on Short signal.
Exit from Short positions when at least 2 time-frames disagree on Short signal.
Use "Once Per Bar Close" when creating alerts.
Link to the strategy:
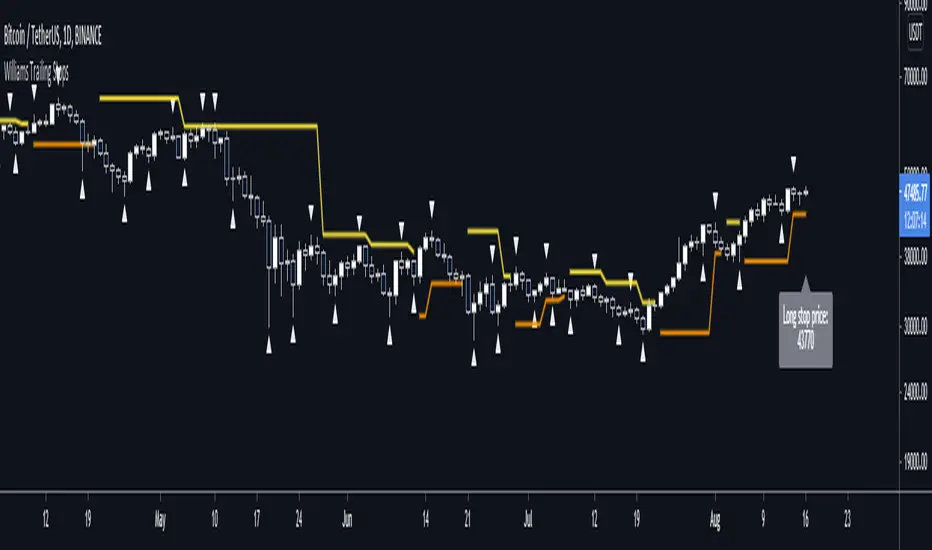
Williams Fractal Trailing StopsUnlike the built-in version, you can configure how many bars it takes to confirm a fractal. This indicator plots all Williams high and low fractals, and a stop line that trails the fractals up and down. Includes long and short stop alerts. You can choose whether the trail flips long-short based on the price being exceeded within a candle or on candle close. This indicator deals only with fractals and doesn't get into the Alligator or anything else.
I've commented it extensively, so that it might be useful for people learning Pinescript. Enjoy!
Trailing SL Alerts [QuantNomad]It's alerts version of my Trailing SL strategy:
Use "Once Per Bar" param when creating alerts.
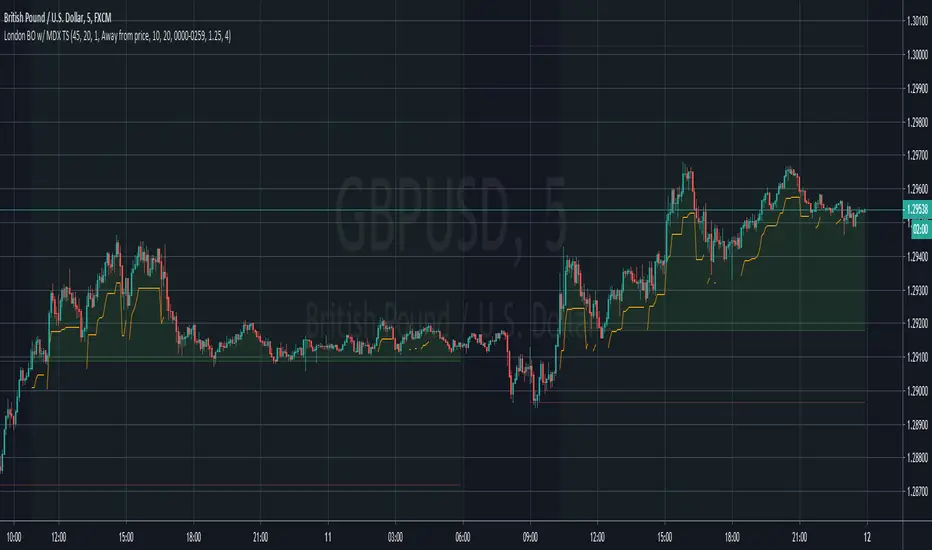
London Breakout with MDX Trailing StopThis indicator aims to aid in using the regular London Breakout strategy, as well as improve on it by adding a trailing stop based on the Mean Deviation Index.
The London Breakout strategy (according to my personal understanding) basically sees the morning before London open as the accumulation or distribution range for large buyers or sellers, and assumes the market will break either above that mornings high or below that mornings low when they start to move price. It is mostly used to trade stock indices and forex.
This indicator plots the morning high and low for each day. The green line is the morning high, and the red line is the morning low. If price moves above the green line (the morning high) it fills that area with a green color. If price moves below the green line (the morning low) it fills that area with a red color. This makes the breakouts easy to spot.
The background color of the chart turns green when the MDX is above 0 (price is more than X times ATR above the mean) and a breakout above the morning high has occurred, and stays green until the opposite happens.
The background color of the chart turns red when the MDX is below 0 (price is more than X times ATR below the mean) and a breakout above the morning high has occurred, and stays green until the opposite happens.
The default for X above is 1.0, but this can be changed in the settings by changing "ATR Multiplier".
The background is always neutral during the morning session since the morning high and morning low are not established yet.
A trailing stop is shown when price is more than X times away from the mean and a breakout has occured. The distance is set using the MDX. The trailing stop uses a separate ATR multiplier though, to make the signal and trailing stop MDX values different, if one likes. The default ATR multiplier for the trailing stop is 1.25, but this can be changed is the settings by changing "ATR multiplier for trailing stop".
When the high or low of a candle breaks the trailing stop, it is moved further away, indicating you have been stopped out, but gives opportunity to use it if you enter again (so it doesn't just disappear).
As an added bonus, take profit levels have been added based on the mornnig range. The take profit distance is set by multiplying the range with a factor. The levels are then plotted that distance from the morning high and morning low.
MDX:
Simple Moving Average - ATR Trailing StopThe old adage goes "Cut losers fast and let the winners run"
With this in mind, this will plot a dynamic trailing stop by subtracting any multiplier of the Average True Range (ATR) from the SMA of your choice.

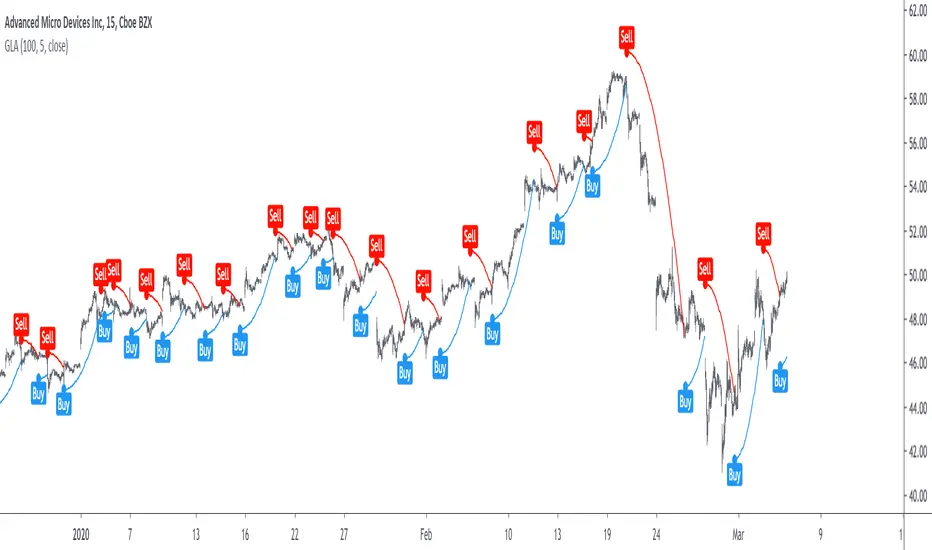
Grover Llorens Activator [alexgrover & Lucía Llorens] Trailing stops play a key role in technical analysis and are extremely popular trend following indicators. Their main strength lie in their ability to minimize whipsaws while conserving a decent reactivity, the most popular ones include the Supertrend, Parabolic SAR and Gann Hilo activator. However, and like many indicators, most trailing stops assume an infinitely long trend, which penalize their ability to provide early exit points, this isn't the case of the parabolic SAR who take this into account and thus converge toward the price at an increasing speed the longer a trend last.
Today a similar indicator is proposed. From an original idea of alexgrover & Lucía Llorens who wanted to revisit the classic parabolic SAR indicator, the Llorens activator aim to converge toward the price the longer a trend persist, thus allowing for potential early and accurate exit points. The code make use of the idea behind the price curve channel that you can find here :
I tried to make the code as concise as possible.
The Indicator
The indicator posses 2 user settings, length and mult , length control the rate of convergence of the indicator, with higher values of length making the indicator output converge more slowly toward the price. Mult is also related with the rate of convergence, basically once the price cross the trailing stop its value will become equal to the previous trailing stop value plus/minus mult*atr depending on the previous trailing stop value, therefore higher values of mult will require more time for the trailing stop to reach the closing price, use higher values of mult if you want to avoid potential whipsaws.
Above the indicator with slow convergence time (high length) and low mult.
Points with early exit points are highlighted.
Usage For Oscillators
The difference between the closing price and an overlay indicator can provide an oscillator with characteristics depending on the indicators used for differencing, Lucía Llorens stated that we should find indicators for differencing that highlight the cycles in the price, in other terms : Price - Signal , where we want to find Signal such that we maximize the visibility of the cycles, it can be demonstrated that in the case where the closing price is an additive model : Trend + Cycles + Noise , the zero lag estimation of the Trend component can allow for the conservation of the cycle and noise component, that is : Price - Estimate(Trend) , for example the difference between the price and moving average isn't optimal because of the moving average lag, instead the use of zero lag moving averages is more suitable, however the proposed indicator allow for a surprisingly good representation of the cycles when using differencing.
The normalization of this oscillator (via the RSI) allow to make the peak amplitude of the cycles more constant. Note however that such method can return an output with a sign inverse to the one of the original cycle component.
Conclusion
We proposed an indicator which share the logic of the SAR indicator, that is using convergence toward the price in order to provide early exit points detection. We have seen that this indicator can be used to highlight cycles when used for differencing and i don't exclude publishing more indicators based on this method.
Lucía Llorens has been a great person to work with, and provided enormous feedback and support while i was coding the indicator, this is why i include her in the indicator name as well as copyright notice. I hope we can make more indicators togethers in the future.
(altho i was against using buy/sells labels xD !)
Thanks for reading !
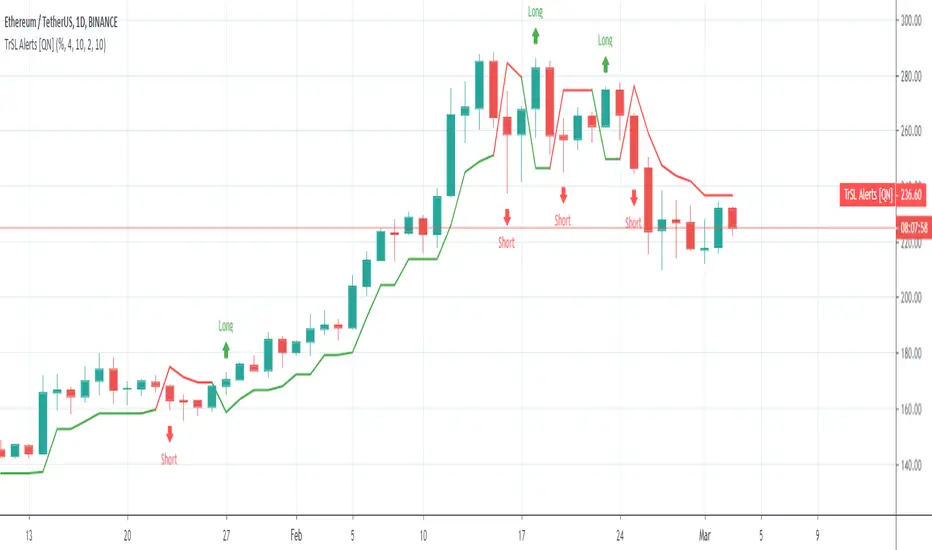
Trailing Stop Loss ATR + AlertI share this TSL indicator with alert (I use it only for Stocks), the configuration is very simple, you must select if it is a Short or Long operation, time at which the operation was opened,% of the daily ATR for TSL. It also contains:
- Alert
- Panel Info
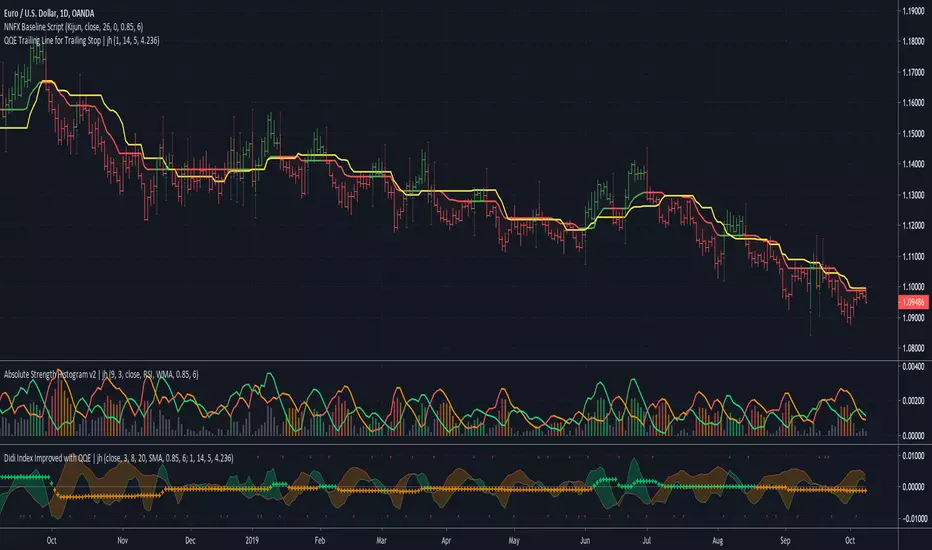
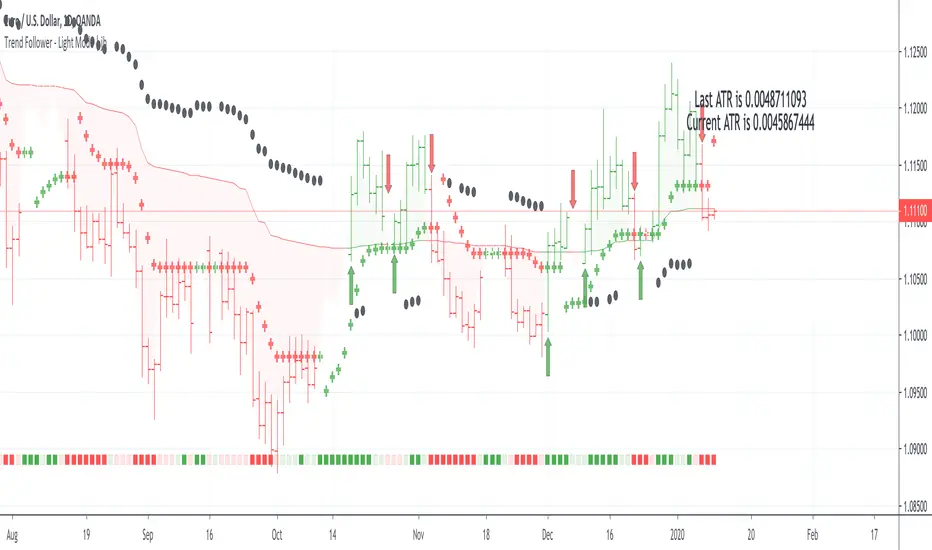
Trend Follower - Light Mode | jhFollow up script for my Trend Follower script.
I'm used to dark mode, so I coded a few key plots in white, so those are changed into black on the script.
Notably:
- > 1 ATR in black dots along the baseline
- Current and previous ATR text labels to the right of the price
- A text label spacing input that allows you to adjust the spacing for text label from price.
This is a trend following system that combines 3 indicators which provide different functionalities, also a concept conceived by VP's No Nonsense FX / NNFX method.
1. Baseline
The main baseline filter is an indicator called Modular Filter created by Alex Grover
- www.tradingview.com
- Alex Grover - Modular Filter
-------
That's the moving average like baseline following price, filtering long and short trends and providing entry signals when the price crosses the baseline.
Entry signal indicated with arrows.
2. Volume/Volatility, I will called it Trend Strength
The next indicator is commonly known as ASH, Absolute Strength Histogram.
This indicator was shared by VP as a two line cross trend confirmation indicator, however I discovered an interesting property when I modified the calculation of the histogram.
- Alex Grover Absolute Strength
-------
My modification and other info here
- Absolute Strength Histogram v2
-------
I simplified the display of the trend strength by plotting squares at the bottom of the chart.
- Lighted Squares shows strength
- Dimmed Squares shows weakness
3. Second Confirmation / Exits / Trailing Stop
Finally the last indicator is my usage of QQE (Qualitative Quantitative Estimation), demonstrated in my QQE Trailing Line Indicator
- QQE Trailing Line for Trailing Stop
-------
Three usages of this amazing indicator, serving as :
- Second trend confirmation
- Exit signal when price crosses the trailing line
- Trailing stop when you scaled out the second trade
This indicator is plotted with crosses.
Additional plots and information
Bar Color
- Green for longs, Red for shorts, White when the baseline direction conflicts with the QQE trailing line direction
- When it's white, it's usually ranging and not trending, ASH will also keep you off ranging periods.
-------
ATR Filter
- White circles along the baseline, they will show up if the price has moved more than one ATR from the baseline
- The default allowance is 1 ATR.
-------
The previous and current ATR value
- Label on the right side of the chart showing the previous and current value of ATR
Trend Follower | jhThis is a trend following system that combines 3 indicators which provide different functionalities, also a concept conceived by VP's No Nonsense FX / NNFX method.
1. Baseline
The main baseline filter is an indicator called Modular Filter created by Alex Grover
- www.tradingview.com
- Alex Grover - Modular Filter
-------
That's the moving average like baseline following price, filtering long and short trends and providing entry signals when the price crosses the baseline.
Entry signal indicated with arrows.
2. Volume/Volatility, I will called it Trend Strength
The next indicator is commonly known as ASH, Absolute Strength Histogram.
This indicator was shared by VP as a two line cross trend confirmation indicator, however I discovered an interesting property when I modified the calculation of the histogram.
- Alex Grover Absolute Strength
-------
My modification and other info here
- Absolute Strength Histogram v2
-------
I simplified the display of the trend strength by plotting squares at the bottom of the chart.
- Lighted Squares shows strength
- Dimmed Squares shows weakness
3. Second Confirmation / Exits / Trailing Stop
Finally the last indicator is my usage of QQE (Qualitative Quantitative Estimation), demonstrated in my QQE Trailing Line Indicator
- QQE Trailing Line for Trailing Stop
-------
Three usages of this amazing indicator, serving as :
- Second trend confirmation
- Exit signal when price crosses the trailing line
- Trailing stop when you scaled out the second trade
This indicator is plotted with crosses.
Additional plots and information
Bar Color
- Green for longs, Red for shorts, White when the baseline direction conflicts with the QQE trailing line direction
- When it's white, it's usually ranging and not trending, ASH will also keep you off ranging periods.
-------
ATR Filter
- White circles along the baseline, they will show up if the price has moved more than one ATR from the baseline
- The default allowance is 1 ATR.
-------
The previous and current ATR value
- Label on the right side of the chart showing the previous and current value of ATR
Adding my Didi and ASH indicators up on this screenshot
Didi Index Improved with QQE

BEST Multicolor Supertrend InfoPanelHello traders
Today is a Pinescript hack to display multiple colors in one label.
I used that panel to show the Supertrend Long Term values (weekly, monthly, quarterly, yearly)
What is a Supertrend?
Definition : SuperTrend is an indicator that works on all timeframes and all instruments (stocks, futures, forex, ...). It is a great tool to follow market trends and optimizes your profits.
SuperTrend evolves below or above the prices depending on the trend. You can use it as an exit position indicator when its direction changes. You can also use it to place your stops.
So.... the hack is?
The hack is about creating a new label for each line - versus creating just one label containing the whole text
Best regards,
Dave

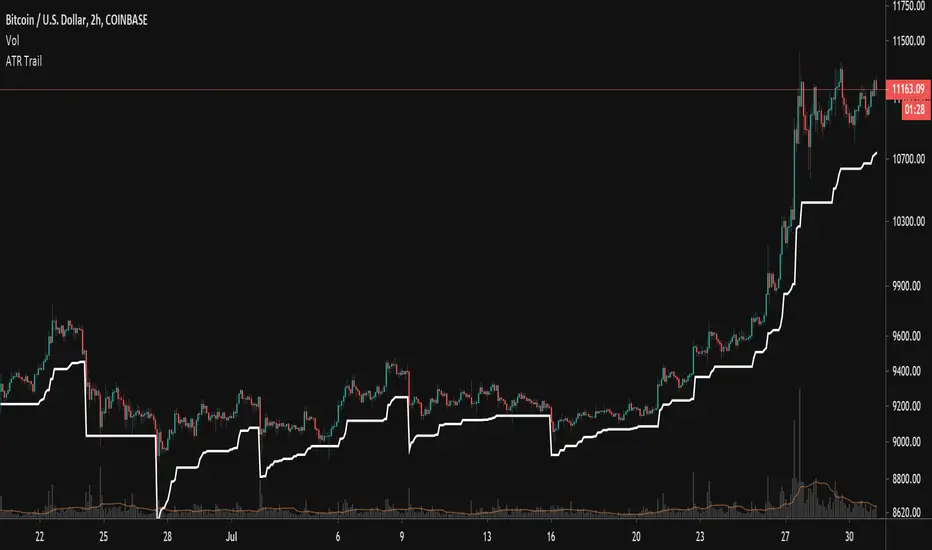
Trailing ATR StopsThis script plots a trailing stop of the ATR multiplied by a user-defined number. Since it is meant to be used as a trailing stop, the value doesn't fluctuate with the price as a normal ATR indicator does, but stays fixed unless price moves away from it. In that case it follows the price. If price crosses the stop level, it resets itself based on current price and starts trailing all over again.
User Settings:
Support - Use for a trailing stop while long
Resistance - Use for a trailing stop while short
Both - Acts like a channel and can spot periods of lower volatility
Market Adaptive Stop-LossI realized that the zone changes in the stoploss remained slow, so I couldn't make enough use of the characteristics of technical indicators when opening positions.
This pushed me to keep stop-loss under the influence of a dependent variable.
This script helped me a lot (everget) :
I've redesigned the stop-loss to be affected by intersections.
Therefore, this script is also suitable for adaptive moving averages, fractional periods.
Script features:
1.You can select calculation methods created by using various technical analysis methods from the scripts' settings:
-Moving Average Convergence Divergence ( Macd )
-Stochastic Oscillator ( Stoch )
-Stochastic Relative Strength Index (StochRSI)
-Stochastic Money Flow Index (StochMFI ) (More info : )
-Know Sure Thing ( KST )
-OBV ( On Balance Volume )
-SMA ( Simple Moving Average )
-EMA ( Exponential Moving Average )
-FISHERTRANSFORM ( Fisher Transform )
-AWESOMEOSCILLATOR( Awesome Oscillator )
-PSAR ( Parabolic Stop and Reverse - Parabolic SAR )
-HULLMA( Hull Moving Average )
-VWMA ( Volume Weighted Moving Average )
-RMA (Moving Average using in Relative Strength Index calculations.)
-COG (Center of Gravity )
-ACC-DIST ( Accumulation / Distribution Index )
2 - The region is determined according to the above calculation methods and if it is larger or smaller than the previous stop loss level.
And if the price in the negative zone is lower than the stoploss, it is the exact signal and is shown with more highlighted colors.
And, in the positive zone, where the price is greater than the stoploss, the trade zones are certain.
Shown with more highlighted colors.
If the zones are correct but stop-loss is not suitable for opening positions:
In other words, if the stop-loss is above/under the highest-lowest levels in the positive zone or if the stop loss is located in the lower zone in the negative zone, these zones are shown to be darker and dimmed so that they do not cause false movements.
*** SUMMARY : As a result, you can use this script with support and resistances,and trend lines to get good results.
I hope it helps in your analyzes. Best regards.

QQE Trailing Line for Trailing Stop | jhUsing parts of QQE (Qualitative Quantitative Estimation) again, this time I'm applying the trailing line of QQE on price directly.
Outcome, it's behaving like a baseline filter and it can be use as an exit or a trailing stop indicator.
As comparing to Kijun-sen line in yellow, the QQE trailing line follows the price closer, therefore exiting you sooner when the trend direction changes.
There's 2 QQE option, they behave differently during the trend change.
Credits to Glaz and Shizaru for their QQE code.