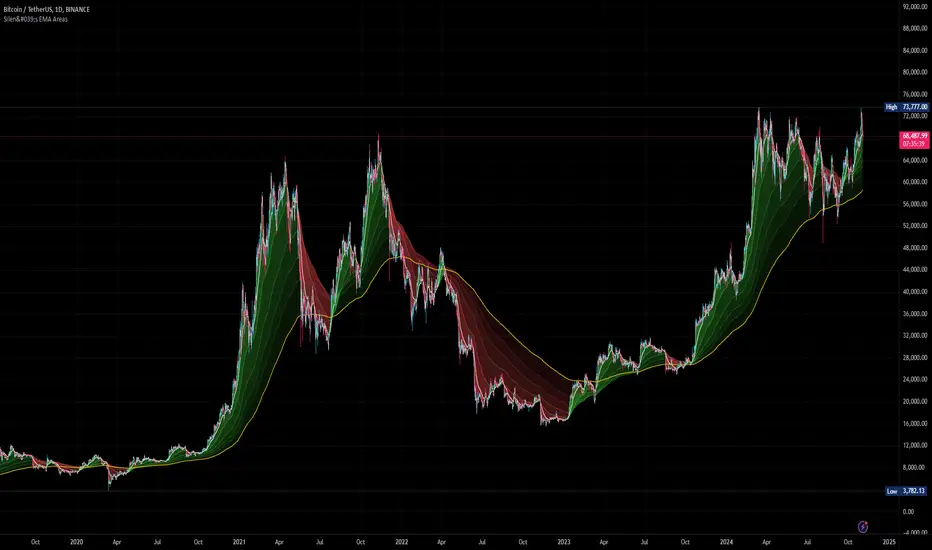
Silen's EMA AreasAre you tired of reading candles? 🧨 Do you want to bring more meaning to your chart? 🧹
Then this is the script for you!
This script does:
- Add several meaningfully pre-configured EMA lines to your chart - up to EMA 300
- Colors the areas between EMA lines in 3d colors - green and red
- The Smaller the EMA, the firmer the color
- Highlights the EMA 300 in a golden color
What is the meaning of this?
Let me introduce a new word to you: EMA FOLDING .
Yes, you heard right. With this indicator you can see in 3D how EMA lines are folding above and below each other, indicating severe mood swings in the chart.
This helps you keep track of what your instrument is actually doing while it enables you to cancel out the noise and messyness of ordinary candles which can be quite random and hard to read.
Once an EMA is fully positive or negatively folded (all ema lines are green and above each other from largest EMA to smallest EMA and vice versa for negatively folded) you can be sure that you are in a Trend or certain mood (for higher timeframes, from 15mins on).
I don't ever want to read any chart without having this indicator on. Whenever I present charts to anybody I use this indicator - and the feedback is insanely positive. People tend to read and understand charts much better with this indicator than just staring at candles.
Why is this indicator different to other EMA indicators and should thereby not be deleted by the TradingView Team due to redundance with other EMA indicators?
- This is not a simple indicator for EMAs
- Rather, this is an indicator to better and easier read the whole chart
- You can detect mood swings very easily which is very hard to do with a normal EMA indicator
- I haven't found any EMA indicator on TradingView that does this job so i sincerely believe it is extremely unique
- I sincerely believe it can help people get a much better understanding of charts without actualy getting into details of EMA's or even needing to know what an EMA is.
This indicator isn't intended for trading purposes, rather it is intended to give you a better and easier understanding of the chart. Of course - you can also use it for your trading but like I said, that is not the primary intended purpose.
This indicator comes pre-configured with quite optimal values (in my opinion) but of course can be fully customized. 🧮
Test it for yourself!
Trendpattern
Engulfing Pattern & Impulse [UAlgo]The Engulfing Pattern & Impulse is a tool designed for technical traders who utilize price action and volume analysis to assess market trends and potential reversals. This indicator identifies two powerful trading signals: Engulfing Patterns and Volume Impulses, which are essential components for evaluating potential bullish or bearish market momentum.
Engulfing Patterns are classic candlestick formations often associated with reversals or trend continuations, depending on the overall trend context. This indicator highlights both bullish and bearish engulfing patterns based on configurable criteria such as trend detection settings, comparison with average body size, and a customizable body multiplier for validation. The Volume Impulse feature signals moments of significant volume compared to historical levels, which often precede substantial price movements. Together, these features provide traders with a versatile tool for better timing entry and exit points.
The indicator also offers an adaptive trend detection system, allowing traders to choose from multiple methods (e.g., SMA50 or SMA50/SMA200 combinations) to assess the trend context, making it ideal for various market conditions.
🔶Key Features
Engulfing Pattern Detection: Identifies bullish and bearish engulfing patterns with customizable parameters, including body length and average size comparison.
Configurable trend basis: Choose between SMA50 or SMA50 with SMA200 to define trend direction.
Body size multiplier: Adjust the size threshold for valid engulfing patterns, providing flexibility based on market conditions.
Volume Impulse Signal: Highlights volume spikes that meet or exceed a specified multiplier, which can indicate increased buying or selling interest.
Customizable volume period and multiplier: Allows you to tailor the volume impulse detection based on the instrument’s average volume behavior.
Trend Detection Options: Select different trend detection methods to suit various trading styles and instruments.
SMA50-based detection: Classifies the trend based on the position of price relative to the 50-period SMA.
SMA50 and SMA200 combination: Incorporates a dual-moving average approach, classifying trends based on the relationship between price, SMA50, and SMA200.
Enhanced Visualization: Distinguishes bullish and bearish signals with customizable colors, providing clear and immediate visual cues for easy interpretation.
Custom label colors: Allows you to set distinct colors for bullish, bearish, and neutral signals for quick identification.
Pattern filtering: Enable or disable specific patterns (Bullish, Bearish, or Both) based on your trading preferences.
🔶 Interpreting Indicator
Bullish Engulfing Pattern: Indicates a potential bullish reversal in a downtrend. This signal occurs when a white candlestick with a body size exceeding a specified multiplier completely engulfs the previous black candlestick. The pattern will display a “BE” label below the candle if it meets the criteria, signaling potential upward momentum.
Bearish Engulfing Pattern: Indicates a potential bearish reversal in an uptrend. A black candlestick with a body size exceeding the specified multiplier fully engulfs the previous white candlestick, signaling possible downward movement. The “BE” label appears above the candle to denote this pattern.
Volume Impulse Up: Displays a “VI” label below the candle when the volume surpasses the defined multiplier, and the price closes higher than it opened, indicating strong upward buying interest.
Volume Impulse Down: Displays a “VI” label above the candle when the volume meets or exceeds the specified threshold, and the price closes lower than it opened, signaling strong selling pressure.
Indicator uses the SMA50 and SMA200 to determine trend direction due to their popularity in technical analysis as indicators of medium- and long-term trends. The SMA50 reflects the average price over the past 50 periods, providing insight into intermediate trends, while the SMA200 is often used to identify the broader trend direction. These SMAs help traders quickly assess whether the market is in an uptrend, downtrend, or consolidation phase, enhancing decision-making for both short-term and long-term strategies.
🔶 Disclaimer
Use with Caution: This indicator is provided for educational and informational purposes only and should not be considered as financial advice. Users should exercise caution and perform their own analysis before making trading decisions based on the indicator's signals.
Not Financial Advice: The information provided by this indicator does not constitute financial advice, and the creator (UAlgo) shall not be held responsible for any trading losses incurred as a result of using this indicator.
Backtesting Recommended: Traders are encouraged to backtest the indicator thoroughly on historical data before using it in live trading to assess its performance and suitability for their trading strategies.
Risk Management: Trading involves inherent risks, and users should implement proper risk management strategies, including but not limited to stop-loss orders and position sizing, to mitigate potential losses.
No Guarantees: The accuracy and reliability of the indicator's signals cannot be guaranteed, as they are based on historical price data and past performance may not be indicative of future results.

Hermes Reg FIBONACCI V.4Hermes Reg Fibonacci V.4 Indicator User Guide
Overview
The Hermes Reg Fibonacci V.4 indicator is a versatile tool used for identifying market trends and channels. This indicator analyzes price movements using logarithmic regression and Fibonacci levels, helping users determine the direction of the trend and identify support/resistance levels.
Parameters and Inputs
Source: The price data to be used in the calculations of the indicator. The default is the close price.
Length: The period length for the calculations of the indicator. The default is 262 and the minimum value is 10.
Deviation Multiplier (devlen): Set to 1.6.
Extend Lines: Determines whether the lines should be extended to the right of the chart.
Show Fibonacci Levels: Determines whether Fibonacci levels should be displayed.
Show Broken Channel: Determines whether to display the broken channel lines.
Up Trend Color (upcol): The color of the uptrend line.
Down Trend Color (dncol): The color of the downtrend line.
Fibonacci Up Trend Color (fibupcol): The color of the Fibonacci uptrend line.
Fibonacci Down Trend Color (fibdncol): The color of the Fibonacci downtrend line.
Channel Line Width (widt): The width of the channel line.
Fibonacci Line Width (fibwidt): The width of the Fibonacci line.
Working Mechanism of the Indicator
Logarithmic Source and Regression Channel Calculations:
The indicator takes the logarithm of the price data and calculates the logarithmic regression channel.
It calculates the middle line of the channel, slope, and the starting and ending points.
The standard deviation and the upper/lower boundaries of the channel are determined.
Channel and Fibonacci Levels:
Depending on user preferences, channel lines and Fibonacci levels are drawn on the chart.
Channel lines and Fibonacci levels are dynamically updated based on the slope and price movement.
When the channel is broken, it is displayed with the specified color and style.
Trend Direction and Alert Conditions:
The direction of the trend is determined based on whether the slope is positive or negative.
Alert conditions are defined for trend changes and channel breaks.
Symbols indicating the trend direction are displayed on the chart.
Usage Recommendations
Trend Following: The Hermes Reg Fibonacci V.4 indicator can be used to determine the current trend direction and identify potential trend reversal points.
Support and Resistance Levels: The indicator helps identify support and resistance levels by observing how the price moves within the channel.
Fibonacci Analysis: Fibonacci levels can be used to identify potential retracement and extension points.
Alerts and Notifications: Set alerts for trend changes and channel breaks to avoid missing important price movements.
The Hermes Reg Fibonacci V.4 indicator, with its user-friendly interface and flexible parameters, can be effectively used in different market conditions. By customizing the indicator, you can tailor it to suit your trading strategy.

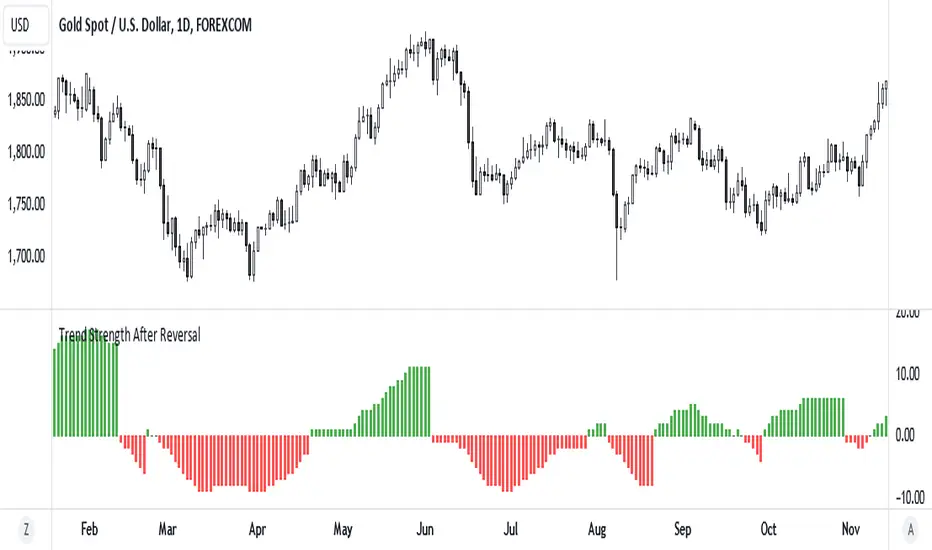
Trend Strength After Reversal
This indicator measures trend strength after the reversal.
It can catch early reversal based on engulfing candlestick pattern or just the regular reversal.
Every reversal have to be confirmed by a close above reversal pattern.
Trend strength is measured by counting subsequent closing confirming the reversal
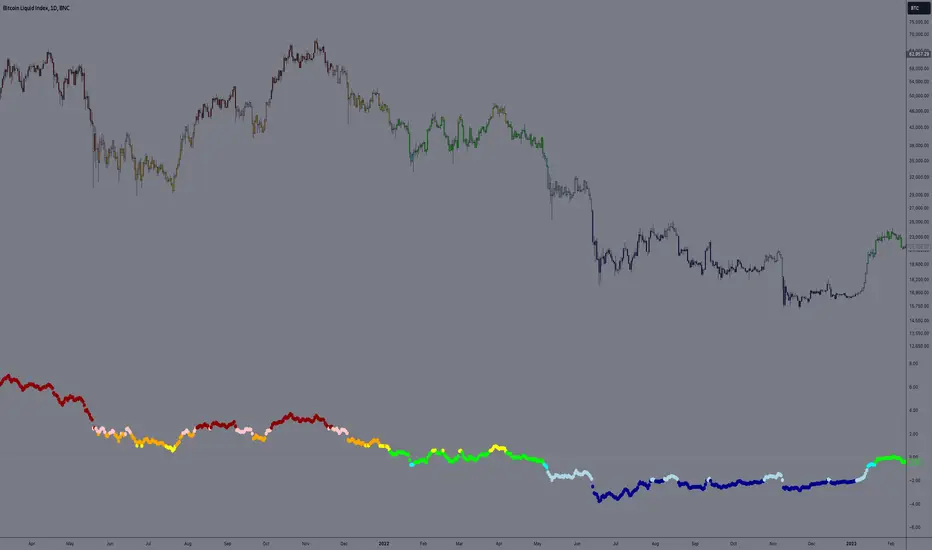
E9 PLRRThe E9 PLRR (Power Law Residual Ratio) is a custom-built indicator designed to evaluate the overvaluation or undervaluation of an asset, specifically by utilizing logarithmic price data and a power law-based model. It leverages a dynamic regression technique to assess the deviation of the current price from its expected value, giving insights into how much the price deviates from its long-term trend.
This indicator is primarily used to detect market extremes and cycles, often used in the analysis of long-term price movements in assets like Bitcoin, where cyclical behavior and significant price deviations are common.
This chart is back from 2019 and shows (From left to right) 2018 Bear market bottom at $3.5k (Dark Blue) , following a peak at 12k (dark red) before the Covid crash back down to EUROTLX:4K (Dark blue)
Key Components
Logarithmic Price Data:
The indicator works with logarithmic price data (ohlc4), which represents the average of open, high, low, and close prices. The logarithmic transformation is crucial in financial modeling, especially when analyzing long-term price data, as it normalizes exponential price growth patterns.
Dynamic Exponent 𝑘:
The model calculates a dynamic exponent k using regression, which defines the power law relationship between time and price. This exponent is essential in determining the expected power law price return and how far the current price deviates from that expected trend.
Power Law Price Return:
The power law price return is computed using the dynamic exponent
k over a defined period, such as 365 days (1 year). It represents the theoretical price return based on a power law relationship, which is used to compare against the actual logarithmic price data.
Risk-Free Rate:
The indicator incorporates an adjustable risk-free rate, allowing users to model the opportunity cost of holding an asset compared to risk-free alternatives. By default, the risk-free rate is set to 0%, but this can be modified depending on the user's requirements.
Volatility Adjustment:
A key feature of the PLRR is its ability to adjust for price volatility. The indicator smooths out short-term price fluctuations using a moving average, helping to detect longer-term cycles and trends.
PLRR Calculation:
The core of the indicator is the calculation of the Power Law Residual Ratio (PLRR). This is derived by subtracting the expected power law price return and risk-free rate from the logarithmic price return, then multiplying the result by a user-defined multiplier.
Color Gradient:
The PLRR values are represented visually using a color gradient. This gradient helps the user quickly identify whether the asset is in an undervalued, fair value, or overvalued state:
Dark Blue to Light Blue: Indicates undervaluation, with increasing blue tones representing a higher degree of undervaluation.
Green to Yellow: Represents fair value, where the price is aligned with the expected power law return.
Orange to Dark Red: Indicates overvaluation, with increasing red tones representing a higher degree of overvaluation.
Zero Line:
A zero line is plotted on the indicator chart, serving as a reference point. Values above the zero line suggest potential overvaluation, while values below indicate potential undervaluation.
Dots Visualization:
The PLRR is plotted using dots, with each dot color-coded based on the PLRR value. This dot-based visualization makes it easier to spot significant changes or reversals in market sentiment without overwhelming the user with continuous lines.
Bar Coloring:
The chart’s bars are colored in accordance with the PLRR value at each point in time, making it visually clear when an asset is potentially overvalued or undervalued.
Indicator Functionality
Cycle Identification : The E9 PLRR is especially useful for identifying cyclical market behavior. In assets like Bitcoin, which are known for their boom-bust cycles, the PLRR can help pinpoint when the market is likely entering a peak (overvaluation) or a trough (undervaluation).
Overvaluation and Undervaluation Detection: By comparing the current price to its expected power law return, the PLRR helps traders assess whether an asset is trading above or below its fair value. This is critical for long-term investors seeking to enter the market at undervalued levels and exit during periods of overvaluation.
Trend Following: The indicator helps users identify the broader trend by smoothing out short-term volatility. This makes it useful for both momentum traders looking to ride trends and contrarian traders seeking to capitalize on market extremes.
Customization
The E9 PLRR allows users to fine-tune several parameters based on their preferences or specific market conditions:
Lookback Period:
The user can adjust the lookback period (default: 100) to modify how the moving average and regression are calculated.
Risk-Free Rate:
Adjusting the risk-free rate allows for more realistic modeling of the opportunity cost of holding the asset.
Multiplier:
The multiplier (default: 5.688) amplifies the sensitivity of the PLRR, allowing users to adjust how aggressively the indicator responds to price movements.
This indicator was inspired by the works of Ashwin & PlanG and their work around powerLaw. Thank you. I hall be working on the calculation of this indicator moving forward to make improvements and optomisations.
Dynamic Touch Trendlines [QuantVue]The Dynamic Touch Trendlines (DTT) indicator automatically draws and manages trendlines on your chart, helping traders identify key support and resistance levels.
What sets the DTT indicator apart from other trendline indicators is its ability to let traders customize the number of touches required to validate a trendline. This flexibility allows you to fine-tune the indicator for different markets or trading styles, ensuring only strong trendlines with the specified number of touches are considered valid.
This indicator features both uptrend lines (drawn from pivot lows) and downtrend lines (drawn from pivot highs), making it suitable for detecting bullish and bearish trends.
An uptrend line connects three (default setting) or more significant lows, showing where price has historically found support. Traders often look for price to bounce off this line during pullbacks in an uptrend.
When price breaks below an uptrend line, it suggests a weakening of the bullish trend. This could mean that buyers are losing strength, and the market may be transitioning into a bearish phase, providing a potential opportunity for traders to enter short positions or exit long positions.
Conversely, a downtrend line connects three (default setting) or more significant highs, indicating potential resistance in a downtrend. Price action below this line can signal continued bearish momentum.
When price breaks above a downtrend line, it indicates a potential reversal of the bearish trend. This can signal the end of selling pressure and the beginning of a new bullish phase, offering traders a potential opportunity to enter long positions.
Key settings:
Minimum Touches: This sets the number of price touches required to validate a trendline. Increasing the minimum touches filters out weaker trends, ensuring that only more reliable trendlines are drawn.
Buffer: The buffer is used to account for minor price overshoots or near misses relative to the trendline. It creates a margin around the trendline, allowing price to come close to the line—whether it overshoots slightly or falls just short—and still count as a valid touch. This helps ensure that small price fluctuations or market noise don’t prevent valid trendline touches from being recognized, making the trendlines more reliable.
Trendline Break Source: Allows traders to define how a trendline is considered broken—either based on the close of the price bar or the wicks (highs and lows) of the price action.
The DTT indicator also features alerts whenever a new trendline is detected or an existing trendline is broken!

Money Flow Index Crossover IndicatorThe "Money Flow Index Crossover Indicator" is a specialized technical analysis tool designed to assist traders by providing a clear visualization of potential buy and sell signals based on the Money Flow Index (MFI) and its smoothed moving average (SMA). This indicator delineates overbought and oversold zones, offering valuable insights into market dynamics. It operates as an oscillator on a separate pane, helping traders identify bullish and bearish market conditions with greater precision. By incorporating k-Nearest Neighbor (KNN) machine learning techniques, this indicator enhances the reliability and accuracy of the signals provided.
Originality and Usefulness:
This script is not just a simple mashup of existing indicators but integrates multiple components to create a unique and comprehensive analysis tool. The combined information from the MFI, its smoothed moving average, and the KNN machine learning techniques influence the form and accuracy of the Money Flow Index Average line and the Smoothed Money Flow Index line giving a visually helpful representation of overbought and oversold conditions. These lines are displayed in an oscillator style crossover, allowing users to visualize potential buy and sell zones for setting up potential signals. The user can adjust various settings of these tools behind the code to fine-tune the behavior and sensitivity of these lines. This integration provides a more robust and insightful trading tool that can adapt to different market conditions and trading styles.
How It Works:
Inputs:
MFI Settings:
Show Signals: Allows users to toggle the display of MFI and SMA crossing signals, which are critical for identifying potential market reversals.
Plot Amount: Determines the number of plots in the heat map, ranging from 2 to 28, enabling customization based on user preference.
Source: Defines the data source for MFI calculations, typically set to OHLC4 for a balanced view of price movements.
Smooth Initial MFI Length: Specifies the smoothing length for the initial MFI calculations to reduce noise and enhance signal clarity.
MFI SMA Length: Sets the length for the SMA used to smooth the MFI average, providing a more stable reference line.
Machine Learning Settings:
Use KInSource: Option to average MFI data by adding a lookback to the source, improving the accuracy of historical comparisons.
KNN Distance Requirement: Defines the distance calculation method for KNN (Max, Min, Both) to refine the data filtering process.
Machine Learning Length: Specifies the amount of machine learning data stored for smoothing results, balancing between responsiveness and stability.
KNN Length: Sets the number of KNN used to calculate the allowable distance range, enhancing the precision of the machine learning model.
Fast and Slow Lengths: Defines the lengths for fast and slow MFI calculations, allowing the indicator to capture different market dynamics.
Smoothing Length: Determines the length at which MFI calculations start for a more smoothed result, reducing false signals.
Variables and Functions:
KNN Function: Filters machine learning data to calculate valid distances based on defined criteria, ensuring more accurate MFI averages.
MFI Calculations: Computes both fast and slow MFI values, applies smoothing, and stores them for KNN processing to refine signal generation.
MFI KNN Calculation: Uses the KNN function to calculate the machine learning average of MFI values, enhancing signal reliability.
MFI Average and SMA: Calculates the average and smoothed MFI values, which are crucial for determining crossover signals.
Calculations:
MFI Values: Calculates current fast and slow MFI values and applies smoothing to reduce market noise.
Storage Arrays: Stores MFI data in arrays for KNN processing, enabling historical comparison and pattern recognition.
KNN Processing: Computes the machine learning average of MFI values using the KNN function, improving the robustness of signals.
MFI Average: Scales the MFI average to fit the heat map and calculates the smoothed SMA, providing a clear visual representation of trends.
Crossover Signals: Identifies bullish (MFI crossing above SMA) and bearish (MFI crossing below SMA) signals, which are key for making trading decisions.
Plots and Visuals:
MFI Average and SMA Lines: Plots the MFI average and smoothed SMA on the chart, allowing traders to easily visualize market trends and potential reversals.
Zones: Defines and plots overbought, neutral, and oversold zones for easy visualization. The recommended settings for these zones are:
Overbought Zone: Level set to approximately 24.6, indicating a potential market top.
Neutral Zone: Level set to 14, representing a balanced market condition.
Oversold Zone: Level set to 5.4, signaling a potential market bottom.
Crossover Marks: Plots circles on the chart to indicate bullish and bearish crossover signals, making it easier to spot entry and exit points.
Visual Alerts:
Bullish and Bearish Alerts: one can see overbought and oversold conditions and up alert conditions for bullish and bearish MFI crossover signals, enabling traders to have access to visual cues when these events are on trajectory to occur and, if they occur, act promptly with the visual representation of its zones.
Why It's Helpful:
The "Money Flow Index Crossover Indicator" provides traders with a sophisticated tool to identify potential buy and sell conditions based on the combined information of the MFI and its smoothed moving average. The KNN machine learning techniques enhance the accuracy of this indicator's clear visual representation of overbought, neutral, and oversold zones. This combination of data represented on the chart helps traders make informed decisions about market conditions. This indicator is particularly useful for traders looking to refine their entry and exit points by leveraging advanced data analysis in respect to overbought and oversold conditions.
Disclaimer:
This indicator is intended to assist traders in making informed decisions based on technical analysis. However, it is not a guarantee of future performance and should be used in conjunction with other analysis techniques and risk management practices. Past performance is not indicative of future results, and traders should exercise caution and perform their own due diligence before making any trading decisions.

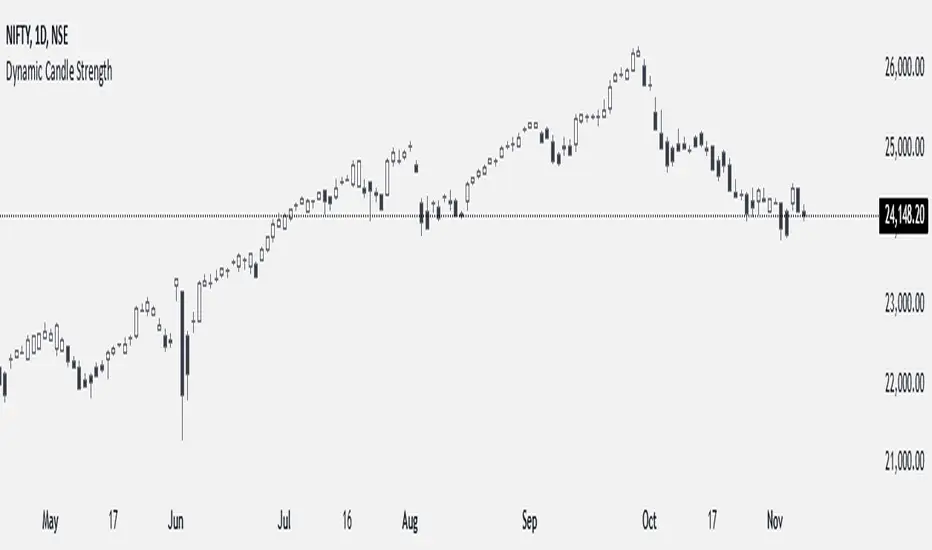
Dynamic Candle StrengthHow It Works
Initialization of Dynamic Levels:
The first candle's high and low are taken as the initial dynamic high and dynamic low levels.
If the next candle's close price is above the dynamic high, the candle is colored green, indicating bullish conditions.
If the next candle's close price is below the dynamic low, the candle is colored black, indicating bearish conditions.
If a candle's high and low crossed both the dynamic high and dynamic low, the dynamic high and low levels are updated to the high and low of that candle, but the candle color will continue with the same color as the previous candle.
Maintaining and Updating Dynamic Levels:
The dynamic high and low are only updated if a candle's close is above the current dynamic high or below the current dynamic low.
If the candle does not close above or below these levels, the dynamic high and low remain unchanged.
Visual Signals:
Green Bars: Indicate that the candle's close is above the dynamic high, suggesting bullish conditions.
Black Bars: Indicate that the candle's close is below the dynamic low, suggesting bearish conditions.
This method ensures that the dynamic high and low levels are adjusted in real-time based on the most recent significant price movements, providing a reliable measure of market sentiment.
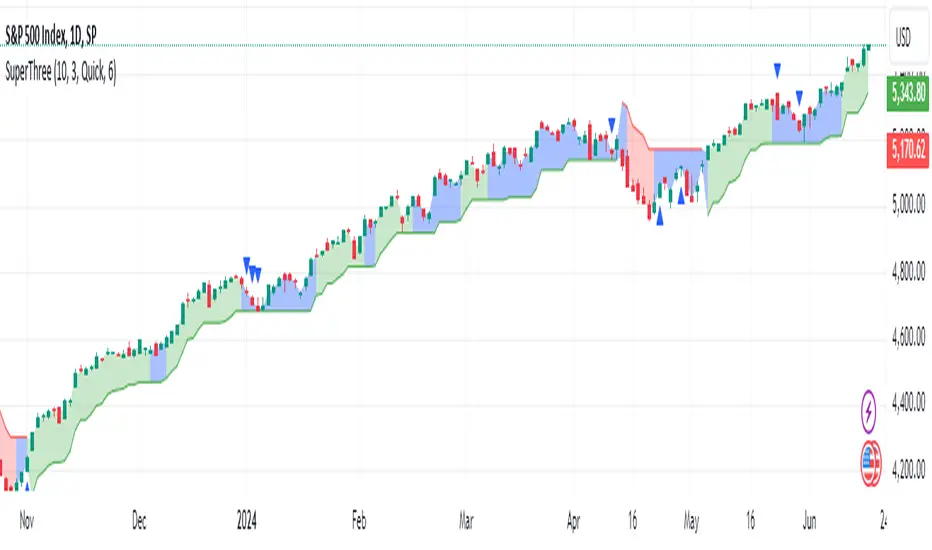
SuperThreeThe SuperThree is a comprehensive technical indicator designed to identify and visualize market trends and counter-trend momentum in trading. It uses a unique color-coding system to represent different market conditions and potential trading opportunities.
Uptrend (Green Fill) : This is indicated by a green fill. An uptrend is a period where prices are increasing overall, suggesting a strong market. It’s an ideal time for traders to consider entering long positions or exiting short positions.
Downtrend (Red Fill) : This is represented by a red fill. A downtrend is a period where prices are decreasing overall, indicating a bearish market. Traders might consider entering short positions or exiting long positions during this phase.
Sideways Trend (Blue Fill) : This is shown by a blue fill. A sideways trend, also known as a horizontal trend, is when the price is relatively stable and not making significant upward or downward movements. It’s often a period of consolidation before the price moves up or down.
Counter-Trend Momentum (Blue Arrows) : Blue arrows indicate counter-trend momentum, which can be a signal to exit trades or look for potential trend reversals. These are crucial points where the market’s momentum is shifting and may be about to move in the opposite direction.
The SuperThree indicator is an enhancement of the Supertrend indicator, providing additional features and visual cues to help traders make informed decisions. However, like all indicators, it should be used in conjunction with other forms of analysis to confirm signals and avoid potential false positives. Always consider your risk tolerance and investment goals before making trading decisions.
Happy trading! 😊
ZigZag ProHello Traders!
TRN ZigZag Pro is an indicator which identifies, and highlights pivot points (swings) and prints useful information about the swings in the chart (e.g. length, duration, ...). The indicator uses an extremely precise swing algorithm to detect the most important pivot points. Compared to other swing or zig-zag indicators TRN ZigZag Pro works in real-time, does not need a look-a-head to find swings and is not repainting. Moreover, equal (double) highs and lows are detected and displayed. The TRN ZigZag Pro helps traders to visualize pure price action and supports the trader to identify key turning points or trends.
The indicator comes with the following features:
Precise real-time swing detection without repainting
Equal/double high and low detection
Displaying of swing labels, values and information
Customizable settings as well as look and feel
It's important to note that the TRN ZigZag Pro is a visual tool and does not provide specific buy or sell signals. It serves as a guide for traders to analyze market structure in depth and make well-informed trading decisions based on their trading strategy and additional technical analysis.
Getting an edge with the TRN ZigZag Pro
The indicator clearly displays up trends, defined as a sequence of higher highs (HH) and higher lows (HL), with green labels and down trends, defined as a sequence of lower lows (LL) and lower highs (LH), with red labels. Equal highs/double tops (DT) and equal lows/ double bottoms (DB) are highlighted in gold.
In addition, the labels show a full stack of valuable information about the swings to maximize your accuracy.
Length
Length percentage in relation to the last swing length
Duration
Label (e.g. HH, LL...)
Use cases for swing detection
Trend Identification
By connecting the swing highs and lows, traders can identify and analyze the prevailing trend in the market. An uptrend is characterized by higher swing highs and lows, while a downtrend is characterized by lower highs and lower lows. The indicator helps traders visually to assess the strength and continuity of the trend.
Support And Resistance Levels
The swing highs and lows can act as support and resistance levels. Swing highs may act as resistance levels where selling pressure increases, while swing lows may act as support levels where buying pressure increases. Traders often pay attention to these levels as potential areas for trade entries, exits, or placing stop-loss orders.
Pattern Recognition
The swings identified by the indicator can help traders recognize chart patterns, such as equal high/lows, consolidations, wedges, triangles or more complex patterns like Gartley or Head and Shoulders. These patterns can provide insights into potential trend continuation or reversal.
Trade Entry and Exit
Traders may use TRN ZigZag Pro to determine potential trade entry and exit points. For example, in an uptrend, traders may look for opportunities to enter long positions near swing lows or on pullbacks to support levels. Conversely, in a downtrend, traders may consider short positions near swing highs or on retracements to resistance levels.
Conclusion
While signals from TRN ZigZag Pro can be informative, it is important to recognize that their reliability may vary. Various external factors can impact market prices, and it is essential to consider your risk tolerance and investment goals when executing trades.
Risk Disclaimer
The content, tools, scripts, articles, and educational resources offered by TRN Trading are intended solely for informational and educational purposes. Remember, past performance does not ensure future outcomes.

Trend Bars (HTF PO3)Hello Traders!
The innovative TRN Trend Bars are designed to help traders to analyze markets in an intuitive way. The TRN Trend Bars show bullish and bearish trends and reversals based on color coding the bars and give high probability trade opportunities.
How does the Trend Detection work in detail?
The trend analysis is based on a new algorithm that includes several different inputs:
detection of classical and advanced bar patterns
the statistical frequency of these bar patterns and their statistical outcomes are computed based on historical data
probability distributions of price expansions after certain bar patterns
bar information such as wick length in %, overlapping of the previous bar in % and many more
The algorithm weighs these inputs and computes the likelihood of a trend continuation, or a reversal. The likelihood is computed based on statistical information such as occurrence frequency of certain patterns and their historical performance.
The algorithm then outputs a color scheme for the chart bars.
Analyzing the market with the TRN Trend Bar color scheme
Green Bars signify a bullish uptrend. On the other hand, Red Bars indicate a bearish downtrend. The transition from red to green denotes a bullish trend reversal. Conversely, the shift from green to red signals a bearish trend reversal. By monitoring these color changes, traders can identify potential trend reversals and make informed trading decisions.
The presence of gray and black bars indicates a neutral market state, often observed before an impending color change from red to green or green to red. These neutral bars serve as a transition phase between the previous trend and the potential reversal.
How to use TRN Trend Bars for trading?
The TRN Trend Bars are very sensitive. Therefore, they make it easy to find strong short-term trends and pullbacks of the main trend. This can result in high probability entry and exit signals. Here are some trading strategies examples:
Breakouts
After an up breakout of a consolidation or range (or any other chart pattern) you can enter the moment TRN Trend Bars turn green. Alternatively, you wait for a pullback with red bars and enter once a green bar occurs.
Pullbacks
In a trending market you use the TRN Trend Bars for pullback entries. For example, if we are in a strong downtrend and a few green bars occur, then you can enter short once a red bar is displayed.
Exit signals/Trade Management
If you are in a position, you can use the TRN Trend Bars to manage the trade or find good exit points. In case the bar color is not in favor of your position anymore, you can either adjust your stop loss or exit the position completely. E.g. you are in a long position and the bars turn red, then you can either close the trade or tighten your stop loss.
Conclusion
While signals from TRN Trend Bars can be informative, it is important to recognize that their reliability may vary. Various external factors can impact market prices, and it is essential to consider your risk tolerance and investment goals when executing trades.
Risk Disclaimer
The content, tools, scripts, articles, and educational resources offered by TRN Trading are intended solely for informational and educational purposes. Remember, past performance does not ensure future outcomes.

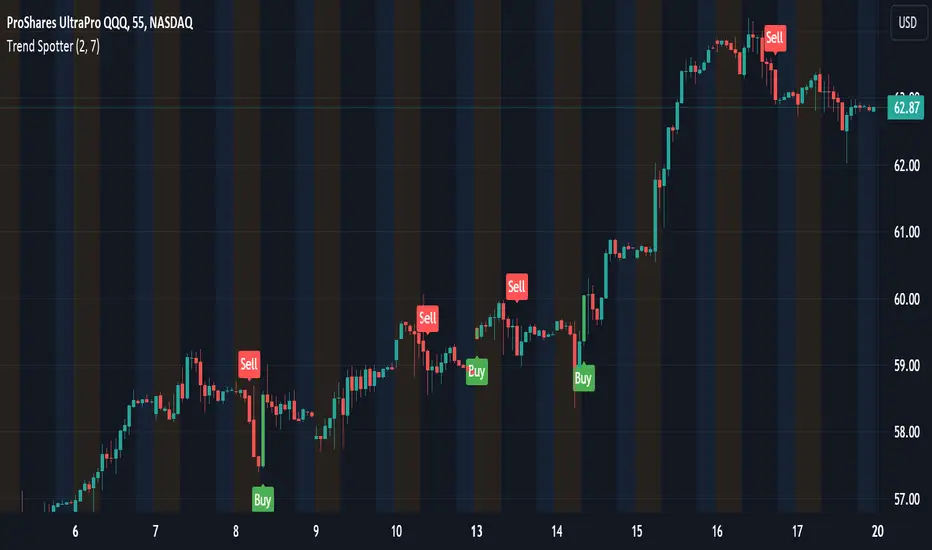
Trend Spotter v1Trend Spotter - Advanced Trend and Momentum Trading Strategy
Overview:
Trend Spotter is an advanced trading script designed to help traders identify high-probability buy and sell opportunities in the market. This closed-source script combines trend detection and momentum analysis to deliver reliable and actionable trading signals.
How It Works:
Trend Spotter integrates two powerful technical indicators: the Moving Average Convergence Divergence (MACD) and the Stochastic Relative Strength Index (StochRSI). These indicators are known for their effectiveness in identifying market trends and momentum shifts, respectively.
MACD Component: The MACD indicator is used to determine the strength and direction of a trend. By calculating the difference between a fast and a slow exponential moving average (EMA) of the asset’s price, the MACD helps to identify changes in the strength, direction, momentum, and duration of a trend. This script uses optimized settings for MACD to filter out market noise and focus on significant trends.
StochRSI Enhancement: The StochRSI is an oscillator that applies the Stochastic formula to the Relative Strength Index (RSI) values, making it a more sensitive indicator for detecting overbought and oversold conditions. StochRSI provides early signals of potential trend reversals, adding an extra layer of precision to the MACD signals.
Signal Generation Logic:
Trend Spotter generates buy and sell signals based on a combination of MACD crossovers and StochRSI levels:
Buy Signal: A buy signal is triggered when the MACD line crosses above the signal line, indicating a potential bullish trend, and the StochRSI confirms rising momentum.
Sell Signal: A sell signal occurs when the MACD line crosses below the signal line, indicating a potential bearish trend, and the StochRSI confirms falling momentum.
How to Use the Script:
Apply to Chart: Add Trend Spotter to any asset’s chart. It is best suited for time frames of 1-hour or higher.
Interpret Signals: Look for green arrows below the bars for buy signals and red arrows above the bars for sell signals.
Risk Management: Use stop-loss and take-profit levels to manage risk, ideally based on the asset’s volatility.
Unique Features:
Adaptive Settings: Trend Spotter adjusts its sensitivity based on historical volatility and market conditions, ensuring that the signals remain relevant across different market environments.
Visual and Audible Alerts: Traders receive clear visual signals on the chart and optional audible alerts when a buy or sell condition is met, ensuring that no trading opportunity is missed.
Conclusion:
Trend Spotter provides traders with a robust tool for trend and momentum analysis, combining the strengths of MACD and StochRSI to generate high-quality trading signals. This script is ideal for traders looking for a reliable method to identify entry and exit points in various market conditions.
Disclaimer:
While Trend Spotter has been backtested and optimized for performance, it is important to use it as part of a comprehensive trading strategy. Past performance is not indicative of future results, and traders should practice proper risk management when using this tool.
Trend Following Parabolic Buy Sell Strategy [TradeDots]The Trend Following Parabolic Buy-Sell Strategy leverages the Parabolic SAR in combination with moving average crossovers to deliver buy and sell signals within a trend-following framework.
This strategy synthesizes proven methodologies sourced from various trading tutorials available on platforms such as YouTube and blogs, enabling traders to conduct robust backtesting on their selected trading pairs to assess the strategy's effectiveness.
HOW IT WORKS
This strategy employs four key indicators to orchestrate its trading signals:
1. Trend Alignment: It first assesses the relationship between the price and the predominant trendline to determine the directional stance—taking long positions only when the price trends above the moving average, signaling an upward market trajectory.
2. Momentum Confirmation: Subsequent to trend alignment, the strategy looks for moving average crossovers as a confirmation that the price is gaining momentum in the direction of the intended trades.
3. Signal Finalization: Finally, buy or sell signals are validated using the Parabolic SAR indicator. A long order is validated when the closing price is above the Parabolic SAR dots, and similarly, conditions are reversed for short orders.
4. Risk Management: The strategy institutes a fixed stop-loss at the moving average trendline and a take-profit level determinable by a prefixed risk-reward ratio calculated from the moving average trendline. These parameters are customizable by the users within the strategy settings.
APPLICATION
Designed for assets exhibiting pronounced directional momentum, this strategy aims to capitalize on clear trend movements conducive to achieving set take-profit targets.
As a lagging strategy that waits for multiple confirmatory signals, entry into trades might occasionally lag beyond optimal timing.
Furthermore, in periods of consolidation or sideways movement, the strategy may generate several false signals, suggesting the potential need for additional market condition filters to enhance signal accuracy during volatile phases.
DEFAULT SETUP
Commission: 0.01%
Initial Capital: $10,000
Equity per Trade: 70%
Users are advised to adjust and personalize this trading strategy to better match their individual trading preferences and style.
RISK DISCLAIMER
Trading entails substantial risk, and most day traders incur losses. All content, tools, scripts, articles, and education provided by TradeDots serve purely informational and educational purposes. Past performances are not definitive predictors of future results.

IsAlgo - AI Trend Strategy► Overview:
The AI Trend Strategy employs a combination of technical indicators to guide trading decisions across various markets and timeframes. It uses a custom Super Trend indicator and an Exponential Moving Average (EMA) to analyze market trends and executes trades based on specific candlestick patterns. This strategy includes options for setting stop losses, take profit levels, and features an alert system for trade notifications.
► Description:
This strategy focuses on identifying the optimal "entry candle," which signals either a potential correction within the ongoing trend or the emergence of a new trend. The entry criteria for this candle are highly customizable, allowing traders to specify dimensions such as the candle's minimum and maximum size and body ratio. Additional settings include whether this candle should be the highest or lowest compared to recent candles and if a confirmation candle is necessary to validate the entry.
The Super Trend indicator is central to the strategy’s operation, dictating the direction of trades by identifying bullish or bearish trends. Traders have the option to configure trades to align with the direction of the trend identified by this indicator, or alternatively, to take positions counter to the trend for potential reversal strategies. This flexibility can be crucial during varying market conditions.
Additionally, the strategy incorporates an EMA alongside the Super Trend indicator to further analyze trend directions. This combined approach aims to reduce the occurrence of false signals and improve the strategy's overall trend analysis.
The learning algorithm is a standout feature of the AI Trend Strategy. After accumulating data from a predefined number of trades (e.g., after the first 100 trades), the algorithm begins to analyze past performances to identify patterns in wins and losses. It considers variables such as the distance from the current price to the trend line, the range between the highest and lowest prices during the trend, and the duration of the trend. This data informs the algorithm's predictions for future trades, aiming to improve accuracy and reduce losses by adapting to the evolving market conditions.
► Examples of Trade Execution:
1. In an Uptrend: The strategy might detect a suitable entry candle during a correction phase, which aligns with the continuing uptrend for a potential long trade.
2. In a Downtrend: Alternatively, the strategy might identify an entry candle at the end of a downtrend, suggesting a potential reversal or correction where a long trade could be initiated.
3. In an Uptrend: The strategy may also spot an entry candle at the end of an uptrend and execute a short trade, anticipating a reversal or significant pullback.
4. In a Downtrend: The strategy might find a suitable entry candle during a correction phase, indicating a continuation of the downtrend for a potential short trade.
These examples illustrate how the strategy identifies potential trading opportunities based on trend behavior and candlestick patterns.
► Features and Settings:
⚙︎ Trend: Utilizes a custom Super Trend indicator to identify the direction of the market trend. Users can configure the strategy to execute trades in alignment with this trend, take positions contrary to the trend, or completely ignore the trend information for their trading decisions.
⚙︎ Moving average: Employs an Exponential Moving Average (EMA) to further confirm the trend direction indicated by the Super Trend indicator. This setting can be used in conjunction with the Super Trend or disabled if preferred.
⚙︎ Entry candle: Defines the criteria for the candle that triggers a trade. Users can customize aspects such as the candle's size, body, and its relative position to previous candles to ensure it meets specific trading requirements before initiating a trade.
⚙︎ Learning algorithm: This component uses historical trade data to refine the strategy. It assesses various aspects of past trades, such as price trends and market conditions, to make more informed trading decisions in the future.
⚙︎ Trading session: Users can define specific trading hours during which the strategy should operate, allowing trades to be executed only during preferred market periods.
⚙︎ Trading days: This option enables users to specify which days the strategy should be active, providing the flexibility to avoid trading on certain days of the week if desired.
⚙︎ Backtesting: Enables a period during which the strategy can be tested over a selected start and end date, with an option to deactivate this feature if not needed.
⚙︎ Trades: Detailed configuration options include the direction of trades (long, short, or both), position sizing (fixed or percentage-based), the maximum number of open trades, and limitations on the number of trades per day or based on trend changes.
⚙︎ Trades Exit: Offers various strategies for exiting trades, such as setting limits on profits or losses, specifying the duration a trade should remain open, or closing trades based on trend reversal signals.
⚙︎ Stop loss: Various methods for setting stop losses are available, including fixed pips, based on Average True Range (ATR), or utilizing the highest or lowest price points within a designated number of previous candles. Another option allows for closing the trade after a specific number of candles moving in the opposite direction.
⚙︎ Break even: This feature adjusts the stop loss to a break-even point under certain conditions, such as reaching predefined profit levels, to protect gains.
⚙︎ Trailing stop: The trailing stop feature adjusts the stop loss as the trade moves into profit, aiming to secure gains while potentially capturing further upside.
⚙︎ Take profit: Up to three take profit levels can be established using various methods, such as a fixed amount of pips, risk-to-reward ratios based on the stop loss, ATR, or after a set number of candles that move in the direction of the trade.
⚙︎ Alerts: Includes a comprehensive alert system that informs the user of all significant actions taken by the strategy, such as trade openings and closings. It supports placeholders for dynamic values like take profit levels, stop loss prices, and more.
⚙︎ Dashboard: Provides a visual display of detailed information about ongoing and past trades on the chart, helping users monitor the strategy’s performance and make informed decisions.
► Backtesting Details:
Timeframe: 15-minute BTCUSD chart.
Initial Balance: $10,000.
Order Size: 4% of equity per trade.
Commission: 0.01%.
Slippage: 5 ticks.
Risk Management: Strategic stop loss settings are applied based on the most extreme price points within the last 18 candles.

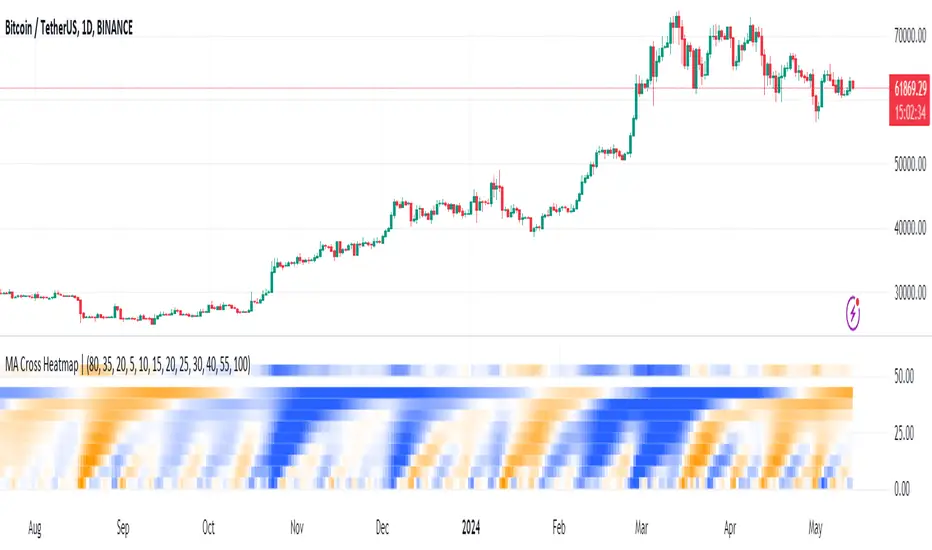
MA Cross HeatmapThe Moving Average Cross Heatmap Created by Technicator , visualizes the crossing distances between multiple moving averages using a heat map style color coding.
The main purpose of this visualization is to help identify potential trend changes or trading opportunities by looking at where the moving averages cross over each other.
Key Features:
Can plot up to 9 different moving average with their cross lengths you set
Uses a heat map to show crossing distances between the MAs
Adjustable settings like crossing length percentage, color scheme, color ceiling etc.
Overlay style separates the heat map from the price chart
This is a unique way to combine multiple MA analysis with a visual heat map representation on one indicator. The code allows you to fine-tune the parameters to suit your trading style and preferences. Worth checking out if you trade using multiple moving average crossovers as part of your strategy.
Multi Timeframe Trend Screener [TradeDots]The "Multi Timeframe Trend Screener" is a trading indicator designed to assist traders in identifying the market trends of multiple assets within a single panel. This tool is invaluable for detecting shifts in trends, enabling traders to easily adjust their strategies under different market conditions.
HOW DOES IT WORK
Upon initialization, the indicator requires users to input two key pieces of information:
The assets to be monitored.
The timeframes to be analyzed.
The tool is capable of simultaneously tracking up to four assets across five distinct timeframes.
By specifying the type and length of the moving average, the indicator uses this data as a baseline to determine the current market trend.
A price movement below the moving average triggers a downward trend symbol (📉), indicating bearish conditions.
Conversely, a movement above the moving average displays an upward trend symbol (📈), signaling bullish conditions.
The aggregation of moving averages across various timeframes provides a comprehensive view of the overall market sentiment.
APPLICATION
In scenarios where the market consistently demonstrates an upward trend, each timeframe will display a bullish symbol. Shifts in market sentiment typically start in the shorter timeframes and can progressively affect longer ones if the trend continues.
This cascading effect allows the indicator to show all timeframes transitioning to a bearish orientation when the trend reverses.
The indicator also facilitates comparison between different assets. For assets with high correlation, a trend shift in one can often predict similar movements in correlated assets, thus allowing traders to swiftly adapt their strategies to align with new market conditions.
RISK DISCLAIMER
Trading entails substantial risk, and most day traders incur losses. All content, tools, scripts, articles, and education provided by TradeDots serve purely informational and educational purposes. Past performances are not definitive predictors of future results.

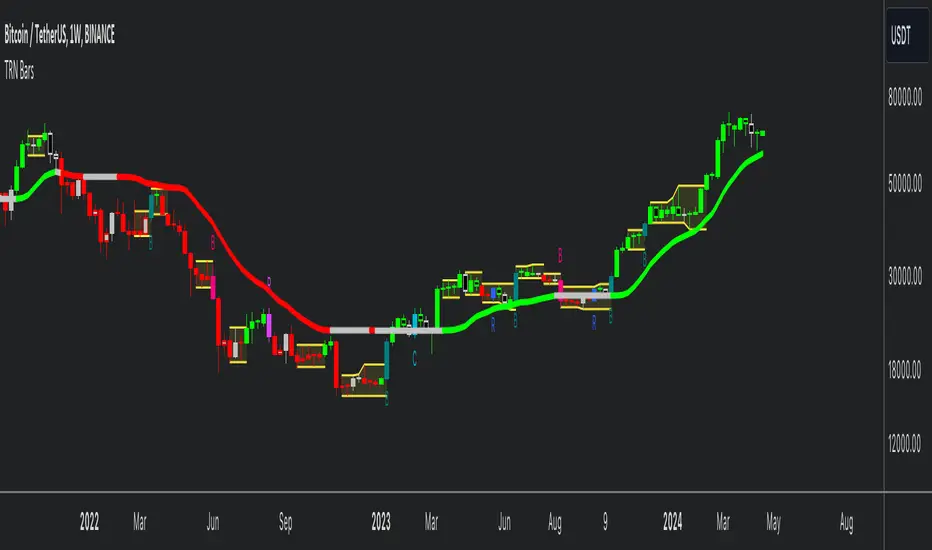
TRN BarsThe innovative TRN Bars are designed to help traders to analyze markets in an intuitive way. It combines three core concepts:
TRN Bars to see the current trend and reversals (replaces the default chart bars)
Bar Ranges to highlight consolidations
Dynamic Trend to see the overall trend.
First, let's have a look at each of these concepts individually. Afterwards, we describe how a combination of all three gives you a crystal-clear picture of the market.
TRN Bars
They show bullish and bearish trends and reversals based on color coding the bars and give high probability trade opportunities with special colors. The trend analysis is based on a new algorithm that includes several different inputs:
classical and advanced bar patterns and their statistical frequency
probability distributions of price expansions after certain bar patterns
bar information such as wick length in %, overlapping of the previous bar in % and many more
historical trend and consolidation analysis
The algorithm weighs these concepts and outputs a color scheme for the chart bars or candlesticks.
Bar Types
Trend bars in green and red
Reversal Bars in blue and fuchsia
Continuation Bars in turquoise and orange
Breakout Bars in dark green and pink
Green Bars signify a sustained uptrend, indicating bullish market sentiment. On the other hand, Red Bars indicate a persistent downtrend, representing bearish market sentiment. The transition from red to green denotes a bullish trend reversal, suggesting a shift from bearish to bullish sentiment. Conversely, the shift from green to red signals a bearish trend reversal, indicating a transition from bullish to bearish sentiment. By monitoring these color changes, traders can identify potential trend reversals and make informed trading decisions.
The presence of gray and black bars indicates a neutral market state, often observed before an impending color change from red to green or green to red. These neutral bars serve as a transition phase between the previous trend and the potential reversal.
The TRN Bars incorporate Signal Bars, distinguished by their distinct colors, to offer potential buy and sell signals and deeper insights into market dynamics.
Reversal Bars
The presence of blue Reversal Bars indicates a trend reversal to the upside, while pink Reversal Bars indicate a reversal to the downside. These bars not only serve as signals for potential trend shifts but also present favorable opportunities to enter the market or increase one's position size.
Continuation Bars
In addition to the reversal bars, TRN Bars also include bullish continuation bars (colored turquoise) and bearish continuation bars (colored orange). These bars act as signals for the continuation of an existing trend. Like the reversal bars, they can be utilized as entry points or opportunities to augment one's position size.
Breakout Bars
The dark green breakout bars within TRN Bars show a powerful breakout from a price range detected by our integrated bar range feature. They signify the continuation or potential change in a trend following a consolidation phase. As such, these bars hold dual functionality, serving as reversal signals and validating the persistence of an ongoing trend.
Bar Ranges
The bar range feature automatically finds consolidations where the price range of several consecutives bars is rather small. The detection of the bar ranges includes among other things the overlapping percentage of these bars.
How to Use Price Ranges
Here are a few ways you can use the bar ranges in your trading:
Identify Support and Resistance Levels
The price ranges can help you identify key support and resistance levels on a chart. By observing price ranges and identifying these levels, you can make more informed decisions about entering or exiting trades.
Breakout Trading
Price ranges can also provide insights into potential breakout opportunities. Breakouts occur when the price breaks out of a defined range, signaling a potential shift in market sentiment and the start of a new trend. The Color highlighted Breakout Bars from the TRN Bars are signaling a powerful breakout of a price range. Traders can enter positions in the direction of the breakout and set appropriate stop-loss orders to manage risk. Note that not every price range is left by a powerful breakout.
Dynamic Trend
The Dynamic Trend combines elements from standard trend strength indicators (e.g. DI-, DI+, Parabolic SAR) and volatility indicators (e.g. ATR, Standard Deviation). It produces a moving average line that adapts to changing market volatility. It is inspired by the ideas of the programmer and trader Fat Tails. The adaptive behavior provides more relevant information for traders when compared to traditional moving averages which do not consider volatility and trend strength together. This makes the Dynamic Trend completely unique, and no other moving average indicator can give you this precision.
How to use Dynamic Trend
Generally, a rising Dynamic Trend line, displayed in green, indicates that an uptrend is strong, while a falling Dynamic Trend, displayed in red, suggests that the downtrend is sharp. The Dynamic Trend turns gray when there is insufficient clarity to establish a distinct trend and especially when there is not volatility in the market.
Identify potential trade entries and exits: When used in conjunction with price action, the Dynamic Trend can provide potential trade signals. For example, if the price crosses above the Dynamic Trend, it may be a bullish sign, suggesting a potential buy entry. Conversely, if the price crosses below the Dynamic Trend, it may indicate bearish conditions and a potential sell signal.
Trend Identification and Pullback trading
Observe the Dynamic Trend's color. When it's on the rise and appears green, it indicates a bullish trend. Conversely, if it's in decline and displayed in red, it signals a bearish trend.
If Dynamic Trend is green and price pulls from above back to the Dynamic Trend, then this can be considered as a bullish signal.
If Dynamic Trend is red and price pulls from below back to the Dynamic Trend, then this can be considered as a bearish signal.
In the event of a bearish signal, such as a bearish TRN Signal Bar, and the Dynamic Trend is red, it provides additional confirmation to the bearish signal. Likewise, bullish signals gain added conviction when the Dynamic Trend is green.
Crossovers
As with other moving averages, crossovers between the Dynamic Trend and the price can be significant.
If price is crossing above the Dynamic Trend, then this can be considered as a bullish signal.
If price is crossing below the Dynamic Trend, then this can be considered as a bearish signal.
If you currently hold a position, both bullish and bearish crossovers can serve as potential exit signals. For instance, in the case of a long position, a bearish crossover can indicate a potential shift in sentiment, signaling a bearish reversal and a potential opportunity to close your long position.
Filtering Noise
Due to its adaptive nature, the Dynamic Trend can be a useful tool to filter out market noise. When the market is choppy or consolidating, the Dynamic Trend tends to remain flat and colored gray, signaling traders to potentially stay out of the market.
Stop Losses
The Dynamic Trend can also be used as a dynamic stop loss. For instance, in a long trade, traders can use the Dynamic Trend as a trailing stop, selling their position if the price crosses below the Dynamic Trend.
Combining TRN Bars, Bar Ranges and Dynamic Trend together
Combining all three concepts gives you a crystal-clear picture of the market. The Dynamic Trend shows you the overall trend. If price pulls back to the dynamic trend line and then price picks up the trend direction again, then the TRN Bars immediately switch the color to the trend direction. Therefore, you can easily identify high probability entry signals based on the bar color.
As a simple trading model, you can set the stop loss below the last swing or below a TRN signal bar (vice versa for short entries) and use 2.5 R or 3 R as target.
You can increase the success rate of the high probability TRN signal bars entries even more if they are in line with the Dynamic Trend line.
On the other hand, the TRN Bar Ranges help you to stay out of the market in case the price does not really change. As a confluence signal to stay flat in this period the dynamic trend line tends to be grey as well. If the price breaks out of the range, then the TRN Bars print a breakout bar which serves as a high probability entry signal.
Although it is possible to switch off any of these concepts, it is highly recommended to use all three in combination to get a crystal-clear picture of the market.
Alerts
Experience the power of our TRN Bars Alerts, delivering real-time notifications for trend changes, price range breakouts, and signal bar formations or confirmations. Stay on top of the market with these versatile alerts, customizable to your preferred assets and timeframes.
Conclusion
While signals from TRN Bars can be informative, it is important to recognize that their reliability may vary. Various external factors can impact market prices, and it is essential to consider your risk tolerance and investment goals when executing trades.
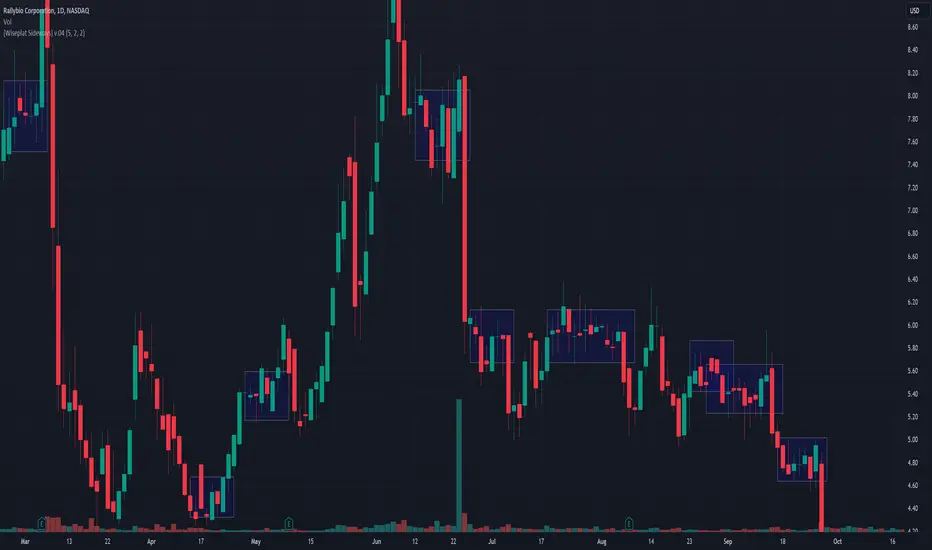
[Wiseplat Sideways] v.04The Sideway indicator for TradingView is a powerful tool designed to identify periods of sideways or ranging price action in the market. With its intuitive interface and customizable parameters, traders can easily spot when an asset is consolidating, providing valuable insights for both trend-following and range-bound strategies.
This indicator utilizes really simple algorithm to analyze price movement and volatility, effectively filtering out noise and false signals. By plotting clear visual cues on the chart.
Traders can adjust the sensitivity parameters to tailor the indicator to their specific trading style and preferences. Whether used in isolation or in conjunction with other technical analysis tools, the Sideway indicator empowers traders to make informed decisions in dynamic market conditions.
Its user-friendly design and simple settings of parameters makes it accessible to traders of all levels, from beginners seeking clarity in choppy markets to seasoned professionals looking for confirmation of their analysis. With the Sideway indicator, traders can confidently navigate sideways price action and stay ahead of the curve in their trading endeavors.
Developer: Oleg Shpagin
ZigZag Library [TradingFinder]🔵 Introduction
The "Zig Zag" indicator is an analytical tool that emerges from pricing changes. Essentially, it connects consecutive high and low points in an oscillatory manner. This method helps decipher price changes and can also be useful in identifying traditional patterns.
By sifting through partial price changes, "Zig Zag" can effectively pinpoint price fluctuations within defined time intervals.
🔵 Key Features
1. Drawing the Zig Zag based on Pivot points :
The algorithm is based on pivots that operate consecutively and alternately (switch between high and low swing). In this way, zigzag lines are connected from a swing high to a swing low and from a swing low to a swing high.
Also, with a very low probability, it is possible to have both low pivots and high pivots in one candle. In these cases, the algorithm tries to make the best decision to make the most suitable choice.
You can control what period these decisions are based on through the "PiPe" parameter.
2.Naming and labeling each pivot based on its position as "Higher High" (HH), "Lower Low" (LL), "Higher Low" (HL), and "Lower High" (LH).
Additionally, classic patterns such as HH, LH, LL, and HL can be recognized. All traders analyzing financial markets using classic patterns and Elliot Waves can benefit from the "zigzag" indicator to facilitate their analysis.
" HH ": When the price is higher than the previous peak (Higher High).
" HL ": When the price is higher than the previous low (Higher Low).
" LH ": When the price is lower than the previous peak (Lower High).
" LL ": When the price is lower than the previous low (Lower Low).
🔵 How to Use
First, you can add the library to your code as shown in the example below.
import TFlab/ZigZagLibrary_TradingFinder/1 as ZZ
Function "ZigZag" Parameters :
🟣 Logical Parameters
1. HIGH : You should place the "high" value here. High is a float variable.
2. LOW : You should place the "low" value here. Low is a float variable.
3. BAR_INDEX : You should place the "bar_index" value here. Bar_index is an integer variable.
4. PiPe : The desired pivot period for plotting Zig Zag is placed in this parameter. For example, if you intend to draw a Zig Zag with a Swing Period of 5, you should input 5.
PiPe is an integer variable.
Important :
Apart from the "PiPe" indicator, which is part of the customization capabilities of this indicator, you can create a multi-time frame mode for the indicator using 3 parameters "High", "Low" and "BAR_INDEX". In this way, instead of the data of the current time frame, use the data of other time frames.
Note that it is better to use the current time frame data, because using the multi-time frame mode is associated with challenges that may cause bugs in your code.
🟣 Setting Parameters
5. SHOW_LINE : It's a boolean variable. When true, the Zig Zag line is displayed, and when false, the Zig Zag line display is disabled.
6. STYLE_LINE : In this variable, you can determine the style of the Zig Zag line. You can input one of the 3 options: line.style_solid, line.style_dotted, line.style_dashed. STYLE_LINE is a constant string variable.
7. COLOR_LINE : This variable takes the input of the line color.
8. WIDTH_LINE : The input for this variable is a number from 1 to 3, which is used to adjust the thickness of the line that draws the Zig Zag. WIDTH_LINE is an integer variable.
9. SHOW_LABEL : It's a boolean variable. When true, labels are displayed, and when false, label display is disabled.
10. COLOR_LABEL : The color of the labels is set in this variable.
11. SIZE_LABEL : The size of the labels is set in this variable. You should input one of the following options: size.auto, size.tiny, size.small, size.normal, size.large, size.huge.
12. Show_Support : It's a boolean variable that, when true, plots the last support line, and when false, disables its plotting.
13. Show_Resistance : It's a boolean variable that, when true, plots the last resistance line, and when false, disables its plotting.
Suggestion :
You can use the following code snippet to import Zig Zag into your code for time efficiency.
//import Library
import TFlab/ZigZagLibrary_TradingFinder/1 as ZZ
// Input and Setting
// Zig Zag Line
ShZ = input.bool(true , 'Show Zig Zag Line', group = 'Zig Zag') //Show Zig Zag
PPZ = input.int(5 ,'Pivot Period Zig Zag Line' , group = 'Zig Zag') //Pivot Period Zig Zag
ZLS = input.string(line.style_dashed , 'Zig Zag Line Style' , options = , group = 'Zig Zag' )
//Zig Zag Line Style
ZLC = input.color(color.rgb(0, 0, 0) , 'Zig Zag Line Color' , group = 'Zig Zag') //Zig Zag Line Color
ZLW = input.int(1 , 'Zig Zag Line Width' , group = 'Zig Zag')//Zig Zag Line Width
// Label
ShL = input.bool(true , 'Label', group = 'Label') //Show Label
LC = input.color(color.rgb(0, 0, 0) , 'Label Color' , group = 'Label')//Label Color
LS = input.string(size.tiny , 'Label size' , options = , group = 'Label' )//Label size
Show_Support= input.bool(false, 'Show Last Support',
tooltip = 'Last Support' , group = 'Support and Resistance')
Show_Resistance = input.bool(false, 'Show Last Resistance',
tooltip = 'Last Resistance' , group = 'Support and Resistance')
//Call Function
ZZ.ZigZag(high ,low ,bar_index ,PPZ , ShZ ,ZLS , ZLC, ZLW ,ShL , LC , LS , Show_Support , Show_Resistance )

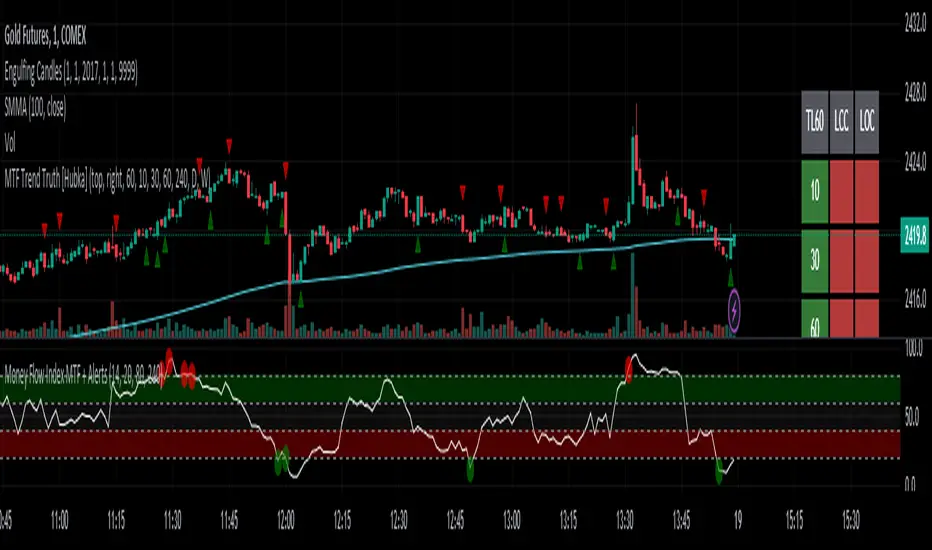
MTF Trend Truth [Hubka]A Multi Time Frame Tend table that displays symbols trends for 6 selectable Time Intervals. In addition to the 6 first row color trends, the table also displays the direction of the last 2 candles in each Time Interval in the last 2 rows. This extra interval information displays price trend direction change or may add confluence if the price direction is the same.
The top row of the table has column header names described below:
(TL30) Column 1 - Trend Interval + The Trend Length selected (30 is default). Uses the last 30 candles to determine the trend for this interval. The length number is Editable.
(LCC) Column 2 - Last Closed Candle. This is the direction color of the second last candle on the chart.
(LOC) Column 3 - Last Open Candle. The is the current candle color direction of the last candle on the chart. This candle has not yet closed and will flicker as price changing state.
NOTE 1: (LOC) Column 3 - Last Open Candle - only displays correctly when the market is open and price is changing.
You can adjust the "Trend Length in Candles" which defaults to using the trend of the last 30 candles (TL30). Edit this setting to use any number from 5 to 99 candles back if you want display different trend lengths.
Having a visual table of the price trends from different time intervals can be beneficial to traders. For example... When observing that a symbol has many Bullish (green) price trends on several time intervals and the last 2 candles are also bullish it should afford a trader confluence to trade in that same bullish direction. However I am not a professional and do not offer any trading advice in any way. Use this indicator at your own risk.
NOTE 2: Time interval of 240 = 4 hours. Below 1 day number only is minutes.
Trend Channels (MTF) | Flux Charts💎 GENERAL OVERVIEW
Introducing our new Trend Channels (MTF) indicator! Latest trends play an important role for traders and sometimes it can be hard to spot trends in other timeframes. This indicator can plot latest trend channels across different timeframes, so you can spot trends and their channels easier. More info about the process in the "How Does It Work" section.
Features of the new Trend Channels (MTF) indicator :
Plot Trend Channels Across Up To 3 Different Timeframes
Broad Customizability Of Trend Detection
Variety Of Trend Invalidation Options
High Visual Customizability
🚩UNIQUENESS
While the detection of trend channels is a common concept among traders, trend channels across different timeframes can be as crucial as the ones in the current timeframe. This indicator can find them from up to 3 different timeframes. While the general settings will perform well enough most of the time, the indicator also provides fine-tuning options for trend detection and trend invalidation for more experienced traders.
📌 HOW DOES IT WORK ?
Trend channels occur when the price of an asset starts making a strong movement in a bullish or a bearish direction. This indicator detects trend channels using the Simple Moving Average (SMA). When the slope of the SMA line exceeds the user-defined size, a trend channel will occur.
To understand how individual settings work, you can check the "⚙️SETTINGS" section.
⚙️SETTINGS
1. General Configuration
SMA Length -> Determines the length used in the SMA function. Higher values mean that an average of a longer timespan will be taken into account when spotting trends.
Slope Length -> Used while finding the slope of the trend channel. Check this example for slope length :
ATR Size -> This setting is taken into calculation while checking if a trend channel is worth plotting. The higher this setting is, the higher the slope of the trend channel must be to get rendered. You can take a look at the chart provided above for a visual explanation.
Channel Expander -> When a trend channel occurs, the top and the bottom of the channel are initally determined by the latest highest highs / lowest lows. This setting expands the channel vertically by X times Average True Range (ATR). Check this example :
Trend Invalidation -> The trend channel gets invalidated when the bar closes / wicks above the top of the channel, or below the bottom of the channel. With this setting, you can switch the behaviour between bar close / bar wick.
Avoid False Invalidation -> This setting makes it harder for trend channels to get invalidated to prevent false invalidations.
Retries : The trend channel will have 5 chances for invalidation. First 4 invalidations will not invalidate the channel. The trend channel will only invalidate once the 5th invalidation occur.
Volume : The bar that invalidates the trend channel must have a volume higher than 1.5x the average bar volume of the current chart. Otherwise the trend channel will not be invalidated.
None : The trend channel will invalidate at the first invalidation.

Advanced Engulfing CandlesThere are a plenty of Engulfing candle detecting indicators but every single of them detect engulfing candles engulfed by only single candle but sometime it take more then one candle to engulf the previous opposite candle, which is also considered as engulfing candle.
So this script show both type of candles.
Type of Engulfing Candles
Normal Engulfing Candles
Candle engulfed by more then one continuous candle
I hope you will like it.
If you find any bugs or have any suggestions for any possible addition feel free to comment or DM me.

BTC Halving [YinYangAlgorithms]This Indicator not only estimates what it thinks may be the PRICE for the Start, High and Low of the Halving, but likewise estimates WHEN the Start, High and Low of Halving may be. It then creates Trend Lines based on these predictions so that you may get an evaluation towards if the Price is currently Overbought or Oversold. These Trend Lines may be very useful for seeing the Slope in which the Price may move if it is to reach the estimated Price by the estimated Date. By evaluating the Prices location based on these Trend Lines we may determine if the Price is currently Overbought or Oversold.
These Trend Lines likewise may help identify locations of Support and Resistance. If the Price is much higher than its current Trend Line it is Overbought. There is a chance it will Consolidate back to the Trend Line or it may even correct with a dump all the way back to it; the opposite is true if it is much lower than its current Trend Line.
Trend Lines and Estimates are not all that is featured within this Indicator however. There are also Price Zones which may help identify if the price is currently:
Very Overbought (Red)
Slightly Overbought (Orange)
Neutral (Yellow)
Slightly Oversold (Teal)
Very Oversold (Green)
These zones may help give you an idea of how the price is currently fairing and its potential for movement. Likewise, it may help define where Support and Resistance may be found.
The trend line estimates are done with an algorithm created to evaluate the difference between price and % change that has occurred between the Start, High and Low of all the halvings over how many days between each data type. This may allow us to make an educated estimate towards what Price and Date the Start, High and Low will occur at.
Our Zones are created by evaluating the current Market Cap and circulating supply vs Max Supply of BTC. This may help give us an evaluation of what Price may be considered to be Overbought and Oversold; and likewise may help with estimations of where there may be Support and Resistance based on these Zones.
Tutorial:
In the example above we’re displaying the Halving Start Trend Line, our Information Tables and our Estimated Halving Vertical Marker. This Trend Line may help to display not only the trajectory and slope the Price needs to take to reach the Estimated Halving Price by the Estimated Halving Date; but it may also help to show if the price is Overvalued or Undervalued based on its position above or below this Trend Line.
Based on the Trajectory of the Estimated High Upward Trend Line (Green Line) in the photo above and from the ‘High Date’ estimated in the Information tables; we may attempt to estimate the location the ATH of this Bull Market will create and the price slope it may follow in doing so. This Trajectory may be very useful for understanding the price action that may occur for it to reach the High estimated Price by the High estimated Date.
We currently allow for two different types of zones within our Settings, one called ‘Fast’ displayed in the example above; and the other called ‘Slow’ displayed in the example below.
Our Fast Zone aims to move the Zone Levels Faster in an attempt to move with volatility and parabolic movement. This may help to keep the Very Overbought (Red) and Very OverSold (Green) Levels more accurate by attempting to keep the price within them. By doing so, we may aim to keep all of the Slightly Overbought, Slightly Oversold and Neutral Levels more accurate as well.
The Levels within these zones are defined by the Bright (less transparent) Lines. Whereas the Darker (more transparent) lines represent the Basis Lines between two different levels. These Basis lines may likewise act as a Support and Resistance Location too, but generally hold less weight than the actual Levels themselves.
What you may see is that during the Bull Market, the price is within the very Overbought Zones and even touches again the Very Overbought Level a few times. Likewise, during the Bear Market, the price is within the very Oversold Zones and even slightly drops below the Very Oversold Level. This may be expected and likewise may help to give estimates at potential for growth and decay within the Price based on which condition the Market is within.
Slow Zones move a little slower than Fast Zones, however they may still be accurate. Likewise, it is up to you to decide which Zone works better for your specific Trading Style; however, by default, the Zone type is set to Fast.
If you refer to both the Fast and Slow examples above, you may notice in the Fast the Price is only slightly above the ‘Slightly Oversold’ (Teal) line. Also, In the Fast, the Price where the ‘Very Overbought’ Level is 100k. This is one of the many reasons we’ve opted for ‘Fast’ as the default, and it is because it allows more room for movement; and in our opinion, potentially accuracy as well.
If you refer to the Slow example, you’ll see that the price is currently facing the Neutral Level as a Resistance location. However, if you refer to the price residing at the Slows ‘Very Overbought’ Level, it is only 81.5k, compared to the 100k of Fast.
The BTC Halving is a major event that takes place roughly every 4 years. It historically has a major impact on the market, and some may even say it signifies the Start, or close to start of the Bull Market. Therefore, since historically there may be cycles that BTC and potentially crypto itself follows, we’ve developed this Indicator in hopes that it may solve one of the biggest questions traders face. What Date will the Start, High and Low of the Halving occur and also at what Price.
Hopefully this Tutorial has given you some guidance as to how this Indicator may be used to help identify some of these key levels; including the slope at which the price may have to move if it is to reach its projection Price by its projected Date.
Settings:
1. Show Prediction Trend Lines:
- Options:
All
Start + High
Start + Low
High + Low
Start
High
Low
None
- Description:
Prediction Trend Lines may be an important way to see the Slope the Price needs to take to reach the Predicted Price by the Predicted Date. This may be useful for identifying if the Price is currently Overbought or Oversold.
2. Zone Type:
- Options:
Fast
Slow
- Description:
Zone types change the way the Zones expand.
3. Show Zones:
- Options:
All
Zones
Basis
None
- Description:
Zones are a way of seeing Overbought and Oversold Price locations based on Market Cap and Circulating Supply vs Max Supply.
4. Vertical Markers:
- Options:
All
Line
Label
None
- Description:
Vertical Markers display where the Halving has occurred with a Vertical Line and Label.
5. Show Tables:
Tables may be useful for seeing the Price and Date for when the Start, High and Low of the Halving may occur.
6. Fill Zones:
Filling in Zones may help to identify which Zone the Price is currently in.
If you have any questions, comments, ideas or concerns please don't hesitate to contact us.
HAPPY TRADING!
