High-Low IndexHello All,
High-Low Index is a breadth indicator based on Record High Percent (RHP). RHP is based on new 52-week highs and new 52-week lows. RHP => 100 * (new highs) / (new highs + new lows). High-Low Index is a 10-day Simple Moving Average of the RHP, which makes it a smoothed version of RHP. You can find many articles about High-Low Index on the net.
High-Low Index above 50 indicates that there are more new highs than new lows, and considered as Bullish.
High-Low Index below 50 indicates that there are more new lows than new highs, and considered as Bearish.
High-Low Index = 0 indicates there is no new highs (0% new highs).
High-Low Index = 100 indicates that there is at least 1 new high and no new lows.
and High-Low Index = 50 indicates that new highs and new lows is equal.
by default 40 cryptos are used in the script and shows High-Low Index for these cryptos. but you can change them as you wish. for example you can set all of them as stocks and see High-Low Index for these stocks.
You can set " Time frame " and the " Length " using the options. For example; if you set " Time frame " = 1 Week and the " Length " = 52 then it finds High-Low Index for 52weeks .
or another example; if you set " Time frame " = 1 Day and the " Length " = 22 the High-Low Indexn it finds High-Low Index for 22days.
You can enable/disable Record High Percent or Simple Moving Average of High-Low Index. Some traders use High-Low Index with its SMA, for example; High-Low Index generates a buy signal when it crosses above its moving average, and a sell signal when it crosses below its moving average.
Optionally you can see the securities in a table on the left bottom, you can change table size by usşng the options.
In the Table, for each security/cell;
=> if background is green then it has New High
=> if background is red then it has New Low
=> if background is gray then no New High, no New Low
=> if background is back then Data is not available for the security
As you can see in the screenshot below, the securities were changed and stocks are used instead of cryptos, so it calculates & shows High-Low Index for these stocks.
you can also find explanation in this screenshot:
Enjoy!
Trendtrading

Classic Long Term Trend Following SystemThis is a classic long term trend following system.
The breakout period is 50 days instead of 20 and the moving average crossover are 40 and 120.
The moving averages are also exponential instead of simple.
The stoploss is 4 ATRs away from the price.
Recommendations:
Donchian Channels settings > 50 days
Moving Averages > 40 and 120, 80 and 140
Important to note:
My first strategy, DC Breakout System | This is simplicity at its finest, is best used on the crypto market and this one for stocks, commodities, currencies, etc. Those markets tend to trend a lot longer than crypto do.

Trend Following with Bollinger BandsThis is a trend following system which uses the Bollinger Bands instead of the Donchian Channels.
Long position:
* Price closes above the middle line.
* The fast EMA (in this case the 40) crosses over or is above the slow one (in this case the 120)
Short position:
* Price closes below the middle line.
* The fast EMA crosses under or is below the slow one.
Stoploss:
* 4 ATRs away from the price.

Trendalix EntriesThis script is made to simplify the analysis of trends. It changes the mas based on whether you're looking at stocks or crypto. As these 2 markets currently move differently, they need a slightly different approach.
Crypto trends:
Can move much faster than stocks. Ideally the price should be bouncing above the williams alligators (about the 20-30 MAs).
Stocks:
These swing more than crypto so you need to get deep into these swing to be buying at the bottom of a move. The MAs are much larger, between the 50ma and 400ma. It's much more important here that the slower MAs are strong, i.e 200ma is above the 400ma, than it is that the faster MAs are okay.
For stocks an entry and stop line is drawn. These are only visible when the market is sufficiently in a pullback.

Support Resistance InteractiveHello All,
Using this "Support Resistance Interactive" script you can set the Support/Resistance levels interactively by clicking on the chart. Using the SR levels you set, the indicator creates Support Resistance zones. The width of the zones are calculated by using Threshold option and Threshold is the percent of the distance between Highest/Lowest levels in last 300 bars. if you set Threshold = 1 then it means 1% of the distance between Highest/Lowest levels. You can change SR levels by moving the level up/down by using your mouse anytime you want.
Now lets see it step by step;
After you added the indicator it will ask 5 Support/Resistance Levels and when you click any point then it's kept as S/R level and it asks another SR levels. if you want to use only 3 SR levels then last 2 SR levels are not important and you can click anywhere on the chart;
After you set all SR levels, it will ask "Number of Support/Resistance" . if you want to activate first 3 SR lines then set it 3. by default it's 5. when you set it click "Apply" and see the SR zones. that's it.
You can enable/disable alerts and set frequency, then create alerts. as it's interactive tool, the SR levels you set are specific for the current/active symbol. if you open another symbol then you better delete the indicator and add it again
Three Alerts exist in the script: Support Broken, Resistance Broken and Price in SR zone . you can enable/disable the alerts as you wish and you can set frequency for each one as "Once Per Bar" or "Once Per Bar Close"
by default Green/Red/Gray colors are used but You can change the colors using the options. according to the Price moves, SR zone colors are changed automatically.
when we have "Reset" feature to run the script interactively (like we added it for first time) I can update the script, then you will not need to delete/re-add each time you changed the symbol :)
In this example "Threshold" is 2 and "Number of Support/Resistance" is 4.
in this example "Threshold" is 0 and "Number of Support/Resistance" is 5.
Last example; Labels are shown for each zone, you can set location of the labels. SR order and Upper/lower band of each zone are shown in each label.
Enjoy!

M.Right Awesome RSI+ (cc)Hey Traders,
Tonight I figured I'd release a special indicator that I've had in the works for years and finally was able to piece it together using pine. It's an extremely accurate take on the RSI. I plan to continue to refine the indicator and add more features, but as it is this is still one you can make a lot of money with.
(((((Please note: all circles and arrows in the chart above are drawn for illustration. Below is a chart showing regular session)))))
This indicator will act similarly to a regular RSI (Relative Strength Indicator) in that there are Oversold and Overbought levels, but also volatility bands around it to allow for more accurate signals whilst moving the Oversold (OS) and Overbought (OB) levels further apart ( less false OB/OS signals ). As shown in the chart above, it's able to detect some pretty big moves with both speed and accuracy .
Most of you are familiar with and use an RSI indicator so I will keep this description as brief as possible: The Relative Strength Index (RSI), developed by the legendary J. Welles Wilder, is a momentum oscillator that measures the speed and change of price movements; it oscillates between 0 - 100, with levels set as Overbought and Oversold. These levels are where a trader make look for a reversal, however they must keep in mind in an uptrend or bull market, the RSI tends to remain in the 40 - 90 range; 40 - 50 zone often will act as support. More advanced traders will also look for divergences between the price and the oscillator (i.e. price trending upward while oscillator trending downward). As far as oscillators go, the RSI is one of the most frequently used, by both advanced and beginner traders alike.
Works great on multiple timeframes. It may not catch every rally, but it will catch most --even on smaller timeframes (i.e. 5 minutes in image below).
As with all of my scripts I like to make them customizable:
You can change the up and down colors on the RSI ribbons and the color and style (dotted shown) of Overbought / Oversold lines. In future versions, I will add more color customizations and additions.
Can toggle 1 or both of the 2 highlight signals off to make it a little more plain.
Lot's of ways to make it look the way you'd like it to.
--The alerts include both the super accurate Bullish and Bearish signals shown with the background highlights. They are pre-filled so it will automatically display the price and time that the alert went off for you.
If I missed anything or you have a question, please let me know!
Cheers,
Mike
Please note: I have made this indicator invite only, send me a DM if you're interested in trying it out.

Higher Time Frame Chart OverlayHello All,
This script gets OHLC values from any security and Higher/Same time frame you set, then creates the chart including last 10 candles. it shows Symbol name, Time Frame, Highest/Lowest level of last 10 candles and Close Price at the right side of the chart as well. Closing price text color changes by the real-time candle of the related symbol and time frame. The all this was made using the Tables in Pine and the chart location doesn't change even if you change the size of main chart window.
Almost everything can be change as you want. You can change/set:
- Colors of Body and Top/Bottom Wicks separately
- The Height of each Cell
- The Width of Body and Wicks
- The Background and Frame color
- Enable/disable Status Panel (if you disable Status Panel then only candle chart is shown)
- Location of Status Panel
- Text color and Text size
- The Background color of Status Panel
Some examples:
The info shown in Status Panel:
You can change The Height of each Cell and The Width of Body and Wicks
You can change colors:
You can change location of the chart:
If you add the script more than once then you can see the charts for different symbols and time frames: (This may slow down your chart)
If you right-click on the script and choose "Visual Order" => "Bring to front" then it will be better visually:
P.S. Using this script may slow down your chart, especially if you add it more than once
Enjoy!

HAP Auto Trend Line [PRO]Hello Traders!
The trend line is among the most important tools used by technical analysts. Instead of looking at past business performance or other fundamentals, technical analysts look for trends in price action. A trend line helps technical analysts determine the current direction in market prices. Technical analysts believe the trend is your friend, and identifying this trend is the first step in the process of making a good trade, and it can tell Support/resistance is very good.
But when drawing Trend Lines, sometimes we're not sure where to start. From where is the starting point? And sometimes it can be drawn multiple lines with different support/resistance lines over time. This itself can be confusing, so I tried to create a tool that allows it to draw lines automatically. According to price movement.
Let's take a look at the variables you need to understand from our indicators.
For this indicator it works in two main parts:
Section of Trend Line
Trend Reversal section
Therefore, these two parts have separate functions. To be used as a component for easier decision-making.
Trend Line, as I said before, what it is. Next is Trend Reversal. I will simply say it is. A period of time when the candle tries to pump and dump. This will help point out the potential price reversal. And if there is a trend line area, it is an interesting point to consider. To identify possibilities.
Some variables from the settings page
Number of Bars to Check : It is the number of past candlesticks to consider. To identify the start of the Trend Line, if it meets the condition, it will automatically draw the Trend Line for you.
Trend Line Depth : It is the frequency. Of identifying the starting point Trend Line. If the value is large, it will find a low Trend Line, and if it is low, it will find more Trend Line. This is flexible. So you have to try it yourself. On demand.
Overview
You can turn it on or off. Support/resistance position either.
Select Emoji Support/resistance. Freely
Line style you want
your favorite color
customizable line intensity
the script is fast enough to run on 1sec chart:
fun !

Indicators OverlayHello All,
This script shows the indicators in separate windows on the main chart. Included indicators are RSI, CCI, OBV, Stochastic, Money Flow Index, Average True Range and Chande Momentum Oscillator. indicator windows are located at the top or bottom of the chart according to last moves of the Closing price. Different colors are used for each indicator. Horizontal levels are shown as dashed line and label as well.
Using the options;
You can enable/disable the indicators you want to see or not
You can change source and length for each indicator
You can set window length. using this length indicator windows are located on the chart
After you added this indicator to your chart I recommend: right click on any of the indicator windows => "Visual Order" => "Bring to front" as seen screenshot below:
in this example only 3 indicators enabled and period is set as 80:
indicator windows moves to the top or bottom of the chart according to the close price:
P.S. if you want to see any other indicator in the options then leave a comment under the indicator ;)
Enjoy!

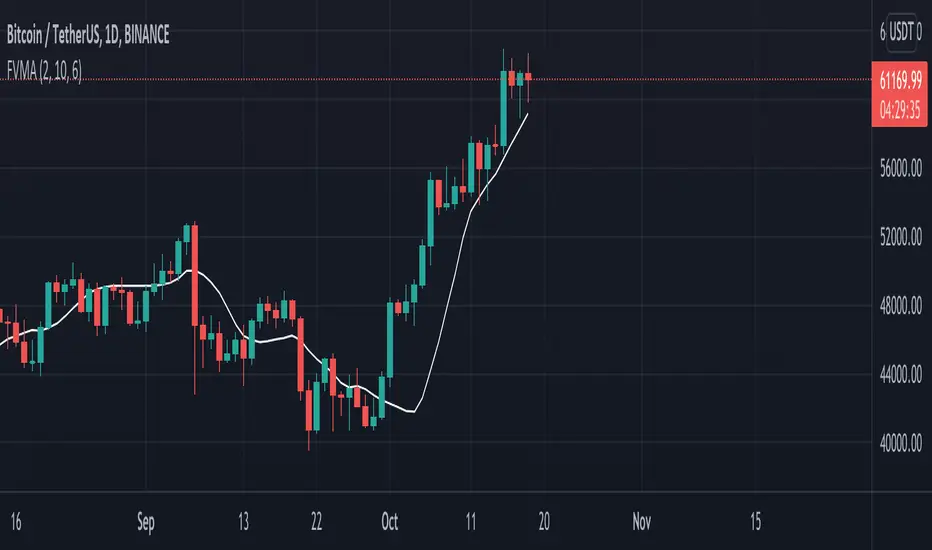
Bixord: FantailVMAThis indicator is a combination of moving average and ATR indicators. The indicator stays pretty close to price and at the same time shows clear trend of asset/stock. It shows you when price is above the FantailVMA it indicates an uptrend and when price is below it indicates a downtrend otherwise.
Hope you find this indicator useful!
Happy trading..
3rd WaveHello All,
In Elliott Wave Theory, 3rd wave is not the shortest one in the waves 1/3/5 and it's usually longest one. so if we can catch it then we may get good opportunities to trade. This script finds 3rd wave experimentally. it can be also the 3rd waves in the waves 1, 3, 5, A and C. the 3rd wave should have greater volume than other waves, the script can check its volume and compare with the volumes of the waves 1 and 2 optionally.
Pine Team released Pine version 5! This script was developed in v5 and it uses Library feature of Pine v5 for the zigzag functions. This script is also an example for the Pine developers who learn Pine v5 and Libraries.
Options:
Zigzag Period: is the length that is used to calculate highest/lowest and the zigzag waves
Min/Max Retracements: is the retracement rates to check the wave 2 according to wave 1. for example; if min/max values are 0.500-0.618 then wave 2 must be minimum 0.500 of wave 1 and maximum 0.618 of wave 1.
Check Volume Support: is an option to compare the volumes of1. 2. and . waves. if you enable this option then the script checks their volume and 3rd wave volume must be greater then 1 and 2
there are 4 options for the targets. you can enable/disable and change their levels. targets are calculated using length of wave 1.
Options to show breakout zone, zigzag, wave 1 and 2.
and some options for the colors.
The Library that is used in this script:
P.S. This is an experimental work and can be improved. So do not hesitate to drop your comments under the script ;)
Enjoy!

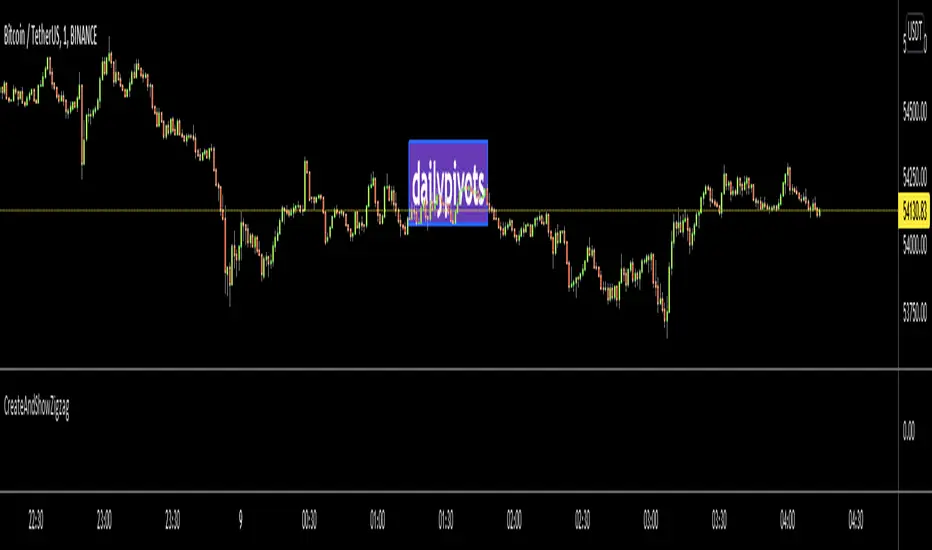
CreateAndShowZigzagLibrary "CreateAndShowZigzag"
Functions in this library creates/updates zigzag array and shows the zigzag
getZigzag(zigzag, prd, max_array_size) calculates zigzag using period
Parameters:
zigzag : is the float array for the zigzag (should be defined like "var zigzag = array.new_float(0)"). each zigzag points contains 2 element: 1. price level of the zz point 2. bar_index of the zz point
prd : is the length to calculate zigzag waves by highest(prd)/lowest(prd)
max_array_size : is the maximum number of elements in zigzag, keep in mind each zigzag point contains 2 elements, so for example if it's 10 then zigzag has 10/2 => 5 zigzag points
Returns: dir that is the current direction of the zigzag
showZigzag(zigzag, oldzigzag, dir, upcol, dncol) this function shows zigzag
Parameters:
zigzag : is the float array for the zigzag (should be defined like "var zigzag = array.new_float(0)"). each zigzag points contains 2 element: 1. price level of the zz point 2. bar_index of the zz point
oldzigzag : is the float array for the zigzag, you get copy the zigzag array to oldzigzag by "oldzigzag = array.copy(zigzay)" before calling get_zigzag() function
dir : is the direction of the zigzag wave
upcol : is the color of the line if zigzag direction is up
dncol : is the color of the line if zigzag direction is down
Returns: null
Crypto Scannner for Traffic Lights StrategyI allways try to make trading easier. Developing Scripts for a quick backtest and improvement of a strategy, getting alerts for entry and exit a position. Loading data to a spreadsheet is also important and takes time.
In this case finding good parameters in different markets or assets to enter in a position, is a bit exhausting. It is something you have to do everyday, and sometimes in different moments of the day.
So I manage to develop a Screener, to take a quick look at specific hours, and tell if I have a buy or sell condition in an specific asset. Obviously this is not an alert to make a trade instantaneusly, but this help you filter a lot of information in matters of seconds. Then open those specific charts and make a better analisys.
A few weeks ago, I published a scrpipt called "Traffic Lights Strategy", that uses 4 emas to get a buy or a sell condition.
It is easy to understand and use, but if you don´t want to missed some opportunities, and don't want to be look at the screen in all the time looking for them, I have here a simple solution.
This script works plotting 2 labels. The first one plots all the assets in which the condition is true (fastema > medema > slowema > filterema or fastema < medema < slowema < filterema)
The second one plots the assets were the condition is true only if happened up to 5 candles back, so you can be in time to enter a trade.
You can take the script and customize it for a different strategy or assets. I coded like this because I backtested this strategy in this specific assets, and statistics suggest that it might be profitable.
I hope this works for you. In other time I'll try to code a script for the others strategies I published.

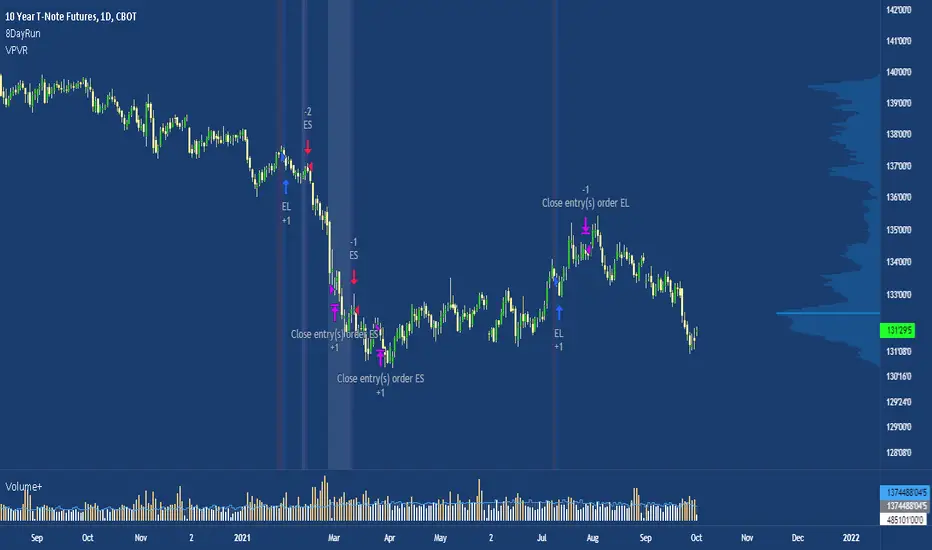
8 Day Extended Runs Inspired by Linda Bradford Raschke.
Strategy suited to the US T-note (ZN1!) with a t-test of 4.06.
The 5 day SMA is vital to Linda’s trend identification system. She’s done extensive testing and research using this indicator and has built models based on it. Linda used the 5 day SMA to determine that large outlier price moves happen in the direction of the trend in each market about 9-10 times per year. The powerful part about that number is that when the trend does persist, it can go on a long run, making this a trade with a high expected value.
Note: the current exit criteria is sell 10 days after entry, users should experiment with different stop placements.
ZigZag Chart with SupertrendHello All,
This script creates Zigzag Chart by using Zigzag waves, so it's timeless chart meaning that no time dependency on X-axis. Optionally it can calculate & show Zigzag Supertrend or Simple Moving Average. Also it can change bar colors of the main chart by trend direction of Zigzag Supertrend.
As seen below, each zigzag wave is a candle on Zigzag chart:
You have a few options and using these options you can find best settings for the securities/timeframes.
You can change Zigzag period, if you change Zigzag Period then all zigzag and the chart is recalculated/reconstructed.
You have option to show Zigzag Supertrend or Zigzag Moving Average, the options you have;
- You can change ATR Length and ATR multiplier for supertrend
- You can change Length for Simple Moving Average
You can change Zigzag candle & wick colors using options. Also you have option to change bar colors according to Zigzag Supertrend direction.
As it's timeless chart, below you can see how/when bar colors and Zigzag Supertrend change:
You can see Simple Moving Average of the Zigzag Candles:
You can play with ATR length and multiplier to find best supertrend:
You can play with the candle & wick colors:
Enjoy!

Trend Fusion By CryptoScriptsWelcome to Trend Fusion! This isn't your typical moving average indicator. It's a multi-timeframe indicator that consists of 3 different moving averages AND let's you choose between EMA, SMA, WMA, VWMA, HMA, and RMA. For example, you can have the 5min 200 EMA, 15min 200 EMA, and 1 hour 200 EMA all on the SAME chart without having to switch timeframes! This helps to create an edge over the competition so you don't have to have multiple charts open and you can see everything on one screen. You can also modify each moving average to the timeframe and value of your choice.
Signals
The Trend Fusion fires a buy signal (green triangle) whenever Moving Average 1 crosses above Moving Average 2 and 3. This is great for catching a bullish trend early, especially when combined with other indicators.
The Trend Fusion fires a sell signal (red triangle) whenever Moving Average 1 crosses below Moving Average 2 and 3. This is great for catching a bearish trend early, especially when combined with other indicators.
You can also make Moving Average 2 and 3 the same value if you just want to create an alert for one moving average crossing over another. (i.e MA 1 is the 50EMA and MA 2 and 3 both have a value of 200 so you're just looking for the 50EMA to cross over the 200EMA).
This indicator is great for catching big trends and catching them early (as seen by the picture), and fires multiple buy signals or sell signals in case you didn't catch the first one so you still have time to get in the trade.
Alerts
You can also set alerts for the buy and sell signals! Just click the clock icon in the top middle of the chart and click Trend Fusion in the drop-down menu. Make sure to select "Once per bar close" so you know the signal is confirmed.
Each timeframe acts differently so make sure you experiment/backtest with each one and tailor your moving average values accordingly.
Disclaimer: Past results are not indicative of future returns.
PM me to obtain access and please let me know if you have any questions! :)

WEEKLY BTC TRADING SCRYPTWeekly BTC Trading Scrypt(WBTS)
This script is only suggested for cryptocurrencies and weekly buying strategy which is long term.Using it in another markets(e.g forex,stock,e.t.c) is not suggested. The thing makes it different than other strategies we try to understand bull and bear seasons and buying selected crypto currency as using formula if weekly closing value crossover eight weeks simple moving avarage buy,else if selected crypto currency's weekly closing value crossunder eight weeks simple avarage sell. Eight week moving avarage is also uses weekly closing prices but for being able to use this strategy ,trading pair must have more than eight candles in weekly chart otherwise the 8 weeks simple moving avarage value cannot be calculated and script does not work.
This script has a chart called WBTS and it has following features:
Strategy group consist of 3 inputs:
1)Source: Close by default. Our whole strategy uses close values. You can change it but not suggested.
2)Loss Ratio: Because of the cases like the circumstances that manipulates market or high volatility , sometimes graphic show wrong buying signals and this ratio saves user from big money looses(Note : This ratio will always work when selling condition occurs to make user take his profit or prevent him to loss more money because of a wrong positive comes from the indicator.)
3)Reward Ratio : When selling condition happens it will exit user with more profit(if price is already higher than buying point) otherwise it will dimunish loss a bit(if user is below of buying point) or prevents looses(if user is in buying point when selling condition happened.
MA group consist of 2 inputs:
COLOR:Specifies color of the moving avarage.It is equal to #FF3232by hex color code by default.
LINE WIDTH: Specifies linewidth of the moving avarage. It is 2 by default.
GRAPHIC group consist of 2 inputs:
COLOR: It specifies the color of the line which consist of weekly closing prices. It is equal to #6666FF hex color code by default.
LINE WIDTH: Specifies linewidth of the line which consist of weekly closing prices. It is 2 by default.
STRATEGY EXECUTION YEAR: It will show the orders,profits and looses done by script after the input year giving in it.It is 2020 by default.
The last feature is strategy equity,it is not in one of these groups. User should click on settings button on the WBTS indicator than chose Style section and there is a deactivated check box near in the plot section if user activate it, the equity line will show in indicator's graph.
Logic of This Strategy:The story of this strategy began when I studied BTC's price movement from 2020 to today with 8 weeks simple moving avarage (it takes weekly closes as source) and weekly clossing values. I understood that there was a perfect interest between bull and bear market and following conditions:
buy_condition=crossover(weekly_closing_values,8_week_simple_moving_avarage)
sell_condition=crossover(weekly_closing_values,8_week_simple_moving_avarage)
and I tried same thing on the same and bigger time frames("for example i studied how the strategy works from the beginning to today with bitcoin and what is our final equity") with bitcoin and other cryptocurrencies and this made me saw better the relation between giving conditions and general market psychology, however I also witnessed some wrong positives coming by script and used a risk reward ratio to save user and set risk reward ratio 1/3 after a research.
For both conditions(buy_condition and sell_condition),when they are realised,script will alert users and an order will be triggered.
Before finishing the description,from settings/properties/ user can set initial capital,base currency,order size and type,but it is 100000 for initial_amount and 1 contract for order size by default.
In backtesting I used the options like the following example :
Initial capital=1000
Base_curreny=USD
Order size=40 USD
Properties place must set different by every single user according to his or her capital and order size must not be higher than his total money because this script is not the best or a good script for derivatives. It is only written for long term-crypto spot trading and I strongly recommend to users that margin may cause bad results and please do not use it with any margin or any market different than crypto market.
Thank you very much for reading)

Traffic Lights Strategy4HS Crypto Market Strategy
This strategy uses 4 ema to get Long or Short Signals
Length are: 4, 9, 18, 100
We take long positions when the order of the emas is the following:
green > yellow > red (As the color of Traffic Lights) and they are above white ema (Used as a filter for long positions)
We take short positions when the order of the emas is the following:
green < yellow < red (As the color of inverse Traffic Lights) and they are below white ema (Used as a filter for short positions)
Enable Long and/or Short Positions in settings
Enable Profit and Stop in strategy settings with different percentage to backtest the strategy. Also if it is better to use a Traditional Stop Loss or a Trailing Stop Loss based on ATR
Change ema filter resolution in settings for better strategy performance
This Strategy was tested on Crypto Market with good results in assets as BTC, ETH, BNB, ADA, LTC, XLM, BCH, among others
Feel free to optimize this strategy, optimizing its parameters. Each asset has its own "personality".

On Balance VolumeEnhanced the original OBV (On Balance Volume) indicator:
- Draw max lines of OBV in the last 30 candles so that we can notice the trend, as well as divergences easier.
- If you use fiat as base currency (USDT in cryptocurrency for example), we can display the OBV in fiat, so that we can compare total trading volume across a list of symbols to find healthy symbols to trade easier.

Ichimoku Cloud Strategy IdeaThis strategy idea uses the famous Ichimoku Cloud (Forward-shifted SMA-9 and SMA-26) and Chiku (52-candle lagged close price) with its default parameters. This strategy is slow and issues few signals. However, this is one of the most performant long-term trend trading strategies. It usually works well on 1D and 4H timeframes and even better on trending instruments. This is the implementation used in QuantCT app.
You can set operation mode to be Long/Short or long-only.
You also can set a fixed stop-loss or ignore it so that the strategy act solely based on entry and exit signals.
Trade Idea
When both close price and chiku are above the cloud, market is considered rising (bullish) and the plotted cloud becomes green.
When both close price and chiku are below the cloud, market is considered falling (bearish) and the plotted cloud becomes red.
Otherwise, market is considered ranging and the plotted cloud becomes orange.
Entry/Exit rules
Enter LONG right after both close price and chiku went above the cloud (i.e. when the end of the plotted cloud becomes green).
Enter SHORT right after both close price and chiku went below the cloud (i.e. when the end of the plotted cloud becomes red).
EXIT market when close price enters the cloud.
CAUTION
It's just a bare trading idea - but a profitable one. You can enhance this idea and turn it into a full trading strategy with enhanced risk/money management and optimizing it, and you ABSOLUTELY should do this!
DON'T insist on using Long/Short mode on all instruments! This strategy performs much better in Long-Only mode on several instruments (Like BTC , ETH, etc.), and also performs better in Long/Short mode on other instruments (Like VET, BNT, etc.).

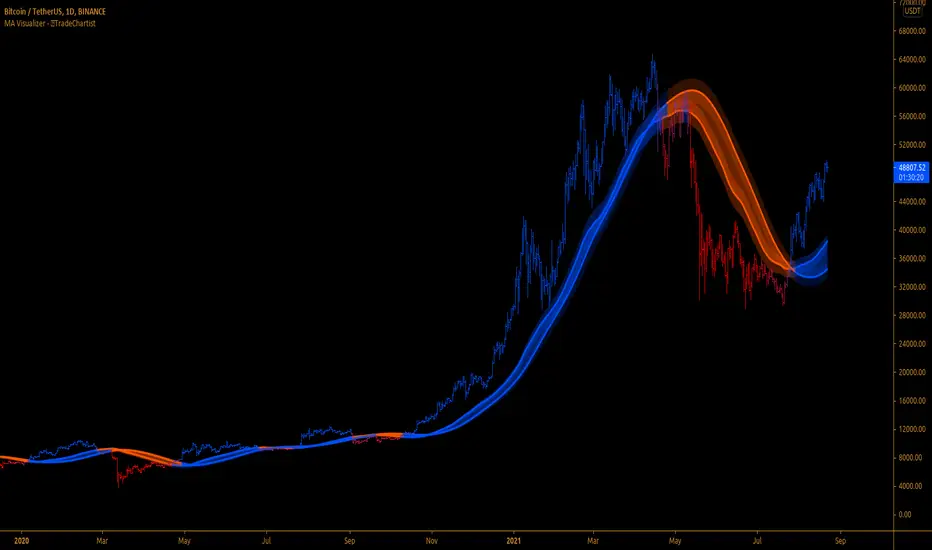
MA Visualizer™TradeChartist MA Visualizer is a Moving Average based indicator aimed to visualize price action in relation to the Moving Average in a visually engaging way.
===================================================================================================================
█ MA Visualizer Features
11 different Moving Averages to choose from the settings to visualize based on MA Visualizer Length (Default - 55 period SMA).
2 Smoothing options (default - 0, 0 uses MA length as Smoothing factor, 1 uses no Smoothing).
4 colour themes to choose from and option to adjust Visualizer Vibrance.
█ Example Charts
1. 1hr chart of OANDA:XAUUSD using 55 period WMA.
2. 15m chart of OANDA:EURUSD using 144 period Tillson T3 MA.
3. 4 hr chart of OANDA:US30USD using 55 period SMMA.
===================================================================================================================
Best Practice: Test with different settings first using Paper Trades before trading with real money
===================================================================================================================
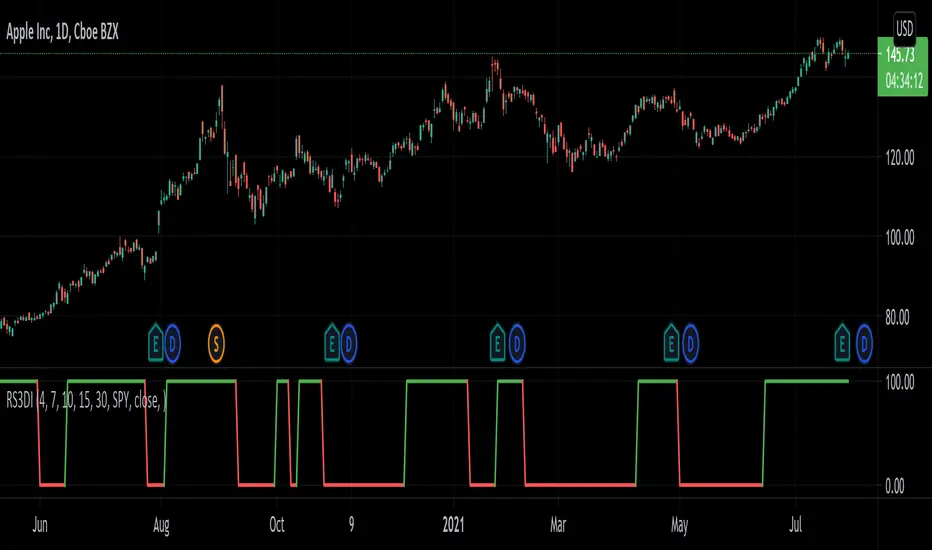
Relative Strength 3D Indicator [CC]This is a custom indicator of mine loosely based on the work by James Garofallou (Stocks and Commodities Sep 2020 pg 14) and this is meant for medium to long term trend confirmations. The idea behind this indicator is to capture 3 different dimensions of trend strength. The first dimension captures the overall strength of the underlying stock vs the market (in this case the S&P 500). The second dimension captures the overall trend strength by assigning a scoring system so when all faster moving averages are stronger than slower moving averages then it gets the max points. The final dimension is the strength of the overall strength of everything so far. Buy when the indicator line turns green and sell when it turns red.
Let me know if there are any other indicators or scripts you would like to see me publish!
Natural Directional Index [CC]The Natural Directional Index was created by Jim Sloman and this is another indicator that I'm publishing from the collection of Ocean indicators. I want to make sure his legacy is covered by as many eyes as possible. This is his version of the directional index indicator but he uses his weighting method to use the square root of time and you can see that the signals are very smooth. Big thanks of course to @altcoinz and @tmac87 for helping me get the full source code and files for all of his work. This indicator captures the current trend and I have used my strong buy and sell signals to let you know the strength of the current trend. Darker colors are for strong signals and lighter colors are for normal ones. Buy when the line turns green and sell when it turns red.
Let me know if there are any other indicators you would like to see me publish!
