Hull_TSI StrategyTrue Strength Index, but Exponential Moving Average taken out and replaced with Hull Moving Average
increase the values for increased timeframes i found good on 1hour chart 700,700,700 (instead of 420)
TSI

Confirmed Strength Index - MACD*RESULTS ARE FROM x10 LEVERAGING*
Uses the MACD principle with CSI, looks for bottoms and tops to short and long. Favorite to use.

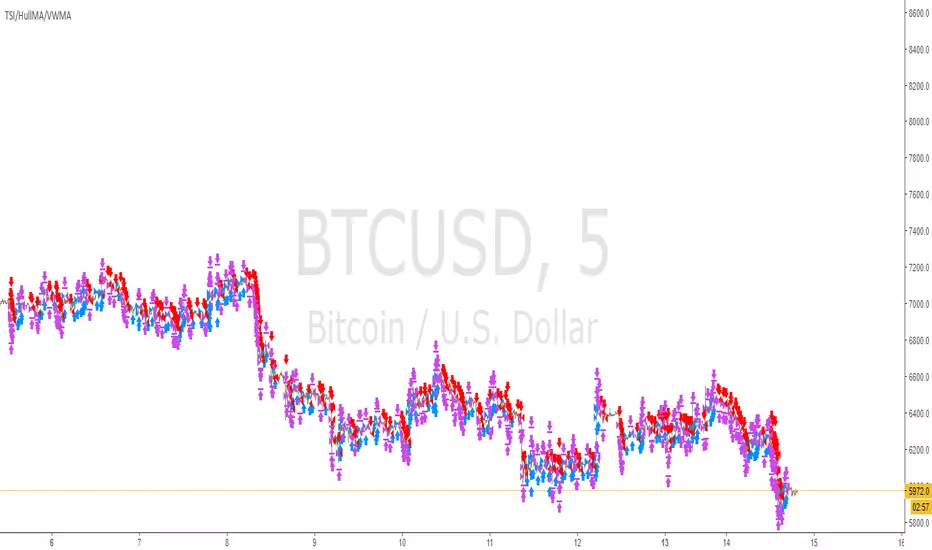
TSI/HullMA/VWMA strategychange the settings to make it profitable.. default settings not apply to any instrument in-particular.. dont be afraid to try different settings to find profitable combo of settings on your chosen crypto/FX/stock etc.. to avoid repaint wait for next candle before confirm signal..
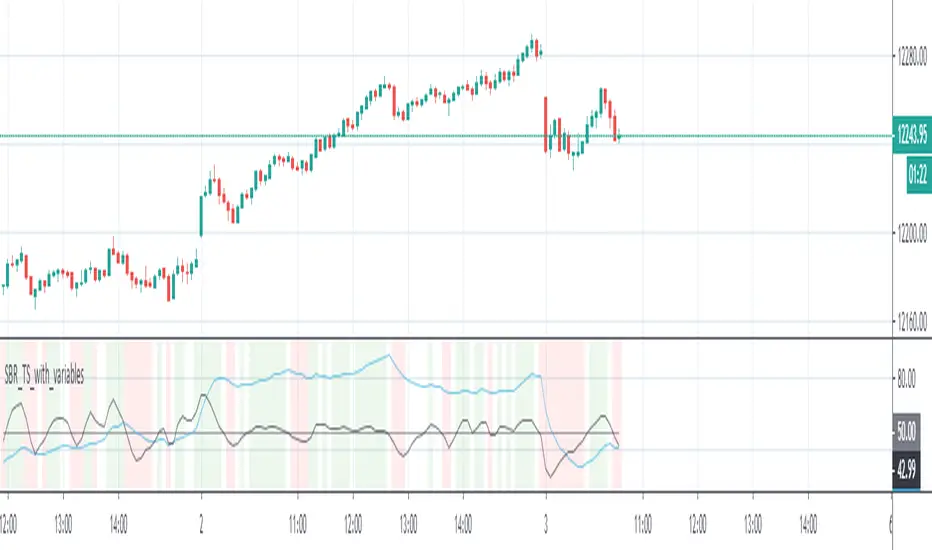
SBR_Trade_signalThis indicator is based on true strength indicator with wave trend oscillator.
Disclaimer: All the signals it is giving is based on the market movements only. I am not responsible for your PNL if you follow this indicator.
*Caution: Beta version
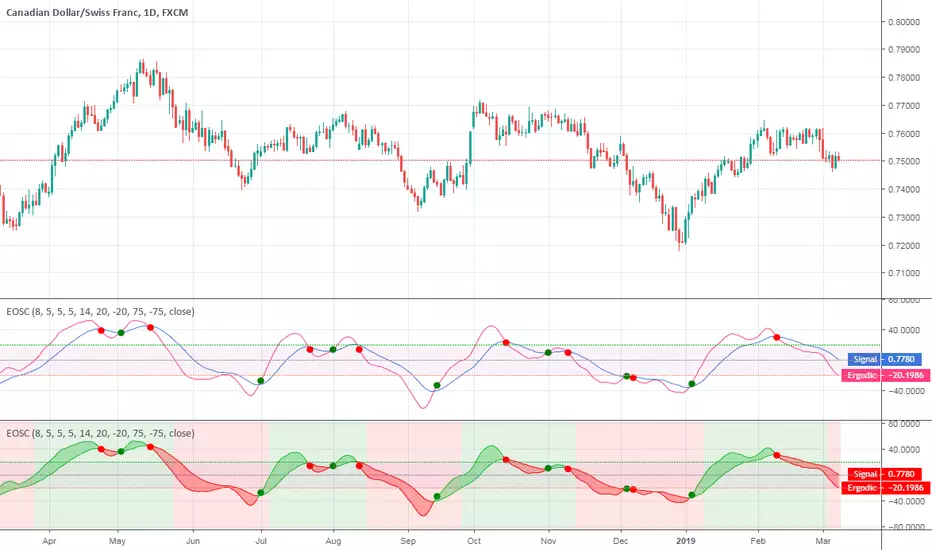
Ergodic OscillatorErgodic Oscillator indicator script.
Ergodic Oscillator is based on True Strength Index (TSI) by William Blau.
True Strength Indicator + Moving Average Rate Of ChangeFusion de los 2 indicadores en uno solo para que las personas que no tienen FULL PRO puedan usar los 2 indicadores juntos sin ocupar lugar...
XD!!

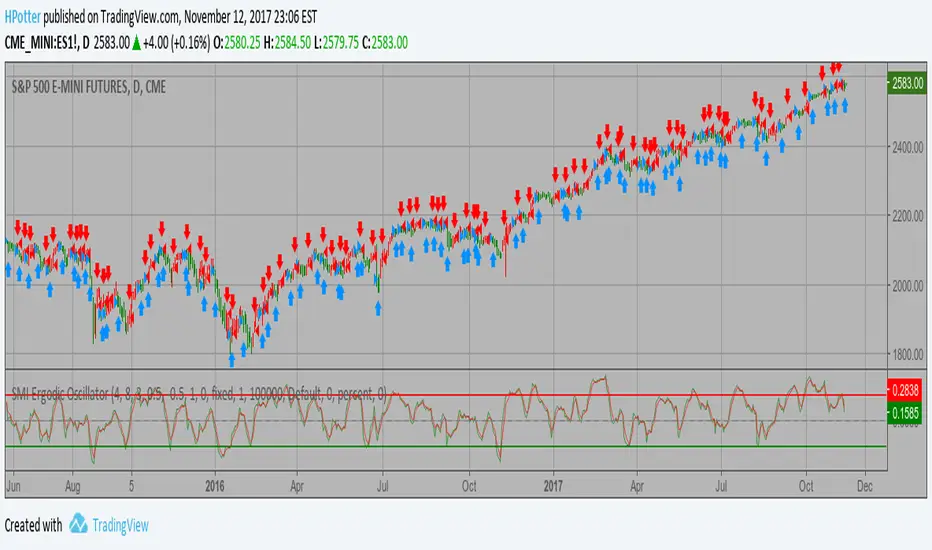
Trend Shift Indicator (Strategy)Trend Shift Indicator Strategy
This strategy provides a means for testing the underlying algorithm contained in
Default is set such that the input is simple buy/sell, all/nothing, 1/0 shares.
I'm always happy to answer any questions you have (see contact information in my profile: www.tradingview.com
Any feedback is appreciated . Please let me know how this did in comparison to your favorite strategy!

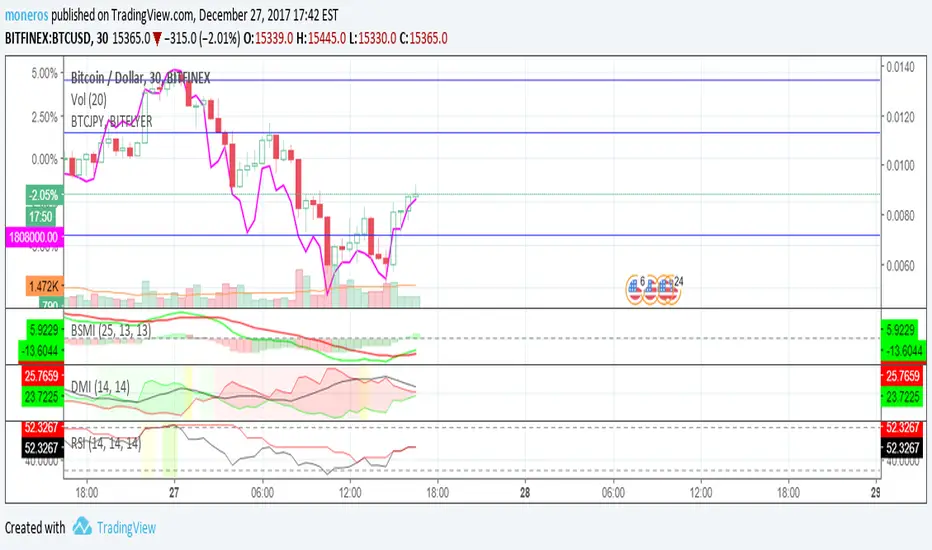
Bitcoin Momentum TSIChart based on True Strength Indicator
It was improved to show same information as Squeeze Momentum Indicator by LazyBear,
but it seems to have better and quicker response to changes and was tested on Bitcoin mainly.
Enjoy it!
BITFINEX:BTCUSD
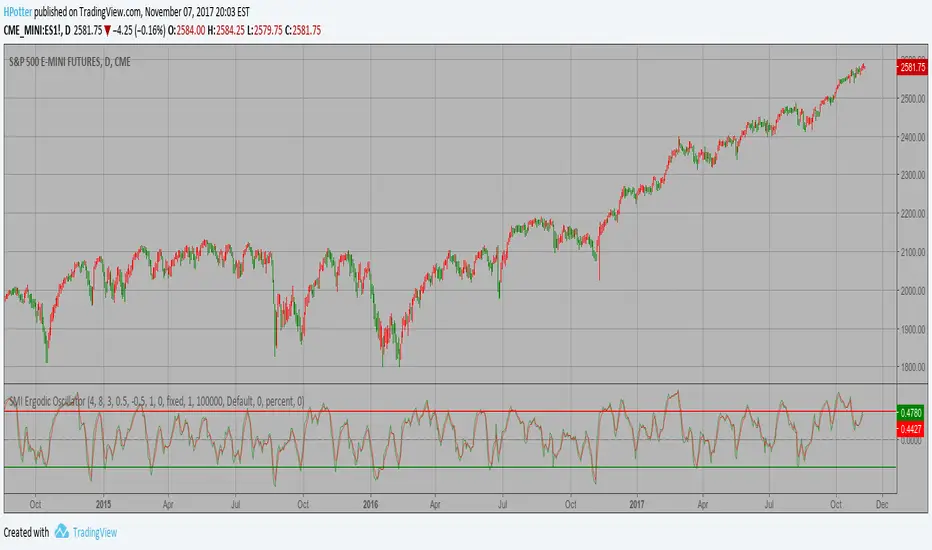
SMI Ergodic Oscillator Backtest ver.2 The SMI Ergodic Indicator is the same as the True Strength Index (TSI) developed by
William Blau, except the SMI includes a signal line. The SMI uses double moving averages
of price minus previous price over 2 time frames. The signal line, which is an EMA of the
SMI, is plotted to help trigger trading signals. Adjustable guides are also given to fine
tune these signals. The user may change the input (close), method (EMA), period lengths
and guide values.
You can use in the xPrice any series: Open, High, Low, Close, HL2, HLC3, OHLC4 and ect...
WARNING:
- For purpose educate only
SMI Ergodic Oscillator Strategy ver.2 The SMI Ergodic Indicator is the same as the True Strength Index (TSI) developed by
William Blau, except the SMI includes a signal line. The SMI uses double moving averages
of price minus previous price over 2 time frames. The signal line, which is an EMA of the
SMI, is plotted to help trigger trading signals. Adjustable guides are also given to fine
tune these signals. The user may change the input (close), method (EMA), period lengths
and guide values.
You can use in the xPrice any series: Open, High, Low, Close, HL2, HLC3, OHLC4 and ect...
WARNING:
- For purpose educate only
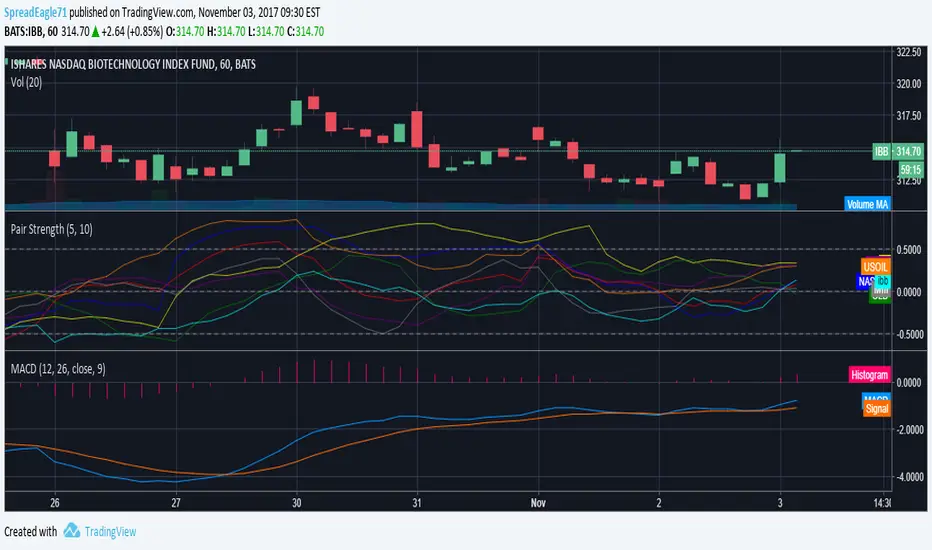
Pair Strength: Updated Version of the one by GlazI updated this version used for Forex with Stock&Index related instruments. Enjoy.
SMI Ergodic Oscillator Backtest The SMI Ergodic Indicator is the same as the True Strength Index (TSI) developed by
William Blau, except the SMI includes a signal line. The SMI uses double moving averages
of price minus previous price over 2 time frames. The signal line, which is an EMA of the
SMI, is plotted to help trigger trading signals. Adjustable guides are also given to fine
tune these signals. The user may change the input (close), method (EMA), period lengths
and guide values.
You can use in the xPrice any series: Open, High, Low, Close, HL2, HLC3, OHLC4 and ect...
You can change long to short in the Input Settings
WARNING:
- For purpose educate only
- This script to change bars colors.

SMI Ergodic Oscillator Strategy The SMI Ergodic Indicator is the same as the True Strength Index (TSI) developed by
William Blau, except the SMI includes a signal line. The SMI uses double moving averages
of price minus previous price over 2 time frames. The signal line, which is an EMA of the
SMI, is plotted to help trigger trading signals. Adjustable guides are also given to fine
tune these signals. The user may change the input (close), method (EMA), period lengths
and guide values.
You can use in the xPrice any series: Open, High, Low, Close, HL2, HLC3, OHLC4 and ect...
WARNING:
- This script to change bars colors.


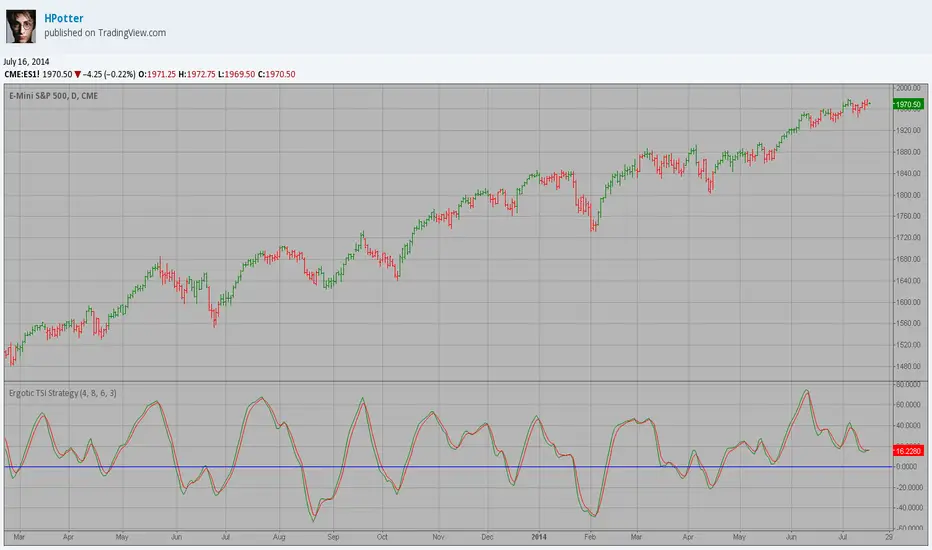
Ergotic TSI Strategy Backtest r - Length of first EMA smoothing of 1 day momentum 4
s - Length of second EMA smoothing of 1 day smoothing 8
u- Length of third EMA smoothing of 1 day momentum 6
Length of EMA signal line 3
Source of Ergotic TSI Close
This is one of the techniques described by William Blau in his book "Momentum,
Direction and Divergence" (1995). If you like to learn more, we advise you to
read this book. His book focuses on three key aspects of trading: momentum,
direction and divergence. Blau, who was an electrical engineer before becoming
a trader, thoroughly examines the relationship between price and momentum in
step-by-step examples. From this grounding, he then looks at the deficiencies
in other oscillators and introduces some innovative techniques, including a
fresh twist on Stochastics. On directional issues, he analyzes the intricacies
of ADX and offers a unique approach to help define trending and non-trending periods.
You can use in the xPrice any series: Open, High, Low, Close, HL2, HLC3, OHLC4 and ect...
You can change long to short in the Input Settings
Please, use it only for learning or paper trading. Do not for real trading.

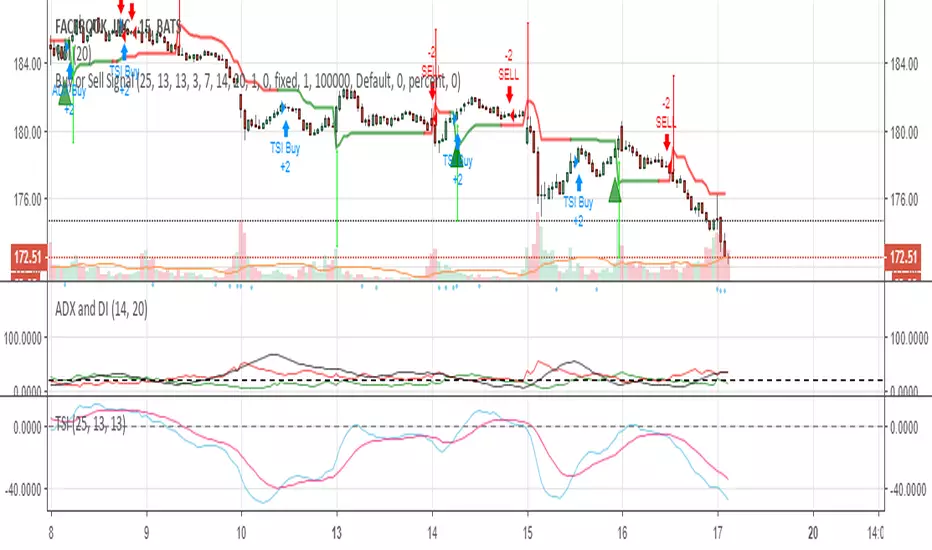
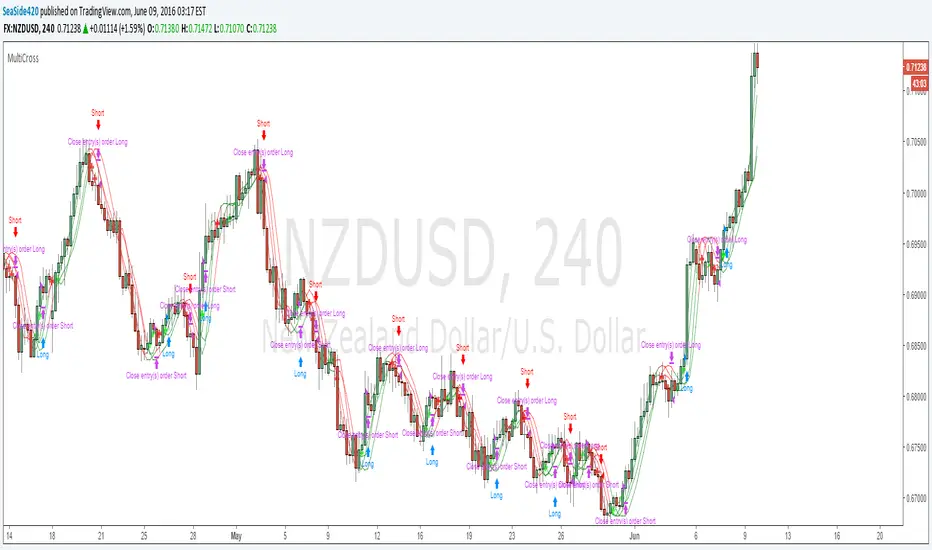
MultiCross v4.20Quad-HullMA-cross & VWMA & MacD & TSI combination
Version 4.20
added script for strategy settings to be already correct when strategy loads onto chart:
calc_on_order_fills= true, calc_on_every_tick=true, default_qty_type=strategy.percent_of_equity, default_qty_value=100, pyramiding=0

MultiCrossQuad-HullMA-cross & VWMA & MacD & TSI combination
Made for 4H - other timeframes unkown result.
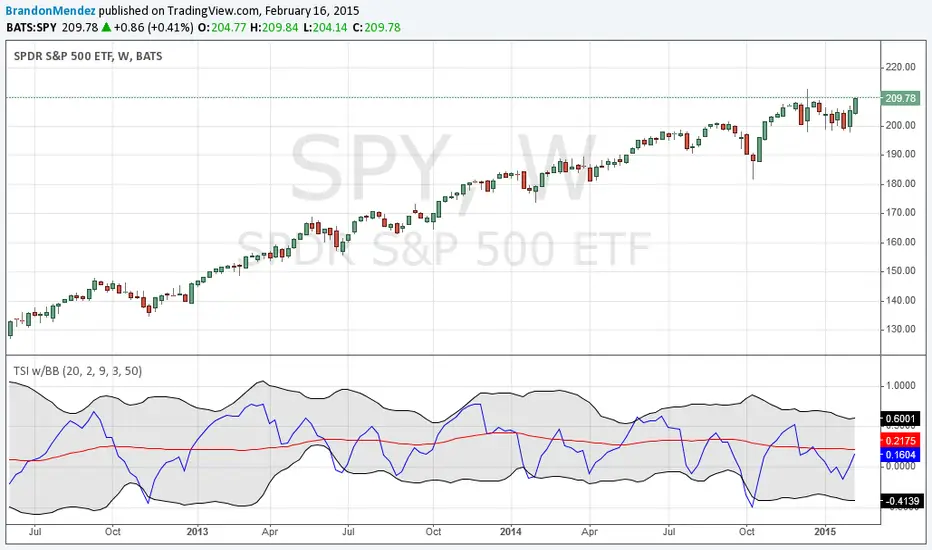
TSI w/BBA simple modification of the normal TSI indicator. It adds Bollinger Bands that are based on the TSI values, instead of the price history.
I find this indicator useful on the weekly interval.
True Strength Indicator MTFHere is an example of a script showing a multi-time frame of TSI.
Chart below compares FX EURUSD Daily TSI to 1H TSI
Here is an updated version
study("True Strength Indicator MTF", shorttitle="TSI MTF")
resCustom = input(title="Timeframe", type=resolution, defval="60" )
long = input(title="Long Length", type=integer, defval=25)
short = input(title="Short Length", type=integer, defval=13)
signal = input(title="Signal Length", type=integer, defval=13)
price = close
double_smooth(src, long, short) =>
fist_smooth = ema(src, long)
ema(fist_smooth, short)
pc = change(price)
double_smoothed_pc = double_smooth(pc, long, short)
double_smoothed_abs_pc = double_smooth(abs(pc), long, short)
tsi_value = 100 * (double_smoothed_pc / double_smoothed_abs_pc)
tsi = security(tickerid, resCustom,tsi_value)
plot(tsi, color=black)
plot(ema(tsi, signal), color=red)
hline(0, title="Zero")

Ergotic TSI Strategy r - Length of first EMA smoothing of 1 day momentum
s - Length of second EMA smoothing of 1 day smoothing
u- Length of third EMA smoothing of 1 day momentum
Length of EMA signal line
This is one of the techniques described by William Blau in his book "Momentum,
Direction and Divergence" (1995). If you like to learn more, we advise you to
read this book. His book focuses on three key aspects of trading: momentum,
direction and divergence. Blau, who was an electrical engineer before becoming
a trader, thoroughly examines the relationship between price and momentum in
step-by-step examples. From this grounding, he then looks at the deficiencies
in other oscillators and introduces some innovative techniques, including a
fresh twist on Stochastics. On directional issues, he analyzes the intricacies
of ADX and offers a unique approach to help define trending and non-trending periods.
You can use in the xPrice any series: Open, High, Low, Close, HL2, HLC3, OHLC4 and ect...