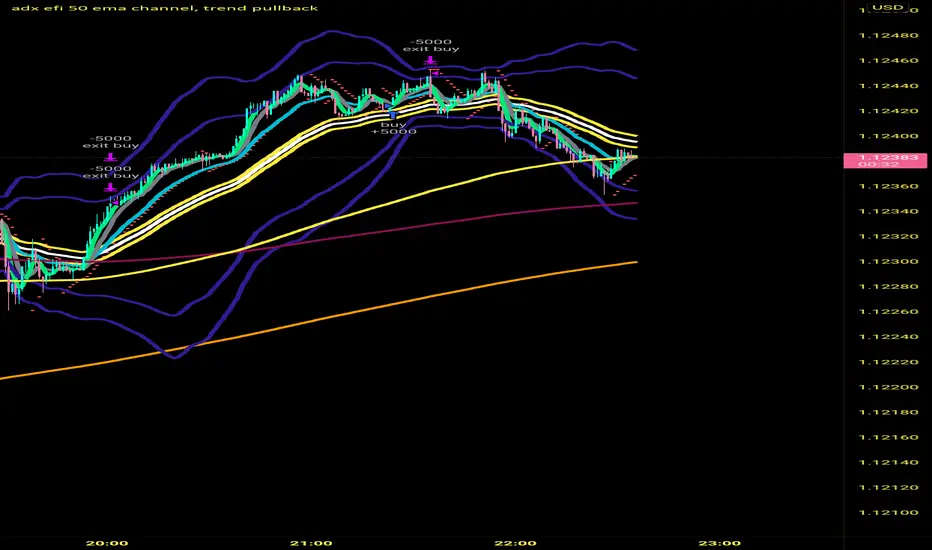
PROSTRATS Pine Script for Swing TradingThis is a simple script for swing trading. It uses my 2 favorite indicators; the Choppiness Index as well as Fibonacci Retracement. This script is meant to run on the 4 hour time frame, in my case I use BTCUSD. It will buy when 2 conditions are met. The first is that the Choppiness Index is above 54.5 on the Daily Time frame, which means the price has potential to swing high or low. I used the security() function to ensure this takes place on the daily time frame because larger time frames tend to dominate smaller time frames in terms of overall swings. The second condition is that the price has to cross above the 1 level of the Fibonacci Retracement. This ensures that the swing is going to be an upwards swing, as opposed to a downwards one. The measure I took to ensure that the Fibonacci Retracement level of 1 is above the 0 level is to make sure that the r value of the 1 level is greater than the r value of the 0 level.
The sell condition is programmed to execute when either the price crosses above the 1.618 level(profit target) or cross below the 0 level(stop loss).
Volatilità
Companion::InsurgentCompanion::Insurgent is a combined indicators strategy. Performances are pretty good on 1D, 4H and 1H timeframes and it can be used on Bitcoin and Altcoin markets.
Mainly, it is a trategy based on Ehlers formulas.
Used indicators:
- Ehlers Instantaneous Trend: trendline analysis;
- Ehlers Super Bandpass Filter: momentum detection;
- EMA: Long/Short time selector.
What the script does:
- determines trendlines combining mulitple indicators;
- automaticlally calculates Take profit and Stop Loss levels;
- permits automation generating Autoview signals (create an alert with {{strategy.order.alert_message}} in message text field to trap Autoview commands;
- supports for margin trading. Spot trading will be added in the future.
BACKTESTING
Backtest is not leveraged. Defaults are set as follow:
Capital: 10000
Percent of equity used for trades: 10%
Commission: 0.18% this is Bitfinex commission on orders
Change them accordingly on how you trade to get a more realistic backtest results.
Bollinger Band with RSI
Using combination bollinger band and RSI indicator as guide to predict price volatility and the best entry point. The strategy logic is pretty straightforward where we're interested with close price that touches the lower bollinger band ; there are only two scenarios that will happened after the price reaches the lower band; the price might rebound from the lower bollinger band or drop lower and continue downtrend. To confirm the price movement, we use a second indicator which is the RSI to further investigate the price trend. For example, if the price reaches the lower bollinger band but the RSI value is not in the oversold region, we can conclude that the price will go lower and continue downtrend. If the RSI value is in the oversold region, we can use this price area as our entry point.
Stop loss is necessary to avoid losing too much capital if the RSI value lingers too long in the oversold region.
Best take profit area is when the price rebound above the middle bollinger band area/upper bollinger band or when the RSI reaches overbought region; whichever comes first.
Long entry:
RSI < 30 & close price < lower bollinger band
Exit entry:
RSI > 70
Default stop loss: -25%
Bitcoin lover by Akthis strategy used to determine and anticipate potential changes in market price and reversals. The Highs referred to in the title are created based on the number of bars that exhibit lower highs on either side of a High, whereas the Lows are created based on the number of bars that exhibit higher lows on either side Low.it also analyzing price changes and reversals, a trader has more of an ability to determine and predict price patterns and general price trends...It take profit on pre define 500 points.. u can also change is take profit level. .and also added max intraday trades..so it help in risk management
brokerage added 0.02% and slippage added 20.
How it works??
It calculate swing on 5min chart.. When swing high is break it shows buy signal and when swing low is break it show sell signal.. And it book profit on 500 points.. U can also change profit points. .After booking profit if high or low of price break it again show buy and sell signal.. U can also use it with trend lines and moving average for better entry and exits..
I hope this will help trader for find out trends and profit booking and if u want to use it with comment strategy action you have to just add comment in comment box
caution: always follow risk management before using strategy
Volatility Stop Strategy [frostybot]This is a modified version of the Standard Volatility Script on TradingView, tweaked for the BTCUSD chart on the 1H timeframe.
I've designed this strategy to be used with Frostybot with ease.
However, this can be disabled in the settings. Then you will receive alerts without Frostybot commands.
First, open the settings section of the indicator. Then fill in the following fields:
You can play around with the TP values and see what works best for your personal risk assessment
Account Stub: enter the name of your stub on Frostybot (only needed if you enable the "Use Frostybot Alert Triggers" checkbox)
Position Size and Size Type: Here you can choose the amount on which you want to enter the trade, for example: 100$, 2x,... (only needed if you enable the "Use Frostybot Alert Triggers" checkbox)
Symbol: Enter the BTC symbol that is valid for the Frostybot Stub's Exchange. For FTX: BTC-PERP, for Binance Futures: BTC /USDT,... (only needed if you enable the "Use Frostybot Alert Triggers" checkbox)
Press OK
Then, setup an alert on the strategy:
Configure the correct Frostybot Webhook URL (don't forget to add /frostybot after the IP address) (only needed if you enable the "Use Frostybot Alert Triggers" checkbox)
Give the alert a name of choice
Put this as the message: {{strategy.order.alert_message}}
Press OK
Enjoy and happy trading!
ATR + %R Scalping StrategyThe Average True Range is a single line indicator that measures volatility. The indicator was originally developed by J. Welles Wilder to measure the volatility of commodities within the futures market.
ATR does not measure price trends or price direction hence %R and Parabolic SAR indicators were added.
The strategy enhances standard Average True Range and %R composition with trend confirmation and filters which clear out market noises and manipulations from triggers.
The strategy supports traditional and cryptocurrency spot, futures, options and marginal trading exchanges. It works accurately with BTC, USD, USDT, ETH and BNB quote currencies. Best to use with 5 and 15 minutes timeframe charts and Limit orders.
The strategy can be and should be configured for each particular asset. You can change filters and risk management settings to receive the most advanced accurate alerts
Advantages of this script:
Strategy has high profit factor around 30.32
Backtests show high accuracy around 91.18%
High Net Profit percentage
Low Drawdowns
Weak signals are filtered
Dynamic Take profit and Stop loss
Fast deals around 50 minutes per trade
Can be applied to any market and quote currency
Easy to configure user interface
How to use?
1. Apply strategy to the trading pair your are interested in at 5m or 15m timeframe chart
2. Configure the strategy: change filters values and risk management settings until Strategy tester shows good results according to mathematical expectation
3. Set up a TradingView alert to trigger when strategy conditions are met
4. Strategy will send alerts when to enter and when to exit positions
Trend Daddy Bitcoin Strategy - Optimized For Automated TradingOverview:
This algorithm is the end result of years of trading both bitcoin and traditional markets. Over the years I've learned that trying to catch a top or bottom of a move is nearly impossible and results in a lot of pain. Instead, I've learned the money is made somewhere in the middle trading the momentum. That is how I came up with the Trend Daddy algo. Combining multiple different indicators, this script is able to pick up on large trending moves while at the same time avoiding sideways chop.
Signals:
The signals this algorithm produces are simple long and short signals. Keep in mind, this script will NOT attempt to short the top of the market nor will it attempt to catch knives. The signals that are thrown out attempt to play the momentum of the market, not reversals. Always wait for a candle to confirm in order to enter a trade.
Time Frame:
Bitcoin markets are extremely volatile and it is not recommended using this script on any time frame lower than 4 hours, with daily or above being the recommended time frame.
Backtesting:
I have run hundreds of backtests on this algorithm but also keep in mind that backtests do not show future results. I try to be as realistic in my backtests and do not account for any compounding. In the published backtest I ran an account size of $10k USD, only trading $10k USD per trade with no compounding. With this extremely conservative strategy, from day one of Bitcoin being listed on an exchange, this strategy would return roughly 1535% or $15,351 over the past 9 years.
Disclaimer:
Trading in any markets, especially cryptocurrencies involves taking on a great magnitude of risk. Do not trade any money that you are not willing to lose. Furthermore, past performance does not guarantee future results. The best trading device is your mind. Hopefully, this algorithm is the next best thing.
B-Xtrender [Backtest Edition] @QuantTherapyToday I have published a Backtest edition of one of my scripts.
For anyone looking into the indicators please have in the source below where the logic behind the indicator is nicely explained also the source of the inspiration of me coding it in tradingview.
ifta.org
Strategy
Entry when both bars are in alignment both green = long / both red = short
Exit when one is against your direction of trade
TSL will also kick in and exit when the percentage is breached
Moving Average is there to filter entries. Will allow entry only when active when the price is above (long-only) or below ( short-only )
Hope you are having a great day !
Moving Regression Band Breakout strategyFollowing the introduction of the Moving Regression Prediction Bands indicator (see link below), I'd like to propose how to utilize it in a simple band breakout strategy :
Go long after the candle closes above the upper band . The lower band (alternatively, the lower band minus the 14-period ATR or the central line ) will serve as a support line .
Exit as soon as the candle closes below the support line .
To manage the risk of false breakouts, a fixed stop loss is set to the value of the support line at the time of opening a position. When the support line moves above the position opening price, shift the stop loss to breakeven.
The same logic but in reverse applies to short positions.
As an option, it is possible to allow long entries only when the slope of the Moving Regression curve is positive (and short entries when the slope is negative).
Model parameters:
Length and Polynomial Order define the lag and smoothness of the model.
Multiplier specifies the width of the channel.
As the default model parameter values, I set those that I found to provide optimal risk / reward ratio on the daily timeframe (for both trending and range-bound market). However, the settings are very flexible and can be well-adjusted to particular market conditions. Feel free to play around and leave feedback in the comments!
Here's the original Moving Regression Prediction Bands script:
CRYPTOOO FOX (Trading System)CRYPTOOO FOX (Trading System)
---DISCRIPTION---
How Strategy Work :
--Strategy is working on higher time frame so i use two high time frame
the higher is ( 2 H or 3 H or 4 H or 8 H or 12 H or Daily ) and the highest is ( Daily ) Time frame .
-- When the higher time frame cross over the Daily time frame( the Highest ) this mean the TREND and
the PRICE also going UP this strategy is going to long position ( Buy position ) .
-- When the higher time frame cross under Daily time frame( the Highest ) this mean the TREND and
the PRICE also going DOWN strategy going to ( close position ) .
-- Notes :
--Strategy use some averages to calculate the higher time frame .
--Strategy use parabolic indicator to filter entries which name is ( Filter )
--Strategy use one more candle close to confirm entry ( Filter 2 )
--This the best time frame ( HIGHER , HIGHEST ) in this strategy in profit and draw down .
--Strategy is working only in Long position i am not recommend to use it in short positions .
--THIS IS NO REPAINT STRATEGY .
--DON'T use it in DAILY time frame
--I recommend so mush to use take profit and stop loss although the low draw down but some time
the market have a huge movements .
---- Strategy Settings which we publish now :
Fees = 0.1 the same as market fees .
Equity = 10 % and you can change it as you want .
Filter = 4 .
Filter 2 = true ( Just mark in check box beside Filter 2 ) .
Charts which working in these settings :
Eth/Usdt- 30 min/Binance ( Current image ) .
Btc/Usdt- 30 min/Binance .
Bch/Usdt- 30 min/Binance .
We do a lot of tests to get the best profit and also the lowest draw down
we will update the new settings for new charts
US30-DinhChienFX Swing [2 orders]Keltner basis: 20 | trend identification: Keltner Upper/Lower 2 | entry: Stochastic breakout k cross d | Stoploss: 2, Profit: 2 |
The strategy finds the rule in 4 years, every year, every quarter. The ratio of risk/reward 1/1 to give the success percentage over 55%.
Makes a second order has a better ratio. US30''s risk/reward: 1/1.86.
Look the right label: that rule has 14 times consecutive wins and 6 times consecutive losses in history.
-----------
+ A Long trend is when the price close & crossover the Keltner Upper 2 + k value of Stochastic indicator crossover 80.
+ A Short trend is when the price close & crossunder the Keltner Lower 2 + k value of Stochastic indicator crossunder 20.
+ to Entry when k value ( Stoch indicator) make correction and cross the d value ( Stoch indicator)
- Buy: d > 70
- Sell: d < 17
*** Use the link below to obtain access to this indicator
Super Trend 2 MACD pk singhalYou can automate complete strategies, and not just indicators using the TradingView free version. That’s right! explore 1000s of strategies from public library using free Tradingview and free APIBridge (paper trading). We will demonstrate this using SuperTrend strategy (not SuperTrend indicator).
Please help to make Larry Williams' volatility breakthrough.Hello Traders!
I'm going to backtest Larry Williams' volatility breakthrough strategy.
However, contrary to my expectation, orders at certain bars are made the next day.
Is there anything I missed at my pine script code?
Please give me any tiny tips.
Thank you!!
RSI-VWAP Indicator %█ OVERALL
Simple and effective script that, as you already know, uses vwap as source of the rsi, and with good results as long as the market has no long-term downtrend.
RsiVwap = rsi (vwap (close), Length)
The default settings are for BTC in a 30 minute time frame. For other pairs and time frames you just have to play with the settings.
█ FEATURES
• The option to start trading from a certain date has been added.
• To make the profit more progressive, a percentage of your equity is used for entries and a percentage of your position is used for closings.
• The option to trade in Spot mode has been added, since, for the TradingView backtest, the money is infinite and if you do not limit it somehow,
it would offer you much better profits than the live trading.
QuantityOnLong = Spot ? (EquityPercent / 100) * ((strategy.equity / close) - strategy.position_size) : (EquityPercent / 100) * (strategy.equity / close)
• The option to stop the system when the drawdown exceeds the fixed limit has been added.
Drawdown, as you already know, is a very important measure of risk in trading systems.
The maximum drawdown will tell us what the maximum loss of a trading system has been during a period. This maximum loss is determined by:
strategy.risk.max_drawdown(Risk, strategy.percent_of_equity)
• Leverage plotted on labels added.
█ ALERTS
To enjoy the benefits of automatic trading, TradingView alerts can be used as direct buy-sell orders on spot, or long-close orders with leverage.
Currently there are Chrome extensions that act as a bridge between TradingView and your Exchange or Broker.
This is an example of syntax for this type of extensions. Copy and paste a message like this into the alert window:
{{strategy.order.action}} @ {{strategy.order.price}} | e = {{exchange}} a = account s = {{ticker}} b = {{strategy.order.action}} {{strategy.order.alert_message}}
█ NOTE
Certain Risks of Live Algorithmic Trading You Should Know:
• Backtesting cannot assure actual results.
• The relevant market might fail or behave unexpectedly.
• Your broker may experience failures in its infrastructure, fail to execute your orders in a correct or timely fashion or reject your orders.
• The system you use for generating trading orders, communicating those orders to your broker, and receiving queries and trading results from your broker may fail.
• Time lag at various point in live trading might cause unexpected behavior.
• The systems of third parties in addition to those of the provider from which we obtain various services, your broker, and the applicable securities market may fail or malfunction.
█ THANKS
Thanks to TradingView, its Pine code, its community and especially those Pine wizards who post their ideas that helps us to learn.
If the world is heading toward a equitable new world economic order, let's get rich first ...
Happy trading!
KAMA Strategy - Kaufman's Adaptive Moving AverageThis strategy combines Kaufman's Adaptive Moving Average for entry with optional KAMA, PSAR, and Trailing ATR stops for exits.
Kaufman's Adaptive Moving Average is, in my opinion, a gem among the plethora of indicators. It is underrated considering it offers a solution that intuitively makes a lot of sense. When I first read about it, it was a real 'aha!' moment. Look at the top, pink line. Notice how during trending times it follows the trend quickly and closely, but during choppy, non-trending periods, the KAMA stays absolutely flat? Interesting! To trade with it, we simply follow the direction the KAMA is pointing. Is it up? Go long. Is it down? Go short. Is it flat? Hold on.
How does it manage to quickly follow real trends like a fast EMA but ignore choppy conditions that would whipsaw a fast EMA back and forth? It analyses whether recent price moves are significant relative to recent noise and then adapts the length of the EMA window accordingly. If price movement is big compared to the recent noise, the EMA window gets smaller. If price movement is relatively small or average compared to the recent noise, the EMA window gets bigger. In practice it means:
The KAMA would be flat if a 20 point upwards move occurred during a period that has had, on average, regular 20 point moves BUT
the KAMA would point up if a 20 point move occurred during a period that has, on average, had moves of only around 5 points.
In other words, it's a slow EMA during choppy flat / quiet flat periods, and a fast EMA as soon as significant volatility occurs. Perfect!
-----
The Strategy
The strategy is more than just a KAMA indicator. It contains:
KAMA exit (optional)
ATR trailing stop loss exit (optional)
PSAR stop loss exit (optional)
KAMA filter for entry and exits
All features are adjustable in the strategy settings
The Technical Details:
Check out the strategy's 'Inputs' panel. The buy and sell signals are based on the 'KAMA 1' there.
KAMA 1: Length -- 14 is the default. This is the length of the window the KAMA looks back over. In this instance, it c
KAMA 1: Fast KAMA Length -- 2 is the default. This is the tightest the EMA length is allowed to get. It will tend towards this length when volatility is high.
KAMA 1: Slow KAMA Length -- 20 is the default. This is the biggest the EMA length is allowed to get. It will tend towards this length when volatility is low.
KAMA Filter
The strategy buys when the KAMA begins to point up and sells when the KAMA points down. Generally, the KAMA is very good at filtering out the noise itself - it will go flat during noisy/choppy periods. But to add another layer of safety, its author, Perry Kaufman, proposed a KAMA filter. It works by taking the standard deviation of returns over the length of the the 'KAMA 1: Length' I mentioned above and multiplying it by an 'Entry Filter' (1 by default) and 'Exit Filter' (0.5 by default). The entry condition to go long is that the KAMA is pointing up and and it moved up more than 1 x St. Dev. of Returns. The exit condition is when the KAMA is pointing down and it moved down by more than 0.5 x St. Dev. of Returns.
Thanks
Thanks to ChuckBanger, cheatcountry, millerrh, and racer8 for parts of the code. I was able to build upon their good work.
-----
I hope this strategy is helpful to you.
Do you have any thoughts, ideas, or questions? Let me know in the comments or send me a message! I'd be glad to help you out.
If you need an indicator or strategy to be built or customised for you, let me know! I'll be glad to help and it'll probably be cheaper than you think!
MACD 50x Leveraged Strategy Real Equity Simulation Hello, I wrote this script to merge the two scripts I shared before.
The aim here is to see the real value of the state of the capital as a result of leveraged transactions and to combine both long and short directions.
Scripts :
MACD Long 50x Leverage Strategy :
MACD Short 50x Leverage Strategy :
The parameters have not changed so they are the same as the previous two scripts:
Adding margin: Forbidden or not specified. (Add Margin : No)
Position Size : %1 (0.01) (For each trade)
Stop-Loss : %2 (For each trade)
Long : Crossover(delta,0) (Standard MACD)
Long Exit : Long Stop Level or Short Entry
(In the case of Long Stop, all trades are closed and no positions are opened in short direction.)
Short : Crossunder(delta,0) (Standard MACD)
Short Exit : Short Stop or Long Entry
(In the case of Short Stop, all trades are closed and no positions are opened in the long direction.)
NOTE :
This is a simulation made using standard parameters, showing the state of the balance in very simple rules with leveraged transactions only.
The nice thing here is the direct observation of the results by making modifications on the strategy parameters.
Regards.
Built-in Kelly ratio for dynamic position sizingThis is the defaut keltners channel strategy with a few additions.
The main purpose is to show how we include the Kelly ratio into our scripts for dynamic position sizing based on the performance of the strategy on a per trade basis.
We've also included the usual take-profit and stop-loss parameters in the event you want to play a little :)
We hope this helps you advance your personal system.
Happy Trading!
MACD Price Projected Bands [MPPB] Strategy for NIFTY / BTC 2 minMACD Price Projected Bands is an intraday NON REPAINTING Strategy to be used over BTCUSD and NIFTY on 2mins charts for optimum results!!
How the Strategy works
The strategy uses MACD with standard configuration as its main component.
The adaptive Bands are calculated over the MACD lookback, and MACD crosses of the adaptive bands are projected over the Price for creating a decision logic
A cyclic Trend Filter is used to calculate the Optimum Entry and Exit Points for the Strategy,
Levels are also plotted over the price projected bands for better visualisation of the targets!
What is used !
Macd_config : { fast:12 , slow:26 , signal:9 }
Lookback Length : 55
The Strategy has Provision for Alerts
You get Two signals
1. MPPBS Buy Signal
2. MPPBS Sell Signal
How the Visual Target System Works and How to trade Using this Strategy
An Adaptive Projected Band is constructed using MACD for traders to get Visual inputs regarding targets!!
The Trading Methodologies are in below Charts
For Short Trades
For Long Trades
Strategy Configurations for Backtest
For Englishmen!
The Backtesting Rules in the Strategy calculates only when order gets filled, the basic pyramiding in the strategy is set to 1, i.e The maximum number of entries allowed in the same direction is set to 1,
Also we trade only 1 quantity of the security with initial capital of 100000USD, and The commission type used in the strategy is set to 0.05 USD that means we pay 0.05USD as commissions in every trade!
For Coders!
{
calc_on_order_fills=true,
pyramiding=1,
default_qty_type=strategy.fixed,
default_qty_value=1,
initial_capital=100000,
currency=currency.USD,
commission_type= strategy.commission.cash_per_order,
commission_value = 0.05
}
How can you get access
Only do private message to me, donot use comment box for requesting access!
LAGging span leaves Bollinger Bands strategyAbstract
This script points out the positions a lagging span leaves a Bollinger Band.
This script does not plot a lagging span but moves the Bollinger Band forward.
You can find profit opportunities by combining this script and risk management.
Introduction
Bollinger Bands is a popular indicator.
It contains a moving average, an upper band and a lower band.
The moving average can indicate trend, the upper band and the lower band can indicate if the price is far away from the moving average.
However, in trading markets, anything can happen.
Both continuation and reversal are possible when the price touches the moving average, the upper band or the lower band.
Therefore, many traders adjust the parameters of the Bollinder Band or add other indicators to improve their trading strategies.
@Daveatt et. al. provided an idea that uses a lagging span.
A lagging span is a line chart. It displays the reference price but in earlier time.
For example, if the offset of a lagging span is 26 days, the value of the lagging span on 29 days ago is the reference price 3 days ago.
A lagging span is a part of Ichimoku Cloud.
It can compare the price to the earlier price and the values of indicators in the past.
To compare the price to the values of indicators in the past, we can also shift indicators forward instead of adding a lagging span into the chart.
This script uses shift-the-indicators-forward method.
In other words, this script plots the Bollinger Band forward so that the price can be compared to the values of the Bollinger Band in the past.
Computing and Adjusting
(1) Compute Moving Average
(2) Compute Standard Derivation
(3) Upper Band = Moving Average + Standard Derivation * Multi
(4) Lower Band = Moving Average - Standard Derivation * Multi
(5) Shift the Bollinger Band forward according to the offset parameter.
(6) Mark the points the price leaves the shifted Bollinger Band
(7) Compute the most possible loss and profit before the next opposite signal.
Parameters
source : the data for computing the bollinger band. can be open, high, low, close or their combination.
length : how many days are calculated by the bollinger band
mult : the distance from the moving average to the upper band and the distance from the moving average to the upper band is equal to ( mult * standard derivation ) .
x_offset : the offset of the lagging span
Conclusion
This script can find signals for potential breakout or trend continuation.
If you want to use this signal well, you need to know when to cut loss and protect the profit.
Reference
@Daveatt , Bollinger bands/Lagging span cross , BGyrPgOA , Tradingview 2019
How to trade with Bollinger Bands
How to use Ichimoku Cloud
How to trade with a line chart
BITCOIN AUTO TRADING STRATEGYBITCOIN AUTO TRADING STRATEGY
This strategy shows buy and sell signal. Designed and optimized only for Bitcoin. You can use it spot or futures markets and 30 minutes time frame. Indicator gives trade points when optimized sma trending but filtered choppinnes index. Profit factor over 3 for all time backtest period. Care using when you set leverage. I recommend maximum 5x leverage for auto trading.
Profitable trade count 119
Lost trade count 115
Profit factor 3
For access message me or go to my web link on my profile.
[astropark] Trend Skywalker V1 [strategy]Dear Followers,
today another awesome Swing and Scalping Trading Strategy indicator: Trend Skywalker !
It shows a trend cloud that reacts very fast to price action, so it's perfect for trending markets: it helps a lot to find out
when a trend is going to end and a new is going to start
when to enter again within a trending market
where to put your stoploss
In this example below you can see the three points above:
In fact in a trending market it will highlight that:
price consolidation within the could is a trend weakening signal , so you can easily spot when a trend is going to end and a new is going to start
bullish/bearish trend cloud retests are nice opportunity to re-enter within a trending market, especially if cloud is thick
where to put your stoploss ( below the cloud and/or recent low in a buy scenario , above the cloud and/or recent high in a sell scenario )
This strategy/indicator has the following options:
change analysis window (the lower, the more reactive; the higher, the less reactive)
enable/disable signals on chart
enable/disable "more confirmations" signals filter
enable/disable bars and background coloring based on trend
enable/disable an automatic Trailing Stop strategy option (Automatic Stops)
enable/disable a peak profit tracker (the max percentage profit labels)
enable/disable highlights of trend cloud retests
enable/disable highlights of trend cloud price breakouts
Here below some examples how the indicator works on many markets and timeframe.
ETH/USD 4h
EUR/USD 15m
LTC/BTC 1h
This strategy only trigger 1 buy (where to start a long trade) or 1 sell (for short trade).
Keep in mind that proper risk management and money management strategies are very important to manage your trades (DM me if you need any clarification on these points).
This script will let you backtest the strategy performance over the backtesting period you set in input (it may be a lower period, depending on tradingview candles limitation related to your account).
The one for setting alarms can be found by searching for the astropark's "Trend Skywalker" and then choosing the indicator with "alarms" suffix in the name.
Strategy results are calculated on the time window from February 2018 to now, so about 3 years, using 10000$ as initial capital and working at 1x leverage (so no leverage at all! If you like to use leverage, be sure to use a safe option, like 2x or 3x at most in order to have liquidation price very far).
This is not the "Holy Grail", so use proper money and risk management strategies.
This is a premium indicator , so send me a private message in order to get access to this script.
MA Candles Supertrend StrategySimple strategy which is derived by below method:
1. Calculate moving average of High, Low, Open and Close and make candles of them.
2. Derive supertrend on the moving average candles.
3. Generate buy and sell signals based on supertrend direction combined with higher timeframe high-low condition
JetzGiantz StrategyThe algorithm for this strategy was provided by JetzGiantz.
It creates buy and sell signals based on the close and open prices of the previous 3 bars, and compares them to the lowest low, or highest high, between the last 3 and 50 bars.
You can select the month and year you wish to backtest.
You can enter the SL and TP values.
There are no other inputs.