EMA Velocity Volatility Clamp (v1)A strategy based on the rate of price change using EMA. Configured for the 5M Solana. BINANCE:SOLUSDT Strategia Pine Script®di Paran03d3
Hash Supertrend [Hash Capital Research]Hash Supertrend Strategy by Hash Capital Research Overview Hash Supertrend is a professional-grade trend-following strategy that combines the proven Supertrend indicator with institutional visual design and flexible time filtering. The strategy uses ATR-based volatility bands to identify trend direction and executes position reversals when the trend flips.This implementation features a distinctive fluorescent color system with customizable glow effects, making trend changes immediately visible while maintaining the clean, professional aesthetic expected in quantitative trading environments. Entry Signals: Long Entry: Price crosses above the Supertrend line (trend flips bullish) Short Entry: Price crosses below the Supertrend line (trend flips bearish) Controls the lookback period for volatility calculation Lower values (7-10): More sensitive to price changes, generates more signals Higher values (12-14): Smoother response, fewer signals but potentially delayed entries Recommended range: 7-14 depending on market volatility Factor (Default: 3.0) Restricts trading to specific hours Useful for avoiding low-liquidity sessions, overnight gaps, or known choppy periods When disabled, strategy trades 24/7 Start Hour (Default: 9) & Start Minute (Default: 30) Define when the trading session begins Uses exchange timezone in 24-hour format Example: 9:30 = 9:30 AM End Hour (Default: 16) & End Minute (Default: 0) Controls the vibrancy of the fluorescent color system 1-3: Subtle, muted colors 4-6: Balanced, moderate saturation 7-10: Bright, highly saturated fluorescent appearance Affects both the Supertrend line and trend zones Glow Effect (Default: On) Adds luminous halo around the Supertrend line Creates a multi-layered visual with depth Particularly effective during strong trends Glow Intensity (Default: 5.0) Displays tiny fluorescent dots at entry points Green dot below bar: Long entry Red dot above bar: Short entry Provides clear visual confirmation of executed trades Show Trend Zone (Default: On) Strong trending markets (2020-style bull runs, sustained bear markets) Markets with clear directional bias Instruments with consistent volatility patterns Timeframes: 15m to Daily (optimal on 1H-4H) Challenging Conditions: Choppy, range-bound markets Low volatility consolidation periods Highly news-driven instruments with frequent gaps Very low timeframes (1m-5m) prone to noise Recommended AssetsCryptocurrency: Strategia Pine Script®di Hash_CapitalAggiornato 55
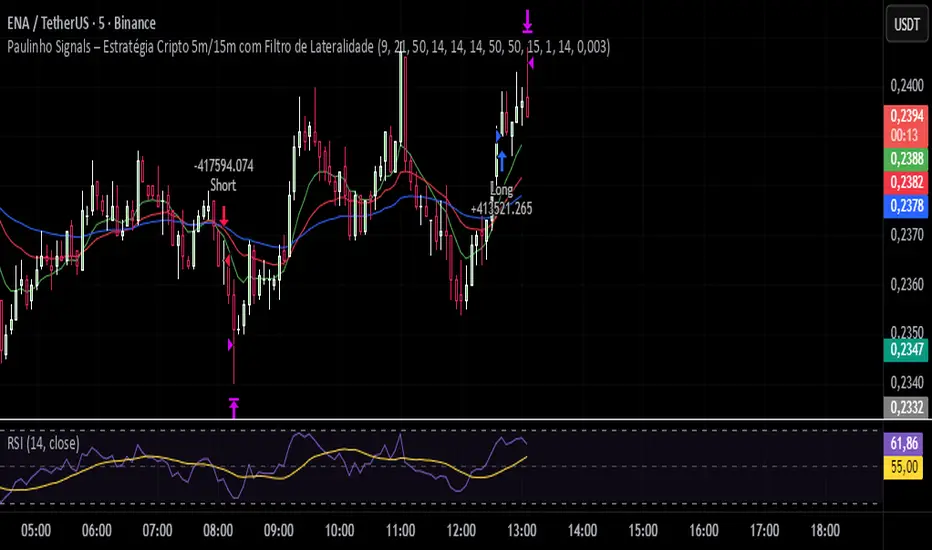
Paulinho Signals – Cripto 5m/15m com Filtro de LateralidadeThis script is an automated Pine Script v6 strategy designed for short-term cryptocurrency trading, especially on 5-minute and 15-minute timeframes. It combines moving average crossovers, trend strength (ADX), volatility (ATR), and candlestick patterns to generate buy and sell signals with a fixed risk/reward management system. How to Use: - Apply to cryptocurrency charts on 5m or 15m timeframes. - Adjust parameters to fit your preferences (EMA, RSI, ADX, ATR). - Use for backtesting or as a decision-support tool. Disclaimer: This script is for educational purposes only and does not constitute financial advice. Always test on demo accounts before applying to live trading. Strategia Pine Script®di Pqpaulao14
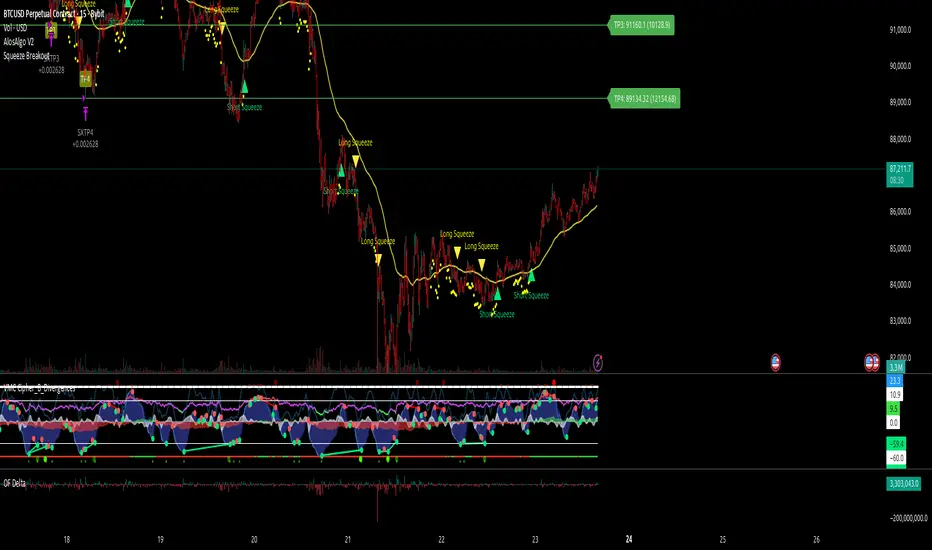
AlosAlgo V2 (BETA)— V2 BETA — V2 – 2025-11-21 (Update) • Rebuilt the core signal engine to remove repainting – higher-timeframe Heikin Ashi / Renko now use confirmed bars only for more stable signals & alerts. • Added Trend Filter MA so longs are only taken above the MA and shorts only below (optional). • Added MACD momentum filter and Price Action filter (Higher Low for longs, Lower High for shorts) to cut a lot of chop. • Introduced a loss-streak “circuit breaker” – after X consecutive losing trades the strategy pauses for a set number of bars. • New TP/SL engine with 2 modes: ATR-based or Fixed % moves, with 4 staged TPs plus an optional runner and break-even SL after TP2. • Cleaned up TP/SL lines & labels so levels are fixed per trade and easier to read. • General refactor for more realistic backtests, better live behaviour and easier parameter tuning compared to V1. ABOUT AlosAlgo V2 is a multi-timeframe trend + momentum strategy designed for BTC and other high-liquidity markets. It takes directional bias from a higher timeframe, then filters that bias with volatility, momentum and simple price-action structure before it ever opens a trade. Purely rule-based, no AI / Bayesian / ML. Core idea – Use higher-timeframe structure for direction. – Only trade when trend, momentum and basic price action agree. – Manage exits with multiple TPs, an optional runner and a hard SL so risk is defined from the start. Setups Two main engines: • Open/Close – Higher-timeframe Heikin Ashi body direction (close vs open) as the core trend signal. • Renko – ATR-based Renko feed with EMA cross (fast vs slow) as the core trend signal. Classic sideways filters (ATR + RSI) can be layered on top if you want to only trade in trending or ranging conditions. Filters added in V2 • Trend Filter MA – Longs only above the MA, shorts only below (length configurable). • Momentum Filter – Optional MACD filter; only takes longs when MACD is bullish and shorts when MACD is bearish. • Price Action Filter – Optional HL/LH logic using pivots: longs after a Higher Low, shorts after a Lower High. • Loss-Streak Circuit Breaker – After N losing trades in a row, the strategy pauses entries for a set number of bars to avoid bad regimes / tilt. Risk & exits Two TP/SL modes: • ATR mode – SL and TP1–TP4 based on ATR at entry (stopFactor / profitFactor). • Fixed % mode – SL and TP1–TP4 defined as % moves from entry. On entry the strategy: • Opens a single position. • Places 4 staged TPs (TP1–TP4) with user-defined % sizing. • Optionally leaves a “runner” managed only by SL and trend changes. • Can move SL to break-even automatically after TP2 (toggle). All TP/SL levels are locked at entry and drawn on the chart with labels so you can see exactly what the trade is trying to do. Non-repainting behaviour V2 is refactored to avoid the repainting behaviour that V1 used. Higher-timeframe and Renko data are taken from confirmed bars only, and entries are based on state (e.g. > / <) instead of repaint-prone crosses. Backtests are much closer to what you’ll see live, and alerts line up with executed trades more reliably. How to use (suggested defaults) • Setup: Open/Close • TPSType: Fixed % • Trend Filter: ON • Momentum Filter: ON • Price Action Filter: ON • Sideways Filter: No Filtering Then tweak TP/SL distances and filters per asset + timeframe, and forward-test before sizing up. Disclaimer This is not financial advice, not a guarantee of profit and not a “set and forget” money printer. Always forward-test, paper trade and tune risk before using real capital or automation. Markets change – this is a tool, not a promise.Strategia Pine Script®di Alos_Arc14
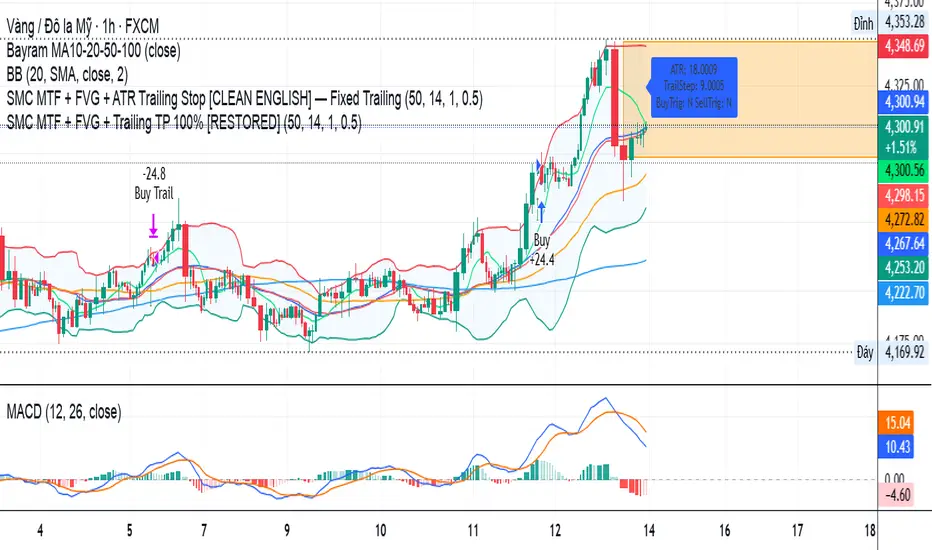
SMC Trend Filter Strategy (EMA50/EMA200 + FVG)Overview This strategy implements a multi-timeframe Smart Money Concept (SMC) trading system designed for intraday and swing trading. It combines a Daily trend filter, Break of Structure (BOS) detection, Order Block (OB) zones, Fair Value Gap (FVG) confirmation, and an ATR-based trailing stop system to achieve structured and rule-based entries. The strategy is fully automated for backtesting and allows users to evaluate SMC concepts without repainting or discretionary interpretation. - Core Components 1. Higher-Timeframe Trend Filter (Daily EMA50/EMA200) The strategy retrieves D1 data and determines market direction using EMA50 and EMA200: Uptrend → EMA50 > EMA200 Downtrend → EMA50 < EMA200 Trades are only taken in the direction of the Daily trend to avoid counter-trend setups. 2. Market Structure & Break of Structure (BOS) The strategy identifies swing highs/lows and detects when price breaks beyond them: Bullish BOS: price closes above previous swing high Bearish BOS: price closes below previous swing low This forms the foundation of SMC market structure recognition. 3. Order Block Zone (OB) Upon detecting a BOS, the strategy marks the previous candle as a potential Order Block: For bullish BOS → OB = previous candle’s high/low For bearish BOS → OB = previous candle’s high/low The OB zone is visualized using a semi-transparent box extended forwardStrategia Pine Script®di SMCFVLAggiornato 1115
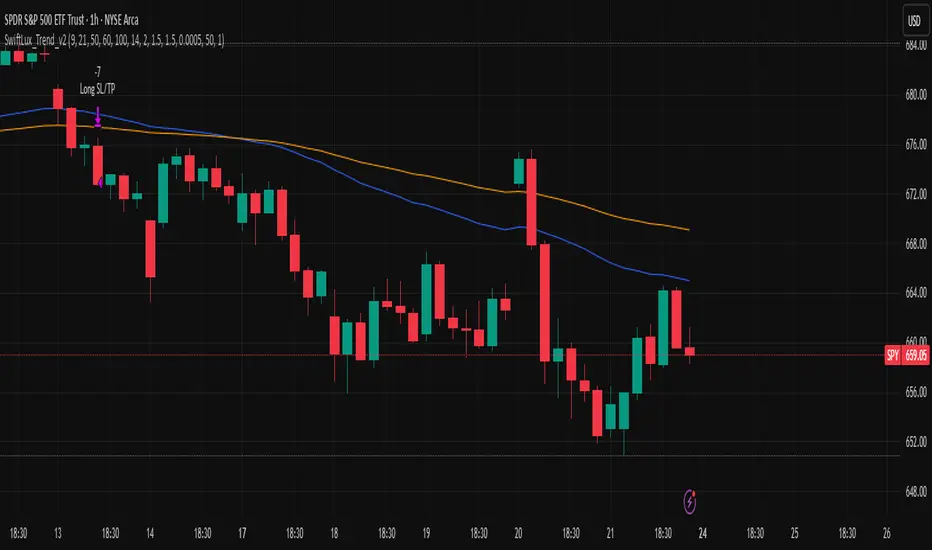
Aquas TrendIt’s a trend-following crossover system with: A local fast/slow EMA cross for timing entries A higher-timeframe EMA filter to only trade in the dominant trend An ATR-based volatility filter so it only trades when the market is moving ATR-based stop loss and take profit with fixed RR It tries to catch swings in the direction of the larger trend and ignore chop.Strategia Pine Script®di imtrader196810
Vital Wave 20-50Simplicity is almost always the most effective approach, and here I’m giving you a trend-following system that exploits the bullish bias of traditional markets and their trending nature, with very basic rules. Rules (long entries only) • Market entry: When the EMA 20 crosses above the EMA 50 (from below) • Main market exit: When the EMA 20 crosses below the EMA 50 (from above) • Fixed Stop Loss: Placed at the price level of the Lower Bollinger Band at the moment the trade is entered. In my strategy, the primary exit is when the EMA 20 crosses below the EMA 50. However, this crossover can sometimes take a while to occur, and in the meantime the price may have already dropped significantly. The Stop Loss based on the Lower Bollinger Band is designed to limit losses in case the market moves sharply against the position without giving the bearish crossover signal in time. Having two exit conditions makes the strategy much more robust in terms of risk management. Risk Management: • Initial capital: $10,000 • Position size: 10% of available capital per trade • Commissions: 0.1% on traded volume • Stop Loss: Based on the Lower Bollinger Band • Take Profit / Exit: When EMA 20 crosses below EMA 50 Recommended Markets: XAUUSD (OANDA) (Daily) Period: January 3, 1833 – November 23, 2025 Total Profit & Loss: +$6,030.62 USD (+57.57%) Maximum Drawdown: $541.53 USD (3.83%) Total Trades: 136 Winning Trades (Win Rate): 36.03% (49/136) Profit Factor: 2.483 XAUUSD (OANDA) (12-hour) Period: March 19, 2006 – November 23, 2025 Total Profit & Loss: +$1,209.56 USD (+11.89%) Maximum Drawdown: $384.58 USD (3.61%) Total Trades: 97 Winning Trades (Win Rate): 35.05% (34/97) Profit Factor: 1.676 XAUUSD (OANDA) (8-hour) Period: March 19, 2006 – November 23, 2025 Total Profit & Loss: +$1,179.36 USD (+11.81%) Maximum Drawdown: $246.88 USD (2.32%) Total Trades: 147 Winning Trades (Win Rate): 31.97% (47/147) Profit Factor: 1.626 Tesla (NASDAQ) (4-hour) Period: June 29, 2010 – November 23, 2025 Total Profit & Loss (Absolute): +$11,687.90 USD (+116.88%) Maximum Drawdown: $922.05 USD (6.50%) Total Trades: 68 Winning Trades (Win Rate): 39.71% (27/68) Profit Factor: 4.156 Tesla (NASDAQ) (3-hour) Total Profit & Loss: +$11,522.33 USD (+115.22%) Maximum Drawdown: $1,247.60 USD (8.80%) Total Trades: 114 Winning Trades: 33.33% (38/114) Profit Factor: 2.811 Additional Recommendations (These assets have shown good trending behavior with the same strategy across multiple timeframes): • NVDA (15 min, 30 min, 1h, 2h, 3h, 4h, 6h, 8h, 12h, Daily) • NFLX (1h, 2h, 3h, 4h, 6h, 8h, 12h, Daily) • MA (1h, 2h, 3h, 4h, 6h, 8h, 12h, Daily) • META (1h, 2h, 3h, 4h, 6h, 8h, 12h, Daily) • AAPL (1h, 2h, 3h, 4h, 6h, 8h, 12h, Daily) • SPY (12h, Daily) About the Code The user can modify: • EMA periods (20 and 50 by default) • Bollinger Bands length (20 periods) • Standard deviation (2.0) Visualization • EMA 20: Blue line • EMA 50: Red line • Green background when EMA20 > EMA50 (bullish trend) • Red background when EMA20 < EMA50 (bearish trend) Important Note: We can significantly increase the profit factor and overall profitability by risking a fixed percentage per trade instead of a fixed amount. This would prevent losses from fluctuating with changes in volatility. This could be implemented by reducing position size or adjusting leverage based on the volatility percentage required for each trade, but I’m not sure if this is fully possible in Pine Script. In my other script, “ Golden Cross 50/200 EMA ,” I go deeper into this topic and provide examples. I hope you enjoy this contribution. Best regards! Strategia Pine Script®di OldWave962255
EMA Color Flip Strategy ETH 30 minjust another experiment on ETH 30 min chart! Work in progress!Strategia Pine Script®di CoinCaveIdeas3
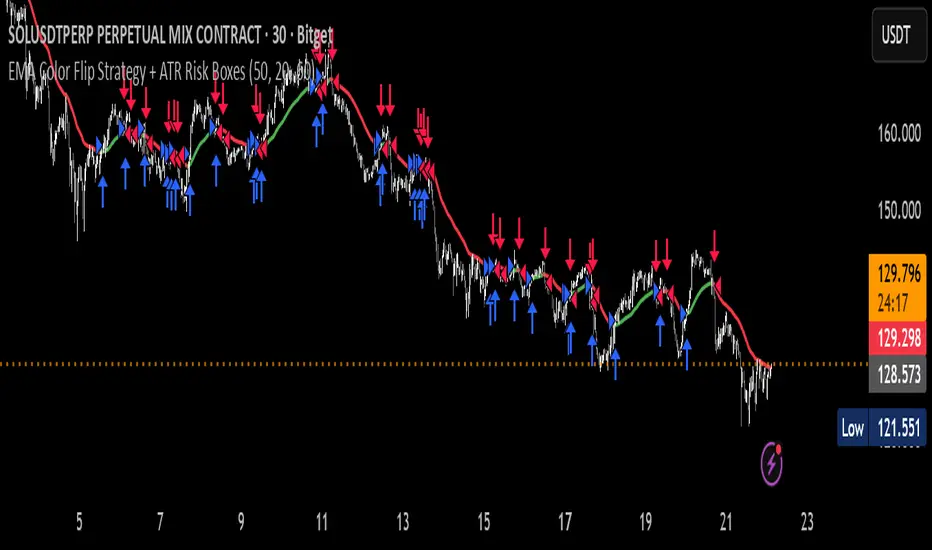
EMA Color Flip Strategy Experimenting on SOL 30 min chart, it seems good! Let me know what you think!Strategia Pine Script®di CoinCaveIdeas1
ATH대비 지정하락률에 도착 시 매수 - 장기홀딩 선물 전략(ATH Drawdown Re-Buy Long Only)본 스크립트는 과거 하락 데이터를 이용하여, 정해진 하락 %가 발생하는 경우 자기 자본의 정해진 %만큼을 진입하게 설계되어진 스트레티지입니다. 레버리지를 사용할 수 있으며 기본적으로 셋팅해둔 값이 내장되어있습니다.(자유롭게 바꿔서 쓰시면 됩니다.) 추가적으로 2번의 진입 외에도 다른 진입 기준, 진입 %를 설정하실 수 있으며 - ChatGPT에게 요청하면 수정해줄 것입니다. 실제 사용용도로는 KillSwitch 기능을 꺼주세요. 바 돋보기 기능을 켜주세요. ATH Drawdown Re-Buy Long Only 전략 설명 1. 전략 개요 ATH Drawdown Re-Buy Long Only 전략은 자산의 역대 최고가(ATH, All-Time High)를 기준으로 한 하락폭(드로우다운)을 활용하여, 특정 구간마다 단계적으로 롱 포지션을 구축하는 자동 재매수(Long Only) 전략입니다. 본 전략은 다음과 같은 목적을 가지고 설계되었습니다. 급격한 조정 구간에서 체계적인 분할 매수 및 레버리지 활용 ATH를 기준으로 한 명확한 진입 규칙 제공 실시간으로 평단가 레버리지 청산가 추정 계좌 MDD 수익률 등을 시각적으로 제공하여 리스크와 포지션 상태를 직관적으로 확인할 수 있도록 지원 ※ 본 전략은 교육·연구·백테스트 용도로 제공되며, 어떠한 형태의 투자 권유 또는 수익을 보장하지 않습니다. 2. 전략의 핵심 개념 2-1. ATH(역대 최고가) 기준 드로우다운 전략은 차트 상에서 항상 가장 높은 고가(High)를 ATH로 기록합니다. 새로운 고점이 형성될 때마다 ATH를 갱신하고, 해당 ATH를 기준으로 다음을 계산합니다. 현재 바의 저가(Low)가 ATH에서 몇 % 하락했는지 현재 바의 종가(Close)가 ATH에서 몇 % 하락했는지 그리고 사전에 설정한 두 개의 드로우다운 구간에서 매수를 수행합니다. 1차 진입 구간: ATH 대비 X% 하락 시 2차 진입 구간: ATH 대비 Y% 하락 시 각 구간은 ATH가 새로 갱신될 때마다 한 번씩만 작동하며, 새로운 ATH가 생성되면 다시 “1차 / 2차 진입 가능 상태”로 초기화됩니다. 2-2. 첫 포지션 100% / 300% 특수 규칙 이 전략의 중요한 특징은 **“첫 포지션 진입 시의 예외 규칙”**입니다. 전략이 현재 어떠한 포지션도 들고 있지 않은 상태에서 최초로 롱 포지션을 진입하는 시점(첫 포지션)에 대해: 기본적으로는 **자산의 100%**를 기준으로 포지션을 구축하지만, 만약 그 순간의 가격이 ATH 대비 설정값 이상(예: 약 –72.5% 이상 하락한 상황) 이라면 → 자산의 300% 규모로 첫 포지션을 진입하도록 설계되어 있습니다. 이 규칙은 다음과 같이 동작합니다. 첫 진입이 1차 드로우다운 구간에서 발생하든, 첫 진입이 2차 드로우다운 구간에서 발생하든, 현재 하락폭이 설정된 기준 이상(예: –72.5% 이상) 이라면 → “이 정도 하락이면 첫 진입부터 더 공격적으로 들어간다”는 의미로 300% 규모로 진입 그 이하의 하락폭이라면 → 첫 진입은 100% 규모로 제한 즉, 전략은 다음 두 가지 모드로 동작합니다. 일반적인 상황의 첫 진입: 자산의 100% 심각한 드로우다운 구간에서의 첫 진입: 자산의 300% 이 특수 규칙은 깊은 하락에서는 공격적으로, 평소에는 상대적으로 보수적으로 진입하도록 설계된 것입니다. 3. 전략 동작 구조 3-1. 매수 조건 차트 상 High 기준으로 ATH를 추적합니다. 각 바마다 해당 ATH에서의 하락률을 계산합니다. 사용자가 설정한 두 개의 드로우다운 구간(예시): 1차 구간: 예를 들어 ATH – 50% 2차 구간: 예를 들어 ATH – 72.5% 각 구간에 대해 다음과 같은 조건을 확인합니다. “이번 ATH 구간에서 아직 해당 구간 매수를 한 적이 없는 상태”이고, 현재 바의 저가(Low)가 해당 구간 가격 이하를 찍는 순간 → 해당 바에서 매수 조건 충족으로 간주 실제 주문은: 해당 구간 가격에 맞춰 롱 포지션 진입(리밋/시장가 기반 시뮬레이션) 으로 처리됩니다. 3-2. ATH 갱신과 진입 기회 리셋 차트 상에서 새로운 고점(High)이 기존 ATH를 넘어서는 순간, ATH가 갱신되고, 1차 / 2차 진입 여부를 나타내는 내부 플래그가 초기화됩니다. 이를 통해, 시장이 새로운 고점을 돌파해 나갈 때마다, 해당 구간에서 다시 한 번씩 1차·2차 드로우다운 진입 기회를 갖게 됩니다. 4. 포지션 사이징 및 레버리지 4-1. 계좌 자산(Equity) 기준 포지션 크기 결정 전략은 현재 계좌 자산을 다음과 같이 정의하여 사용합니다. 현재 자산 = 초기 자본 + 실현 손익 + 미실현 손익 각 진입 구간에서의 포지션 가치는 다음과 같이 결정됩니다. 1차 진입 구간: “자산의 몇 %를 사용할지”를 설정값으로 입력 설정된 퍼센트를 계좌 자산에 곱한 뒤, 다시 전략 내 레버리지 배수(Leverage) 를 곱하여 실제 포지션 가치를 계산 2차 진입 구간: 동일한 방식으로, 독립된 퍼센트 설정값을 사용 즉, 포지션 가치는 다음과 같이 계산됩니다. 포지션 가치 = 현재 자산 × (해당 구간 설정 % / 100) × 레버리지 배수 그리고 이를 해당 구간의 진입 가격으로 나누어 실제 수량(토큰 단위) 를 산출합니다. 4-2. 첫 포지션의 예외 처리 (100% / 300%) 첫 포지션에 대해서는 위의 일반적인 퍼센트 설정 대신, 다음과 같은 고정 비율이 사용됩니다. 기본: 자산의 100% 규모로 첫 포지션 진입 단, 진입 시점의 ATH 대비 하락률이 설정값 이상(예: –72.5% 이상) 일 경우 → 자산의 300% 규모로 첫 포지션 진입 이때 역시 다음 공식을 사용합니다. 포지션 가치 = 현재 자산 × (100% 또는 300%) × 레버리지 그리고 이를 가격으로 나누어 실제 진입 수량을 계산합니다. 이 규칙은: 첫 진입이 1차 구간이든 2차 구간이든 동일하게 적용되며, “충분히 깊은 하락 구간에서는 첫 진입부터 더 크게, 평소에는 비교적 보수적으로” 라는 운용 철학을 반영합니다. 4-3. 실레버리지(Real Leverage)의 추적 전략은 각 바 단위로 다음을 추적합니다. 바가 시작할 때의 기존 포지션 크기 해당 바에서 새로 진입한 수량 이를 바탕으로, 진입이 발생한 시점에 다음을 계산합니다. 실제 레버리지 = (포지션 가치 / 현재 자산) 그리고 차트 상에 예를 들어: Lev 2.53x 와 같은 형식의 레이블로 표시합니다. 이를 통해, 매수 시점마다 실제 계좌 레버리지가 어느 정도였는지를 직관적으로 확인할 수 있습니다. 5. 시각화 및 모니터링 요소 5-1. 차트 상 시각 요소 전략은 차트 위에 다음과 같은 정보를 직접 표시합니다. ATH 라인 High 기준으로 계산된 역대 최고가를 주황색 선으로 표시 평단가(평균 진입가) 라인 현재 보유 포지션이 있을 때, 해당 포지션의 평균 진입가를 노란색 선으로 표시 추정 청산가(고정형 청산가) 라인 포지션 수량이 변화하는 시점을 감지하여, 당시의 평단가와 실제 레버리지를 이용해 근사적인 청산가를 계산 이를 빨간색 선으로 차트에 고정 표시 포지션이 없거나 레버리지가 1배 이하인 경우에는 청산가 라인을 제거 매수 마커 및 레이블 1차/2차 매수 조건이 충족될 때마다 해당 지점에 매수 마커를 표시 "Buy XX% @ 가격", "Lev XXx" 형태의 라벨로 진입 비율과 당시 레버리지를 함께 시각화 레이블의 위치는 설정에서 선택 가능: 바 아래 (Below Bar) 바 위 (Above Bar) 실제 가격 위치 (At Price) 5-2. 우측 상단 정보 테이블 차트 우측 상단에는 현재 계좌·포지션 상태를 요약한 정보 테이블이 표시됩니다. 대표적으로 다음 항목들이 포함됩니다. Pos Qty (Token) 현재 보유 중인 포지션 수량(토큰 기준, 절대값 기준) Pos Value (USDT) 현재 포지션의 시장 가치 (수량 × 현재 가격) Leverage (Now) 현재 실레버리지 (포지션 가치 / 현재 자산) DD from ATH (%) 현재 가격 기준, 최근 ATH에서의 하락률(%) Avg Entry 현재 포지션의 평균 진입 가격 PnL (%) 현재 포지션 기준 미실현 손익률(%) Max DD (Equity %) 전략 전체 기간 동안 기록된 계좌 기준 최대 손실(MDD, Max Drawdown) Last Entry Price 가장 최근에 포지션을 추가로 진입한 직후의 평균 진입 가격 Last Entry Lev 위 “Last Entry Price” 시점에서의 실레버리지 Liq Price (Fixed) 위에서 설명한 고정형 추정 청산가 Return from Start (%) 전략 시작 시점(초기 자본) 대비 현재 계좌 자산의 총 수익률(%) 이 테이블을 통해 사용자는: 현재 계좌와 포지션의 상태 리스크 수준 누적 성과 를 직관적으로 파악할 수 있습니다. 6. 시간 필터 및 라벨 옵션 6-1. 전략 동작 기간 설정 전략은 옵션으로 특정 기간에만 전략을 동작시키는 시간 필터를 제공합니다. “Use Date Range” 옵션을 활성화하면: 시작 시각과 종료 시각을 지정하여 해당 구간에 한해서만 매매가 발생하도록 제한 옵션을 비활성화하면: 전략은 전체 차트 구간에서 자유롭게 동작 6-2. 진입 라벨 위치 설정 사용자는 매수/레버리지 라벨의 위치를 선택할 수 있습니다. 바 아래 (Below Bar) 바 위 (Above Bar) 실제 가격 위치 (At Price) 이를 통해 개인 취향 및 차트 가독성에 맞추어 시각화 방식을 유연하게 조정할 수 있습니다. 7. 활용 대상 및 사용 예시 본 전략은 다음과 같은 목적에 적합합니다. 현물 또는 선물 롱 포지션 기준 장기·스윙 관점 추매 전략 백테스트 “고점 대비 하락률”을 기준으로 한 규칙 기반 운용 아이디어 검증 레버리지 사용 시 계좌 레버리지·청산가·MDD를 동시에 모니터링하고자 하는 경우 특정 자산에 대해 “새로운 고점이 형성될 때마다 일정한 규칙으로 깊은 조정 구간에서만 분할 진입하고자 할 때” 실거래에 그대로 적용하기보다는, 전략 아이디어 검증 및 리스크 프로파일 분석, 자신의 성향에 맞는 파라미터 탐색 용도로 사용하는 것을 권장합니다. 8. 한계 및 유의사항 백테스트 결과는 미래 성과를 보장하지 않습니다. 과거 데이터에 기반한 시뮬레이션일 뿐이며, 실제 시장에서는 유동성 슬리피지 수수료 체계 강제청산 규칙 등 다양한 변수가 존재합니다. 청산가는 단순화된 공식에 따른 추정치입니다. 거래소별 실제 청산 규칙, 유지 증거금, 수수료, 펀딩비 등은 본 전략의 계산과 다를 수 있으며, 청산가 추정 라인은 참고용 지표일 뿐입니다. 레버리지 및 진입 비율 설정에 따라 손실 폭이 매우 커질 수 있습니다. 특히 **“첫 포지션 300% 진입”**과 같이 매우 공격적인 설정은 시장 급락 시 계좌 손실과 청산 리스크를 크게 증가시킬 수 있으므로 신중한 검토가 필요합니다. 실거래 연동 시에는 별도의 리스크 관리가 필수입니다. 개별 손절 기준 포지션 상한선 전체 포트폴리오 내 비중 관리 등 본 전략 외부에서 추가적인 안전장치가 필요합니다. 9. 결론 ATH Drawdown Re-Buy Long Only 전략은 단순한 “저가 매수”를 넘어서, ATH 기준으로 드로우다운을 구조적으로 활용하고, 첫 포지션에 대한 **특수 규칙(100% / 300%)**을 적용하며, 레버리지·청산가·MDD·수익률을 통합적으로 시각화함으로써, 하락 구간에서의 규칙 기반 롱 포지션 구축과 리스크 모니터링을 동시에 지원하는 전략입니다. 사용자는 본 전략을 통해: 자신의 시장 관점과 리스크 허용 범위에 맞는 드로우다운 구간 진입 비율 레버리지 설정 다양한 시나리오에 대한 백테스트와 분석 을 수행할 수 있습니다. 다시 한 번 강조하지만, 본 전략은 연구·학습·백테스트를 위한 도구이며, 실제 투자 판단과 책임은 전적으로 사용자 본인에게 있습니다. /ENG Version. This script is designed to use historical drawdown data and automatically enter positions when a predefined percentage drop from the all-time high occurs, using a predefined percentage of your account equity. You can use leverage, and default parameter values are provided out of the box (you can freely change them to suit your style). In addition to the two main entry levels, you can add more entry conditions and custom entry percentages – just ask ChatGPT to modify the script. For actual/live usage, please turn OFF the KillSwitch function and turn ON the Bar Magnifier feature. ATH Drawdown Re-Buy Long Only Strategy 1. Strategy Overview The ATH Drawdown Re-Buy Long Only strategy is an automatic re-buy (Long Only) system that builds long positions step-by-step at specific drawdown levels, based on the asset’s all-time high (ATH) and its subsequent drawdown. This strategy is designed with the following goals: Systematic scaled buying and leverage usage during sharp correction periods Clear, rule-based entry logic using drawdowns from ATH Real-time visualization of: Average entry price Leverage Estimated liquidation price Account MDD (Max Drawdown) Return / performance This allows traders to intuitively monitor both risk and position status. ※ This strategy is provided for educational, research, and backtesting purposes only. It does not constitute investment advice and does not guarantee any profits. 2. Core Concepts 2-1. Drawdown from ATH (All-Time High) On the chart, the strategy always tracks the highest high as the ATH. Whenever a new high is made, ATH is updated, and based on that ATH the following are calculated: How many percent the current bar’s Low is below the ATH How many percent the current bar’s Close is below the ATH Using these, the strategy executes buys at two predefined drawdown zones: 1st entry zone: When price drops X% from ATH 2nd entry zone: When price drops Y% from ATH Each zone is allowed to trigger only once per ATH cycle. When a new ATH is created, the “1st / 2nd entry possible” flags are reset, and new opportunities open up for that ATH leg. 2-2. Special Rule for the First Position (100% / 300%) A key feature of this strategy is the special rule for the very first position. When the strategy currently holds no position and is about to open the first long position: Under normal conditions, it builds the position using 100% of account equity. However, if at that moment the price has dropped by at least a predefined threshold from ATH (e.g. around –72.5% or more), → the strategy will open the first position using 300% of account equity. This rule works as follows: Whether the first entry happens at the 1st drawdown zone or at the 2nd drawdown zone, If the current drawdown from ATH is at or below the threshold (e.g. –72.5% or worse), → the strategy interprets this as “a sufficiently deep crash” and opens the initial position with 300% of equity. If the drawdown is less severe than the threshold, → the first entry is capped at 100% of equity. So the strategy has two modes for the first entry: Normal market conditions: 100% of equity Deep drawdown conditions: 300% of equity This special rule is intended to be aggressive in extremely deep crashes while staying more conservative in normal corrections. 3. Strategy Logic & Execution 3-1. Entry Conditions The strategy tracks the ATH using the High price. For each bar, it calculates the drawdown from ATH. The user defines two drawdown zones, for example: 1st zone: ATH – 50% 2nd zone: ATH – 72.5% For each zone, the strategy checks: If no buy has been executed yet for that zone in the current ATH leg, and If the current bar’s Low touches or falls below that zone’s price level, → That bar is considered to have triggered a buy condition. Order simulation: The strategy simulates entering a long position at that zone’s price level (using a limit/market-like approximation for backtesting). 3-2. ATH Reset & Entry Opportunity Reset When a new High goes above the previous ATH: The ATH is updated to this new high. Internal flags that track whether the 1st and 2nd entries have been used are reset. This means: Each time the market makes a new ATH, The strategy once again has a fresh opportunity to execute 1st and 2nd drawdown entries for that new ATH leg. 4. Position Sizing & Leverage 4-1. Position Size Based on Account Equity The strategy defines current equity as: Current Equity = Initial Capital + Realized PnL + Unrealized PnL For each entry zone, the position value is calculated as follows: The user inputs: “What % of equity to use at this zone” The strategy: Multiplies current equity by that percentage Then multiplies by the strategy’s leverage factor Thus: Position Value = Current Equity × (Zone % / 100) × Leverage Finally, this position value is divided by the entry price to determine the actual position size in tokens. 4-2. Exception for the First Position (100% / 300%) For the very first position (when there is no open position), the strategy does not use the zone % parameters. Instead, it uses fixed ratios: Default: Enter the first position with 100% of equity. If the drawdown from ATH at that moment is greater than or equal to a predefined threshold (e.g. –72.5% or more) → Enter the first position with 300% of equity. The position value is computed as: Position Value = Current Equity × (100% or 300%) × Leverage Then it is divided by the entry price to obtain the token quantity. This rule: Applies regardless of whether the first entry occurs at the 1st zone or 2nd zone. Embeds the philosophy: “In very deep crashes, go much larger on the first entry; otherwise, stay more conservative.” 4-3. Tracking Real Leverage On each bar, the strategy tracks: The existing position size at the start of the bar The newly added size (if any) on that bar When a new entry occurs, it calculates the real leverage at that moment: Real Leverage = (Position Value / Current Equity) This is then displayed on the chart as a label, for example: Lev 2.53x This makes it easy to see the actual leverage level at each entry point. 5. Visualization & Monitoring 5-1. On-Chart Visual Elements The strategy plots the following directly on the chart: ATH Line The all-time high (based on High) is plotted as an orange line. Average Entry Price Line When a position is open, the average entry price of that position is plotted as a yellow line. Estimated Liquidation Price (Fixed) Line The strategy detects when the position size changes. At each size change, it uses the current average entry price and real leverage to compute an approximate liquidation price. This “fixed liquidation price” is then plotted as a red line on the chart. If there is no position, or if leverage is 1x or lower, the liquidation line is removed. Entry Markers & Labels When 1st/2nd entry conditions are met, the strategy: Marks the entry point on the chart. Displays labels such as "Buy XX% @ Price" and "Lev XXx", showing both entry percentage and real leverage at that time. The label placement is configurable: Below Bar Above Bar At Price 5-2. Information Table (Top-Right Panel) In the top-right corner of the chart, the strategy displays a summary table of the current account and position status. It typically includes: Pos Qty (Token) Absolute size of the current position (in tokens) Pos Value (USDT) Market value of the current position (qty × current price) Leverage (Now) Current real leverage (position value / current equity) DD from ATH (%) Current drawdown (%) from the latest ATH, based on current price Avg Entry Average entry price of the current position PnL (%) Unrealized profit/loss (%) of the current position Max DD (Equity %) The maximum equity drawdown (MDD) recorded over the entire backtest period Last Entry Price Average entry price immediately after the most recent add-on entry Last Entry Lev Real leverage at the time of the most recent entry Liq Price (Fixed) The fixed estimated liquidation price described above Return from Start (%) Total return (%) of equity compared to the initial capital Through this table, users can quickly grasp: Current account and position status Current risk level Cumulative performance 6. Time Filters & Label Options 6-1. Strategy Date Range Filter The strategy provides an option to restrict trading to a specific time range. When “Use Date Range” is enabled: You can specify start and end timestamps. The strategy will only execute trades within that range. When this option is disabled: The strategy operates over the entire chart history. 6-2. Entry Label Placement Users can customize where entry/leverage labels are drawn: Below Bar (Below Bar) Above Bar (Above Bar) At the actual price level (At Price) This allows you to adjust visualization according to personal preference and chart readability. 7. Use Cases & Applications This strategy is suitable for the following purposes: Long-term / swing-style re-buy strategies for spot or futures long positions Testing rule-based strategies that rely on “drawdown from ATH” as a main signal Monitoring account leverage, liquidation price, and MDD when using leverage Handling situations where, for a given asset: “Every time a new ATH is formed, you want to wait for deep corrections and enter only at specific drawdown zones” It is generally recommended to use this strategy not as a direct plug-and-play live system, but as a tool for: Strategy idea validation Risk profile analysis Parameter exploration to match your personal risk tolerance and style 8. Limitations & Warnings Backtest results do not guarantee future performance. They are based on historical data only. In live markets, additional factors exist: Liquidity Slippage Fee structures Exchange-specific liquidation rules Funding fees, etc. The liquidation price is only an approximate estimate, derived from a simplified formula. Actual liquidation rules, maintenance margin requirements, fees, and other details differ by exchange. The liquidation line should be treated as a reference indicator, not an exact guarantee. Depending on the configured leverage and entry percentages, losses can be very large. In particular, extremely aggressive settings such as “first position 300% of equity” can greatly increase the risk of large account drawdowns and liquidation during sharp market crashes. Use such settings with extreme caution. For live trading, additional risk management is essential: Your own stop-loss rules Maximum position size limits Portfolio-level exposure controls And other external safety mechanisms beyond this strategy 9. Conclusion The ATH Drawdown Re-Buy Long Only strategy goes beyond simple “buy the dip” logic. It: Systematically utilizes drawdowns from ATH as a structural signal Applies a special first-position rule (100% / 300%) Integrates visualization of leverage, liquidation price, MDD, and returns All of this supports rule-based long position building in drawdown phases and comprehensive risk monitoring. With this strategy, users can: Explore different: Drawdown zones Entry percentages Leverage levels Run various backtests and scenario analyses Better understand the risk/return profile that fits their own market view and risk tolerance Once again, this strategy is intended for research, learning, and backtesting only. All real trading decisions and their consequences are solely the responsibility of the user.Strategia Pine Script®di White_light_Aggiornato 4437
SMC MTF + FVG + Trailing TP 100% [FIXED]Component Description Entry Timeframe: H1 Trend Filter: D1 (EMA50 vs EMA200) Trend Filter Only enter BUY orders if EMA50 > EMA200 on D1 (uptrend) Only enter SELL orders if EMA50 < EMA200 (downtrend) Break of Structure (BOS) Identify the previous swing high/low breakout point Order Block (OB) The candle area before BOS is marked with an orange box Fair Value Gap (FVG) Check for the presence of a price gap to confirm Entry Trailing TP Trigger trailing after reaching the desired R (in pips or ATR)Strategia Pine Script®di SMCFVLAggiornato 555
Best strategy for scalpingThis is a next-generation Machine Learning–powered trading strategy designed for high-accuracy intraday and swing trading. It combines adaptive trend filters, probability-weighted entries, and dynamic SL/TP logic to deliver consistent, noise-free signals. No repainting. Customizable risk settings. Built for serious traders who want stable performance with low drawdown. Invite-only access only.Strategia Pine Script®di gongutri2822
Mirror Blocks: StrategyMirror Blocks is an educational structural-wave model built around a unique concept: the interaction of mirrored weighted moving averages (“blocks”) that reflect shifts in market structure as price transitions between layered symmetry zones. Rather than attempting to “predict” markets, the Mirror Blocks framework visualizes how price behaves when it expands away from, contracts toward, or flips across stacked WMA structures. These mirrored layers form a wave-like block system that highlights transitional zones in a clean, mechanical way. This strategy version allows you to study how these structural transitions behave in different environments and on different timeframes. The goal is understanding wave structure, not generating signals. How It Works Mirror Blocks builds three mirrored layers: Top Block (Structural High Symmetry) Base Block (Neutral Wave) Bottom Block (Structural Low Symmetry) The relative position of these blocks — and how price interacts with them — helps visualize: Compression and expansion Reversal zones Wave stability Momentum transitions Structure flips A structure is considered bullish-stack aligned when: Top > Base > Bottom and bearish-stack aligned when: Bottom > Base > Top These formations create the core of the Mirror Blocks wave engine. What the Strategy Version Adds This version includes: Long Only, Short Only, or Long & Short modes Adjustable symmetry distance (Mirror Distance) Configurable WMA smoothing length Optional trend filter using fast/slow MA comparison ENTER / EXIT / LONG / SHORT labels for structural transitions Fixed stop-loss controls for research A clean, transparent structure with no hidden components It is optimized for educational chart study, not automated signals. Intended Purpose Mirror Blocks is meant to help traders: Study structural transitions Understand symmetry-based wave models Explore how price interacts with mirrored layers Examine reversals and expansions from a mechanical perspective Conduct long and short backtesting for research Develop a deeper sense of market rhythm This is not a prediction model. It is a visual and structural framework for understanding movement. Backtesting Disclaimer Backtest results can vary depending on: Slippage settings Commission settings Timeframe Asset volatility Structural sensitivity parameters Past performance does not guarantee future results. Use this as a research tool only. Warnings & Compliance This script is educational. It is not financial advice. It does not provide signals. It does not promise profitability. The purpose is to help visualize structure, not predict price. The strategy features are simply here to help users study how structural transitions behave under various conditions. License Released under the Michael Culpepper Gratitude License (2025). Use and modify freely for education and research with attribution. No resale. No promises of profitability. Purpose is understanding, not signals.Strategia Pine Script®di mikeyc74785
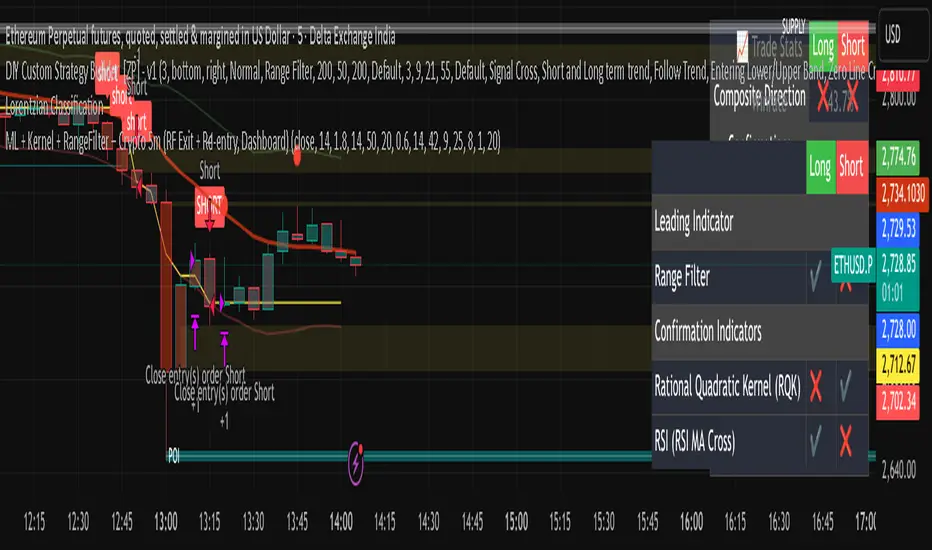
crypto editionUnlock the power of advanced algorithmic trading with this high-precision Crypto Trend-Following Strategy, engineered to adapt to any timeframe, yet highly optimized for lower-timeframe trading (M1–M15) where volatility creates exceptional opportunities — especially on small-cap and newly listed crypto coins.Strategia Pine Script®di rehankhan100881
Alpha VWAP Regime🔥 Alpha VWAP Regime — Institutional VWAP Strategy (Closed Source) Alpha VWAP Regime is a multi-layered VWAP trading system that identifies the active market regime and adapts its signals based on institutional liquidity behavior. This strategy is closed-source because it uses a proprietary combination of VWAP structures, anchored pivot logic, band deviations, and regime detection filters that are not publicly available. 🧠 How the Strategy Works (Conceptual Explanation) This strategy does not rely on a single VWAP line. Instead, it builds a VWAP matrix consisting of: 1) Session VWAP Defines fair value for the current session. Used to detect intraday directional bias. 2) Anchored VWAP (AVWAP) Automatically anchored to swing highs and lows (pivot-based). Tracks where large players accumulated or distributed positions. 3) VWAP Bands (±1σ and ±2σ) Used as dynamic volatility envelopes: ±1σ = fair-value zone / no-trade area ±2σ = mean-reversion extremes 4) Market Regime Classification (ADX-based) The strategy determines which environment the market is in: Trending Regime: ADX above threshold Ranging Regime: ADX below threshold Breakout Regime: Volume-based breakout of AVWAP Each regime activates a different entry model. 📌 Entry Logic (High-Level Overview) Trend Mode Triggered only when ADX confirms a trend. Entries occur near VWAP or −1σ using price-action confirmation. Mean Reversion Mode Activated when the market is ranging. Entries target the ±2σ deviation bands. Breakout Mode Triggered by price crossing AVWAP with above-average volume. Used to catch institutional continuation moves. ALL Mode Combines the three models for a full adaptive system. 📉 Exits & Risk Management All stops and targets use ATR-based volatility sizing Trend trades aim for larger targets Mean-reversion trades aim for smaller snapback moves Breakouts use wider stops but high R:R 🔍 How to Use the Strategy Load the script on a clean chart Choose your preferred regime mode (Trend / MR / Breakout / ALL) Optionally hide VWAP indicators and display signals only Use realistic position sizing and commissions Evaluate performance across multiple assets and timeframes 🔒 Why It Is Closed-Source The code uses: A custom anchoring engine Multi-layered regime filters Dynamic VWAP matrix Prop logic for bias scoring These components were built from scratch and form a unique decision model, so the source is protected. 🇸🇦 الشرح العربي لاستراتيجية Alpha VWAP Regime Alpha VWAP Regime هي استراتيجية تداول مؤسسية متقدمة تعتمد على تحليل السيولة، وتحديد حالة السوق (Market Regime)، ودمج عدة طبقات من VWAP داخل نموذج واحد متكيف. الهدف من الاستراتيجية هو التداول في المناطق التي يتواجد فيها المال الذكي، وتجنب التداول في المناطق العشوائية أو منخفضة الجودة. ________________________________________ 🧠 كيف تعمل الاستراتيجية؟ الاستراتيجية لا تعتمد على VWAP واحد، بل تستخدم “مصفوفة VWAP” كاملة تتكوّن من: 1) VWAP اليومي (Session VWAP) يُستخدم لتحديد القيمة العادلة خلال الجلسة، وتحديد الاتجاه اللحظي (Intraday Bias). ________________________________________ 2) VWAP المثبّت (Anchored VWAP) يتم تثبيته تلقائيًا على: • القمم المهمة (Swing Highs) • القيعان المهمة (Swing Lows) ويساعد في تحديد مناطق تمركز المؤسسات، ومناطق الانعكاس أو الاختراقات الحقيقية. ________________________________________ 3) نطاقات VWAP (±1σ و ±2σ) تُستخدم كأغلفة ديناميكية للسيولة والتقلب: • ±1σ = منطقة القيمة العادلة (Fair-Value Zone) → غالبًا منطقة غير مناسبة للتداول (No-Trade Zone) • ±2σ = مناطق التشبّع الحركي (Extremes) → مناسبة لاستراتيجيات الانعكاس (Mean Reversion) ________________________________________ 4) تصنيف حالة السوق Market Regimes الاستراتيجية تستخدم مؤشر ADX لتحديد حالة السوق الحالية: حالة السوق الوصف Trending اتجاه واضح وقوي Ranging تذبذب بدون اتجاه Breakout اختراق مدعوم بحجم تداول كل Regime يفعّل نموذج دخول مختلف داخل الاستراتيجية. ________________________________________ 🎯 نماذج الدخول داخل الاستراتيجية 1) نموذج الاتجاه (Trend Mode) يعمل فقط عندما يكون السوق في اتجاه حقيقي. يعتمد على دخول Pullbacks قرب VWAP أو نطاق −1σ مع تأكيد شموعي. ________________________________________ 2) نموذج الانعكاس (Mean Reversion Mode) يعمل فقط عندما يكون السوق متذبذبًا (Range). الدخول عند لمس ±2σ بهدف العودة نحو VWAP. ________________________________________ 3) نموذج الاختراق (Breakout Mode) يستخدم اختراقات Anchored VWAP ولكن بشرط وجود حجم تداول أعلى من المتوسط (Volume Confirmation). ________________________________________ 4) وضع الدمج (ALL Mode) يجمع بين النماذج الثلاثة ويجعل الاستراتيجية متكيفة تلقائيًا مع كل حالات السوق. ________________________________________ 📉 الخروج وإدارة المخاطر تستخدم الاستراتيجية نظامًا ديناميكيًا لإدارة المخاطر: • وقف الخسارة مبني على ATR • الأهداف مبنية على طبيعة النموذج • الصفقات الاتجاهية تستهدف R:R أعلى • صفقات MR أقصر وأسرع • صفقات Breakout أوسع ولكن مدعومة بزخم قوي ________________________________________ 🧩 كيفية استخدام الاستراتيجية 1. ضع الاستراتيجية على رسم بياني نظيف بدون مؤشرات إضافية 2. اختر نموذج الدخول المناسب من الإعدادات 3. فعّل أو أخفِ خطوط VWAP حسب الحاجة 4. استخدم إعدادات مخاطرة واقعية 5. اختبر الاستراتيجية على عدة أسواق وفريمات ________________________________________ 🔒 سبب إغلاق الكود تم إغلاق الكود لأنها تعتمد على: • محرك تثبيت AVWAP خاص • نظام Regime Detection متقدم • مصفوفة VWAP متعددة الطبقات • منطق دخول/خروج خاص تم تطويره بالكامل كل ذلك يتطلب حماية الملكية الفكرية، لذا تم نشرها Closed-Source. Strategia Pine Script®di AhmedAminTC4
5-10 sign v2(OPEN)goto days Signal Alert on/off good. 5day and 10dayStrategia Pine Script®di rof-x24610
ATR + ATR 전략It is a strong trend strategy based on ATR and ADX. Optimized for 15 installments of Bitcoin futures.Strategia Pine Script®di century_new2
KDH v2.0 (English) Trading Strategy Indicator# KDH Diamond Strategy v3.3 - TradingView Description --- ## 🇬🇧 ENGLISH VERSION ### 📊 KDH Diamond Strategy v3.3 **Professional High-Leverage Futures Trading System** --- #### 🎯 Overview KDH Diamond is an advanced algorithmic trading strategy specifically optimized for **1-hour timeframe futures trading** with high-leverage environments. Built on proven institutional concepts including Fair Value Gaps (FVG), Volume Profile analysis, and multi-layered confirmation filters, this strategy delivers consistent results without repainting. --- #### ✨ Key Features **🔥 Optimized for 1H Timeframe** - Extensively backtested across multiple markets - Highest profit rate achieved on 1-hour charts - Perfect for swing traders and active position management **🎨 No Repainting - 100% Reliable Signals** - All signals are confirmed and locked on bar close - What you see in backtest is what you get in real-time - Complete transparency with `calc_on_order_fills=true` **💎 Automated Risk Management** - Automatic Stop Loss and Take Profit calculation - Intelligent SL/TP placement based on market structure - Built-in position sizing controls (adjustable % per trade) **🚀 High-Leverage Futures Optimized** - Designed specifically for leveraged futures trading - Risk-reward ratios calibrated for 10-20x leverage environments - Precision entry timing to maximize profit potential **🔄 Advanced Position Management** - Automatic reversal entries at TP levels - Multiple re-entry opportunities per signal - Dynamic trade management based on market conditions **🎛️ Multi-Layer Confirmation System** - **SMA50 Filter (1H)**: Trend alignment confirmation - **Momentum Filter**: KAMA-based directional strength - **RSI Divergence Filter**: Reversal detection at extremes - **Volume Profile Filter**: Order flow and liquidity analysis --- #### 📈 How It Works **Signal Generation** The strategy identifies **Inverted Fair Value Gaps (IFVG)** - institutional order blocks that signal high-probability reversal or continuation zones. Each signal is validated through multiple confirmation filters before execution. **Entry Logic** - Limit orders placed at optimal price levels within FVG zones - Price must touch the midline and close in favorable direction - All filters must align for signal activation **Exit Strategy** - Stop Loss: Placed at the next opposing FVG level - Take Profit: Calculated using nearest FVG in profit direction - Automatic reversal entry option at TP levels **Visual System** - Color-coded boxes show FVG zones (green/red) - Real-time position tracking with entry, SL, and TP lines - Comprehensive dashboard displaying filter status and P&L --- #### 🎯 Who Is This For? ✅ **Perfect For:** - Futures traders using 10-20x leverage - Traders seeking systematic, rule-based strategies - Those who want automated SL/TP management - 1-hour chart swing traders - Traders familiar with institutional concepts (FVG, order flow) ❌ **Not Ideal For:** - Scalpers (designed for 1H timeframe) - Spot-only traders (optimized for leveraged futures) - Beginners unfamiliar with leverage risks - Set-and-forget automated trading (requires monitoring) --- #### 📊 What You Get **Strategy Features:** - Complete FVG detection and inversion system - 4 professional-grade confirmation filters - Automated SL/TP calculation and placement - TP reversal entry system - Volume Profile sentiment analysis - Real-time position tracking dashboard - Webhook alert support for automation - Clean, organized code with detailed comments **Visual Components:** - FVG boxes with inversion coloring - Volume Profile sentiment boxes (optional) - Entry, SL, and TP lines for each position - Position status table with live P&L - Filter status dashboard --- #### ⚙️ Customization Options **Adjustable Filters (User Control):** - SMA50 Filter (1H) - Trend alignment ON/OFF - Momentum Filter - Directional strength ON/OFF - RSI Divergence Filter - Reversal detection ON/OFF - Volume Profile Filter - Order flow analysis ON/OFF **Fixed Parameters (Optimized):** - All core parameters are pre-optimized for 1H timeframe - Ensures consistent performance without overwhelming options - Prevents parameter over-fitting by users --- #### ⚠️ Important Disclaimers **Risk Warning:** This strategy is designed for leveraged futures trading, which carries substantial risk. High leverage (10-20x) can result in rapid losses. Only trade with capital you can afford to lose. **Performance:** Past performance does not guarantee future results. Always backtest on your specific market and timeframe before live trading. **Usage:** This is a trading tool, not financial advice. Users are responsible for their own trading decisions and risk management. **Requirements:** - Understanding of futures trading and leverage - Familiarity with Fair Value Gaps and institutional concepts - Ability to monitor positions (not fully automated) - Proper risk management discipline --- #### 🔧 Technical Specifications - **Platform:** TradingView Pine Script v5 - **Type:** Strategy (with backtesting capabilities) - **Timeframe:** Optimized for 1H (works on other timeframes) - **Markets:** Any futures market (crypto, stocks, indices, forex) - **Repainting:** NO - All signals are final on bar close - **Alerts:** Full webhook support for automation - **Default Settings:** 10% position size, pyramiding enabled (max 10 positions) --- #### 📞 Support Questions about setup or usage? Contact the author through TradingView messages. **Note:** This indicator is for educational and trading tool purposes only. The author is not responsible for trading losses. Trade responsibly and within your risk tolerance. Strategia Pine Script®di Trader_BUM3
xaltgodNew York Session Break-Out Strategy. Only for US30, 5 min chart Strategia Pine Script®di xaltgod3
Stochastic + Bollinger Bands Multi-Timeframe StrategyThis strategy fuses the Stochastic Oscillator from the 4-hour timeframe with Bollinger Bands from the 1-hour timeframe, operating on a 10-hour chart to capture a unique volatility rhythm and temporal alignment discovered through observational alpha. By blending momentum confirmation from the higher timeframe with short-term volatility extremes, the strategy leverages what some traders refer to as “rotating volatility” — a phenomenon where multi-timeframe oscillations sync to reveal hidden trade opportunities. 🧠 Strategy Logic ✅ Long Entry Condition: Stochastic on the 4H timeframe: %K crosses above %D Both %K and %D are below 20 (oversold zone) Bollinger Bands on the 1H timeframe: Price crosses above the lower Bollinger Band, indicating a potential reversal → A long trade is opened when both momentum recovery and volatility reversion align. ✅ Long Exit Condition: Stochastic on the 4H: %K crosses below %D Both %K and %D are above 80 (overbought zone) Bollinger Bands on the 1H: Price reaches or exceeds the upper Bollinger Band, suggesting exhaustion → The long trade is closed when either signal suggests a potential reversal or overextension. 🧬 Temporal Structure & Alpha This strategy is deployed on a 10-hour chart — a non-standard timeframe that may align more effectively with multi-timeframe mean reversion dynamics. This subtle adjustment exploits what some traders identify as “temporal drift” — the desynchronization of volatility across timeframes that creates hidden rhythm in price action. → For example, Stochastic on 4H (lookback 17) and Bollinger Bands on 1H (lookback 20) may periodically sync around 10H intervals, offering unique alpha windows. 📊 Indicator Components 🔹 Stochastic Oscillator (4H, Length 17) Detects momentum reversals using %K and %D crossovers Helps define overbought/oversold zones from a mid-term view 🔹 Bollinger Bands (1H, Length 20, ±2 StdDev) Measures price volatility using standard deviation around a moving average Entry occurs near lower band (support), exits near upper band (resistance) 🔹 Multi-Timeframe Logic Uses request.security() to safely reference 4H and 1H indicators from a 10H chart Avoids repainting by using closed higher-timeframe candles only 📈 Visualization A plot selector input allows toggling between: Stochastic Plot (%K & %D, with overbought/oversold levels) Bollinger Bands Plot (Upper, Basis, Lower from 1H data) This helps users visually confirm entry/exit triggers in real time. 🛠 Customization Fully configurable Stochastic and BB settings Timeframes are independently adjustable Strategy settings like position sizing, slippage, and commission are editable ⚠️ Disclaimer This strategy is intended for educational and informational purposes only. It does not constitute financial advice or a recommendation to buy or sell any asset. Market conditions vary, and past performance does not guarantee future results. Always test any trading strategy in a simulated environment and consult a licensed financial advisor before making real-world investment decisions.Strategia Pine Script®di RWCS_LTD36
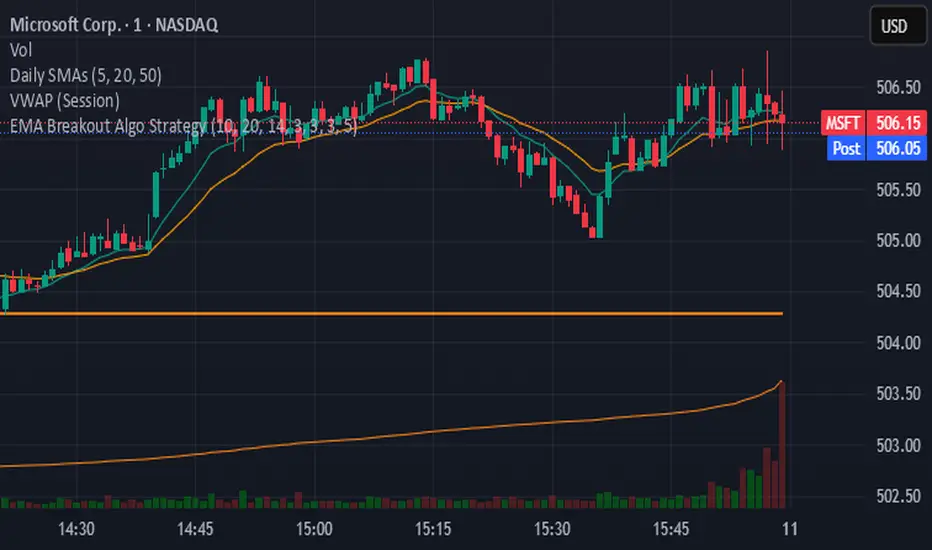
EMA Breakout Algo StrategyA volatility‑based breakout strategy using EMA alignment and ATR filters for risk‑managed entries and exits.Strategia Pine Script®di VizTraderStrategiesAggiornato 0
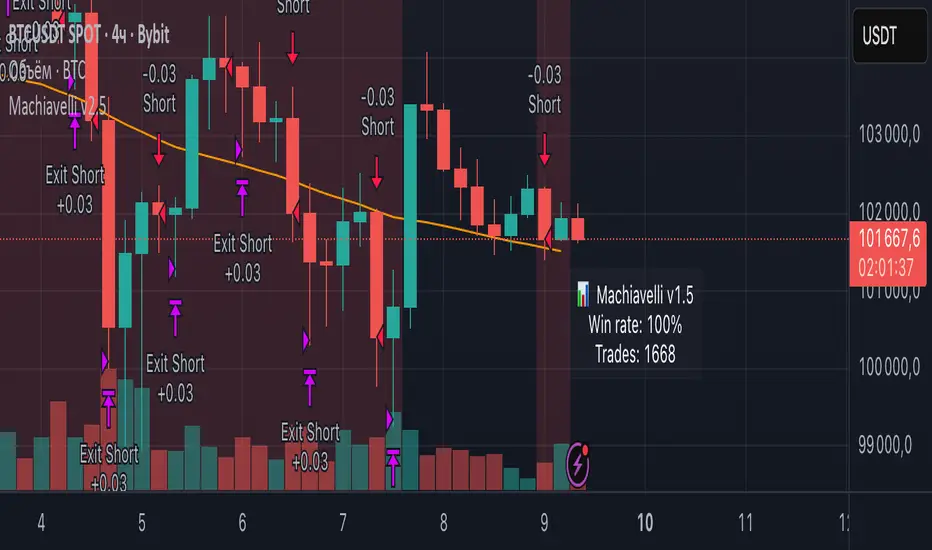
Machiavelli v2.5The purpose of this script is straightforward — to provide a reliable source of passive income. Results speak for themselves.Strategia Pine Script®di Tiski1
WMAX-D-TPS1 (USD setup)Here I show you a strategy that I have been developing for years based on breakouts of maximum and minimum price levels.This work good in 1d Strategia Pine Script®di Hodei777i5