VolbandsThe Volbands indicator dynamically plots upper and lower volatility bands based on implied daily moves derived from volatility indices. This tool provides a visual forecast of the next trading day's price range, helping traders anticipate potential price movement boundaries.
Key Features:
1. Auto-Detect Volatility Index: Volbands automatically detects the appropriate volatility index based on the current symbol. For example, it uses the VIX for S&P 500, VXN for Nasdaq 100, and custom indexes like VXAPL for Apple. Users can also manually select a specific volatility index if preferred.
2. Projected Bands:
- The indicator plots the projected upper and lower bands for the next trading day using the implied move from the volatility index.
- Displays today’s projected bands as a reference and overlays next day’s bands with a slight offset, visually indicating the anticipated range.
3. Dynamic Updates: The indicator updates automatically as new bars are added, ensuring that users have up-to-date projections based on the latest volatility data.
4. Highlighting Extreme Price Action: Candles that close outside of the projected bands are colored in yellow, highlighting moments of higher-than-expected volatility.
5. Informative Table: A customizable table displays relevant information, including:
- The selected or auto-detected volatility index
- Implied daily move percentage
- Projected upper and lower levels
Potential Applications:
- Risk Management: The Volbands indicator can help traders set more informed stop-loss and take-profit levels based on volatility-driven price projections.
- Identifying Overbought/Oversold Conditions: Price movement outside the projected bands may indicate overbought or oversold conditions, potentially signaling trade opportunities.
-Enhancing Entry and Exit Points: The projected bands act as soft support and resistance levels, assisting traders in timing entries and exits in anticipation of volatility-driven price reactions.
Future Enhancements:
Potential improvements to expand functionality could include:
- Additional Volatility Indices: Expanding coverage to include more assets and volatility indices.
- Alerts: Setting alerts for when prices breach the projected bands, enabling traders to react quickly to unexpected price movements.
- Customization of Bands: Adding options for users to adjust the implied move percentage, creating customized bands that reflect individual trading strategies.
This indicator combines implied volatility with price action, offering valuable insights to traders on expected price ranges and volatility.
Volatilityindex

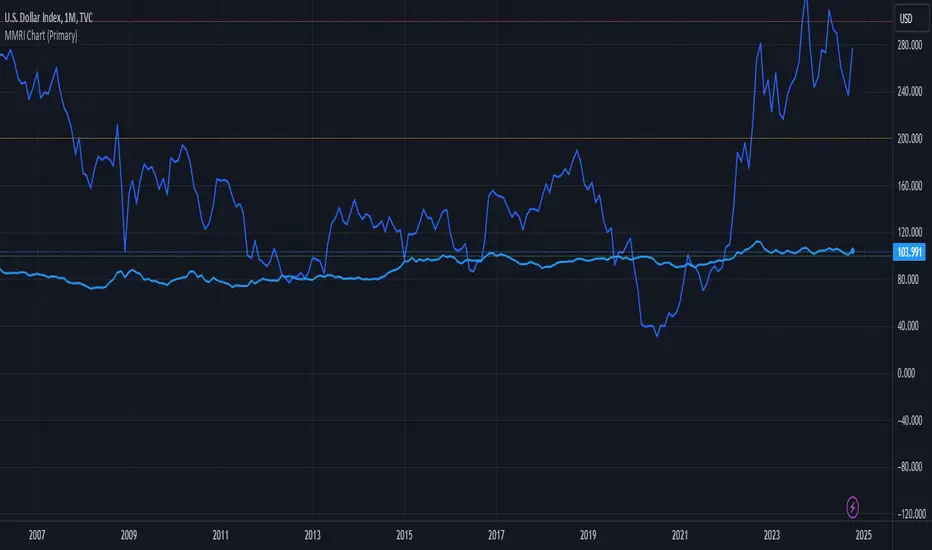
MMRI Chart (Primary)The **Mannarino Market Risk Indicator (MMRI)** is a financial risk measurement tool created by financial strategist Gregory Mannarino. It’s designed to assess the risk level in the stock market and economy based on current bond market conditions and the strength of the U.S. dollar. The MMRI considers factors like the U.S. 10-Year Treasury Yield and the Dollar Index (DXY), which indicate investor confidence in government debt and the dollar's purchasing power, respectively.
The formula for MMRI uses the 10-Year Treasury Yield multiplied by the Dollar Index, divided by a constant (1.61) to normalize the risk measure. A higher MMRI score suggests increased market risk, while a lower score indicates more stability. Mannarino has set certain thresholds to interpret the MMRI score:
- **Below 100**: Low risk.
- **100–200**: Moderate risk.
- **200–300**: High risk.
- **Above 300**: Extreme risk, indicating market instability and potential downturns.
This tool aims to provide insight into economic conditions that may affect asset classes like stocks, bonds, and precious metals. Mannarino often updates MMRI scores and risk analyses in his public market updates.
Trend Magic Enhanced [AlgoAlpha]🔥✨ Trend Magic Enhanced - Boost Your Trend Analysis! 🚀📈
Introducing the Trend Magic Enhanced indicator by AlgoAlpha, a powerful tool designed to help you identify market trends with greater accuracy. This advanced indicator combines the Commodity Channel Index (CCI) and Average True Range (ATR) to calculate dynamic support and resistance levels, known as the Trend Magic. By smoothing the Trend Magic with various moving average types, this indicator provides clearer trend signals and helps you make more informed trading decisions.
Key Features :
🎯 Unique Trend Identification : Combines CCI and ATR to detect market trends and potential reversals.
🔄 Customizable Smoothing : Choose from SMA, EMA, SMMA, WMA, or VWMA to smooth the Magic Trend for clearer signals.
🎨 Flexible Appearance Settings : Customize colors for bullish and bearish trends to suit your charting preferences.
⚙️ Adjustable Parameters : Modify CCI period, ATR period, ATR multiplier, and smoothing length to align with your trading strategy.
🔔 Alert Notifications : Set alerts for trend shifts to stay ahead of market movements.
📈 Visual Signals : Displays trend direction changes directly on the chart with up and down arrows.
Quick Guide to Using the Trend Magic Enhanced Indicator
🛠 Add the Indicator : Add the indicator to your chart by pressing the star icon to add it to favorites. Customize settings such as CCI period, ATR multiplier, ATR period, smoothing options, and colors to match your trading style.
📊 Analyze the Chart : Observe the Trend Magic line and the color-coded trend signals. When the Trend Magic line turns bullish (e.g., green), it indicates an upward trend, and when it turns bearish (e.g., red), it indicates a downward trend. Use the visual arrows to spot trend direction changes.
🔔 Set Alerts : Enable alerts to receive notifications when a trend shift is detected, so you can act promptly on trading opportunities without constantly monitoring the chart.
How It Works:
The Trend Magic Enhanced indicator integrates the Commodity Channel Index (CCI) and Average True Range (ATR) to calculate a dynamic Trend Magic line. By adjusting price levels based on CCI values—upward when CCI is positive and downward when negative—and factoring in ATR for market volatility, it creates adaptive support and resistance levels. Optionally smoothed with various moving averages to reduce noise, the indicator changes line color based on trend direction, highlights trend changes with arrows, and provides alerts for significant shifts, aiding traders in identifying potential entry and exit points.
Enhancements Over the Original Trend Magic Indicator
The Trend Magic Enhanced indicator significantly refines the trend identification method of the original Trend Magic script by introducing customizable smoothing options and additional analytical features. While the original indicator determines trend direction solely based on the Commodity Channel Index (CCI) crossing above or below zero and adjusts the Magic Trend line using the Average True Range (ATR), the enhanced version allows users to smooth the Magic Trend line with various moving average types (SMA, EMA, SMMA, WMA, VWMA). This smoothing reduces market noise and provides clearer trend signals. Additionally, the enhanced indicator incorporates price action analysis by detecting crossovers and crossunders of price with the Magic Trend line, and it visually marks trend changes with up and down arrows on the chart. These improvements offer a more responsive and accurate trend detection compared to the original method, enabling traders to identify potential entry and exit points more effectively.
Enhance your trading strategy with the Trend Magic Enhanced indicator by AlgoAlpha and gain a clearer perspective on market trends! 🌟📈

Zero Lag Trend Signals (MTF) [AlgoAlpha]Zero Lag Trend Signals 🚀📈
Ready to take your trend-following strategy to the next level? Say hello to Zero Lag Trend Signals , a precision-engineered Pine Script™ indicator designed to eliminate lag and provide rapid trend insights across multiple timeframes. 💡 This tool blends zero-lag EMA (ZLEMA) logic with volatility bands, trend-shift markers, and dynamic alerts. The result? Timely signals with minimal noise for clearer decision-making, whether you're trading intraday or on longer horizons. 🔄
🟢 Zero-Lag Trend Detection : Uses a zero-lag EMA (ZLEMA) to smooth price data while minimizing delay.
⚡ Multi-Timeframe Signals : Displays trends across up to 5 timeframes (from 5 minutes to daily) on a sleek table.
📊 Volatility-Based Bands : Adaptive upper and lower bands, helping you identify trend reversals with reduced false signals.
🔔 Custom Alerts : Get notified of key trend changes instantly with built-in alert conditions.
🎨 Color-Coded Visualization : Bullish and bearish signals pop with clear color coding, ensuring easy chart reading.
⚙️ Fully Configurable : Modify EMA length, band multiplier, colors, and timeframe settings to suit your strategy.
How to Use 📚
⭐ Add the Indicator : Add the indicator to favorites by pressing the star icon. Set your preferred EMA length and band multiplier. Choose your desired timeframes for multi-frame trend monitoring.
💻 Watch the Table & Chart : The top-right table dynamically updates with bullish or bearish signals across multiple timeframes. Colored arrows on the chart indicate potential entry points when the price crosses the ZLEMA with confirmation from volatility bands.
🔔 Enable Alerts : Configure alerts for real-time notifications when trends shift—no need to monitor charts constantly.
How It Works 🧠
The script calculates the zero-lag EMA (ZLEMA) by compensating for data lag, giving traders more responsive moving averages. It checks for volatility shifts using the Average True Range (ATR), multiplied to create upper and lower deviation bands. If the price crosses above or below these bands, it marks the start of new trends. Additionally, the indicator aggregates trend data from up to five configurable timeframes and displays them in a neat summary table. This helps you confirm trends across different intervals—ideal for multi-timeframe analysis. The visual signals include upward and downward arrows on the chart, denoting potential entries or exits when trends align across timeframes. Traders can use these cues to make well-timed trades and avoid lag-related pitfalls.

Larry Williams Valuation Index [tradeviZion]Larry Williams Valuation Index
Welcome to the Larry Williams Valuation Index by tradeviZion! This script is an interpretation of Larry Williams' famous WillVal (Valuation) Index, originally developed in 1990 to help traders determine whether a market or asset is overvalued or undervalued. We've extended it to support multiple securities and offer alerts for different valuation levels, helping you make more informed trading decisions.
What is the Valuation Index?
The Valuation Index measures how a security's current price compares to its historical price action. It helps identify whether the security is overvalued (priced too high), undervalued (priced too low), or in a normal range.
This version supports multiple securities and uses valuation parameters to help you assess the relative valuation of three securities simultaneously. It can help you determine the best times to enter (buy) or exit (sell) the market.
Key Features
Multi-Security Analysis: Analyze up to three securities simultaneously to get a broader view of market conditions.
Valuation Levels: Automatically calculate overvaluation and undervaluation levels or set manual levels for consistent analysis.
Custom Alerts: Create custom alerts when securities move between overvalued, undervalued, or normal ranges.
Customizable Table Display: Display a table with valuation values and their status on the chart.
Getting Started
Step 1: Adding the Script to Your Chart
First, add the Larry Williams Valuation Index script to your chart on TradingView. The script is designed to work with any timeframe, but for best results, use weekly or daily timeframes for a longer-term perspective.
Step 2: Configuring Securities
The script allows you to analyze up to three different securities :
Security 1 (Default: DXY)
Security 2 (Default: GC1!)
Security 3 (Default: ZB1!)
You can enable or disable each security individually.
Custom Timeframe Option: You have the option to select a custom timeframe for analysis. This allows you to see whether the security is overvalued or undervalued in lower or higher timeframes. Note that this feature is experimental and has not been extensively tested. Larry Williams originally used the weekly timeframe to determine if a stock was overvalued or undervalued. By default, the indicator compares the current price with the security based on the selected timeframe, except if you choose to use a custom timeframe.
Pro Tip : New users can start with the default securities to understand the concept before using other assets.
Step 3: Valuation Index Settings
Short EMA Length : This is the short-term average used for calculations. A lower value makes it more responsive to recent price changes.
Long EMA Length : This is the long-term average, used to smooth the valuation over time.
Valuation Length (Default: 156) : Represents approximately three years of daily bars (as recommended by Larry Williams).
How is the Valuation Index Calculated?
The valuation calculation is done using a method called WVI (WillVal Index), which compares the current price of a security to the price of another correlated security. Here’s a step-by-step explanation:
1. Data Collection: The script takes the closing price of the security you are analyzing and the closing price of the correlated security.
2. Ratio Calculation : The ratio of the two prices is calculated:
Price Ratio = (Price of your security) / (Price of correlated security) * 100.
This ratio helps determine how expensive or cheap your security is compared to the correlated one.
3. Exponential Moving Averages (EMAs) : The price ratio is used to calculate short-term and long-term EMAs (Exponential Moving Averages). EMAs are used to create smooth lines that represent the average price of a security over a specific period of time, with more weight given to recent data. By calculating both short-term and long-term EMAs, we can identify the trend direction and how the security is performing compared to its historical averages.
4. Valuation Index Calculation:
The Valuation Index is calculated as the difference between the short-term EMA and the long-term EMA. This difference helps to determine if the security is currently overvalued or undervalued:
A positive value indicates that the price is above its longer-term trend, suggesting potential overvaluation.
A negative value indicates that the price is below its longer-term trend, suggesting potential undervaluation.
5. Normalization:
To make the valuation easier to interpret, the calculated valuation index is then normalized using the highest and lowest values over the selected valuation length (e.g., 156 bars).
This normalization process converts the index into a percentage between 0 and 100, where higher values indicate overvaluation and lower values indicate undervaluation.
Step 4: Understanding Valuation Levels
The valuation levels indicate whether a security is currently undervalued, overvalued, or in a normal range.
Manual Levels : You can manually set the overvaluation and undervaluation thresholds (default is 85 for overvalued and 15 for undervalued).
Auto Levels : The script can automatically calculate these levels based on recent price action, allowing you to adapt to changing market conditions.
Auto Levels Calculation Explained:
The Auto Levels are calculated by taking the average of the valuation indices for all three securities (e.g., index1, index2, and index3).
The script then looks at the highest and lowest values of this average over a selected number of recent bars (e.g., 50 bars).
The overvaluation level is determined by taking the highest value and multiplying it by a multiplier (e.g., 5). Similarly, the undervaluation level is calculated using the lowest value and the multiplier.
These dynamic levels adjust according to recent price action, providing an adaptive approach to identifying overvalued and undervalued conditions.
Step 5: How to Use the Script to Make Trading Decisions
For new users, here's a step-by-step trading strategy you can use with the Valuation Index:
1. Identify Undervalued Opportunities
When two or more securities are in the undervalued range (below 15 for manual or below automatically calculated undervalue levels), wait for at least two of these securities to turn from undervalued to normal .
This transition indicates a potential buy opportunity .
2. Buying Signal
When at least two securities transition from undervalued to normal, you can consider buying the asset.
This indicates that the market may be recovering from undervalued conditions and could be moving into a growth phase.
3. Selling Signal
Exit when the price high closes below the EMA 21 (21-day exponential moving average).
Alternatively, if the valuation index reaches overvalued levels (above 85 manually or auto-calculated), wait for it to drop back to normal . This can be another point to exit the trade .
You can also use any other sell condition based on your r isk management strategy .
Alerts for Valuation Levels
The script includes alerts to notify you of changing market conditions:
To activate these alerts, follow these steps, referring to the provided screenshot with detailed steps:
1. Enable Alerts : Click on the settings gear icon on the script title in your chart. In the settings menu, scroll to the section labeled Alerts Settings .
Enable Alerts by checking the Enable Alerts box.
Set the Required Securities for Alert (default is 2 securities).
Choose the Alert Frequency : Selecting Once Per Bar Close will trigger alerts only at the close of each bar, ensuring you receive confirmed signals rather than potentially noisy intermediate signals.
2. Select Alert Type : Choose the type of alert you want to activate, such as Alert on Overvalued, Alert on Undervalued, Alert on Over to Normal , or Alert on Under to Normal .
3. Save Settings : Click OK to save your alert settings.
4. Add Alert on Indicator : Click the "..." (More button) next to the indicator name on the chart and select " Add alert on tradeviZion - WillVal ".
5. Create Alert : In the Create Alert window:
Set Condition to tradeviZion - WillVal .
Ensure Any alert() function call is selected.
Set the Alert Name and select your Expiration preferences.
6. Set Notification Preferences : Go to the Notifications tab and select how you want to receive notifications, such as via app notification, toast notification, email , or sound alert . Adjust these preferences to best suit your needs.
7. Click Create : Finally, click Create to activate the alert.
These alerts will help you stay informed about key market conditions and take action accordingly, ensuring you do not miss critical trading opportunities.
Understanding the Table Display
The script includes an interactive table on the chart to show the valuation status of each security:
Security : The name of the security being analyzed.
Value : The current valuation index value.
Status : Indicates whether the security is overvalued, undervalued , or in a normal range.
Color: Displays a color code for easy identification of status:
Red for overvalued.
Green for undervalued.
Other colors represent normal valuation levels.
Empowering Messages : Motivational messages are displayed to encourage disciplined trading. These messages will change periodically, helping keep a positive trading mindset.
Acknowledgment
This tool builds upon the foundational work of Larry Williams, who developed the WillVal (Valuation) Index concept. It also incorporates enhancements to extend multi-security analysis, valuation normalization, and advanced alerting features, providing a more versatile and powerful indicator. The Larry Williams Valuation Index [ tradeviZion ] helps traders make informed decisions by assessing overvalued and undervalued conditions for multiple securities simultaneously.
Note : Always practice proper risk management and thoroughly test the indicator to ensure it aligns with your trading strategy. Past performance is not indicative of future results.
Trade smarter with TradeVizion—unlock your trading potential today!

Options Oscillator [Lite] IVRank, IVx, Call/Put Volatility Skew The first TradingView indicator that provides REAL IVRank, IVx, and CALL/PUT skew data based on REAL option chain for 5 U.S. market symbols.
🔃 Auto-Updating Option Metrics without refresh!
🍒 Developed and maintained by option traders for option traders.
📈 Specifically designed for TradingView users who trade options.
🔶 Ticker Information:
This 'Lite' indicator is currently only available for 5 liquid U.S. market smbols : NASDAQ:TSLA AMEX:DIA NASDAQ:AAPL NASDAQ:AMZN and NYSE:ORCL
🔶 How does the indicator work and why is it unique?
This Pine Script indicator is a complex tool designed to provide various option metrics and visualization tools for options market traders. The indicator extracts raw options data from an external data provider (ORATS), processes and refines the delayed data package using pineseed, and sends it to TradingView, visualizing the data using specific formulas (see detailed below) or interpolated values (e.g., delta distances). This method of incorporating options data into a visualization framework is unique and entirely innovative on TradingView.
The indicator aims to offer a comprehensive view of the current state of options for the implemented instruments, including implied volatility (IV), IV rank (IVR), options skew, and expected market movements, which are objectively measured as detailed below.
The options metrics we display may be familiar to options traders from various major brokerage platforms such as TastyTrade, IBKR, TOS, Tradier, TD Ameritrade, Schwab, etc.
🟨 The following data is displayed in the oscillator 🟨
We use Tastytrade formulas, so our numbers mostly align with theirs!
🔶 𝗜𝗩𝗥𝗮𝗻𝗸
The Implied Volatility Rank (IVR) helps options traders assess the current level of implied volatility (IV) in comparison to the past 52 weeks. IVR is a useful metric to determine whether options are relatively cheap or expensive. This can guide traders on whether to buy or sell options.
IV Rank formula = (current IV - 52 week IV low) / (52 week IV high - 52 week IV low)
IVRank is default blue and you can adjust their settings:
🔶 𝗜𝗩𝘅 𝗮𝘃𝗴
The implied volatility (IVx) shown in the option chain is calculated like the VIX. The Cboe uses standard and weekly SPX options to measure expected S&P 500 volatility. A similar method is used for calculating IVx for each expiration cycle.
We aggregate the IVx values for the 35-70 day monthly expiration cycle, and use that value in the oscillator and info panel.
We always display which expiration the IVx values are averaged for when you hover over the IVx cell.
IVx main color is purple, but you can change the settings:
🔹IVx 5 days change %
We are also displaying the five-day change of the IV Index (IVx value). The IV Index 5-Day Change column provides quick insight into recent expansions or decreases in implied volatility over the last five trading days.
Traders who expect the value of options to decrease might view a decrease in IVX as a positive signal. Strategies such as Strangle and Ratio Spread can benefit from this decrease.
On the other hand, traders anticipating further increases in IVX will focus on the rising IVX values. Strategies like Calendar Spread or Diagonal Spread can take advantage of increasing implied volatility.
This indicator helps traders quickly assess changes in implied volatility, enabling them to make informed decisions based on their trading strategies and market expectations.
Important Note:
The IVx value alone does not provide sufficient context. There are stocks that inherently exhibit high IVx values. Therefore, it is crucial to consider IVx in conjunction with the Implied Volatility Rank (IVR), which measures the IVx relative to its own historical values. This combined view helps in accurately assessing the significance of the IVx in relation to the specific stock's typical volatility behavior.
This indicator offers traders a comprehensive view of implied volatility, assisting them in making informed decisions by highlighting both the absolute and relative volatility measures.
🔶 𝗖𝗔𝗟𝗟/𝗣𝗨𝗧 𝗣𝗿𝗶𝗰𝗶𝗻𝗴 𝗦𝗸𝗲𝘄 𝗵𝗶𝘀𝘁𝗼𝗴𝗿𝗮𝗺
At TanukiTrade, Vertical Pricing Skew refers to the difference in pricing between put and call options with the same expiration date at the same distance (at tastytrade binary expected move). We analyze this skew to understand market sentiment. This is the same formula used by TastyTrade for calculations.
We calculate the interpolated strike price based on the expected move, taking into account the neighboring option prices and their distances. This allows us to accurately determine whether the CALL or PUT options are more expensive.
🔹 What Causes Pricing Skew? The Theory Behind It
The asymmetric pricing of PUT and CALL options is driven by the natural dynamics of the market. The theory is that when CALL options are more expensive than PUT options at the same distance from the current spot price, market participants are buying CALLs and selling PUTs, expecting a faster upward movement compared to a downward one .
In the case of PUT skew, it's the opposite: participants are buying PUTs and selling CALLs , as they expect a potential downward move to happen more quickly than an upward one.
An options trader can take advantage of this phenomenon by leveraging PUT pricing skew. For example, if they have a bullish outlook and both IVR and IVx are high and IV started decreasing, they can capitalize on this PUT skew with strategies like a jade lizard, broken wing butterfly, or short put.
🔴 PUT Skew 🔴
Put options are more expensive than call options, indicating the market expects a faster downward move (▽). This alone doesn't indicate which way the market will move (because nobody knows that), but the options chain pricing suggests that if the market moves downward, it could do so faster in velocity compared to a potential upward movement.
🔹 SPY PUT SKEW example:
If AMEX:SPY PUT option prices are 46% higher than CALLs at the same distance for the optimal next monthly expiry (DTE). This alone doesn't indicate which way the market will move (because nobody knows that), but the options chain pricing suggests that if the market moves downward, it could do so 46% faster in velocity compared to a potential upward movement
🟢 CALL Skew 🟢
Call options are more expensive than put options, indicating the market expects a faster upward move (△). This alone doesn't indicate which way the market will move (because nobody knows that), but the options chain pricing suggests that if the market moves upward, it could do so faster in velocity compared to a potential downward movement.
🔹 INTC CALL SKEW example:
If NASDAQ:INTC CALL option prices are 49% higher than PUTs at the same distance for the optimal next monthly expiry (DTE). This alone doesn't indicate which way the market will move (because nobody knows that), but the options chain pricing suggests that if the market moves upward, it could do so 49% faster in velocity compared to a potential downward movement .
🔶 USAGE example:
The script is compatible with our other options indicators.
For example: Since the main metrics are already available in this Options Oscillator, you can hide the main IVR panel of our Options Overlay indicator, freeing up more space on the chart. The following image shows this:
🔶 ADDITIONAL IMPORTANT COMMENTS
🔹 Historical Data:
Yes, we only using historical internal metrics dating back to 2024-07-01, when the TanukiTrade options brand launched. For now, we're using these, but we may expand the historical data in the future.
🔹 What distance does the indicator use to measure the call/put pricing skew?:
It is important to highlight that this oscillator displays the call/put pricing skew changes for the next optimal monthly expiration on a histogram.
The Binary Expected Move distance is calculated using the TastyTrade method for the next optimal monthly expiration: Formula = (ATM straddle price x 0.6) + (1st OTM strangle price x 0.3) + (2nd OTM strangle price x 0.1)
We interpolate the exact difference based on the neighboring strikes at the binary expected move distance using the TastyTrade method, and compare the interpolated call and put prices at this specific point.
🔹 - Why is there a slight difference between the displayed data and my live brokerage data?
There are two reasons for this, and one is beyond our control.
◎ Option-data update frequency:
According to TradingView's regulations and guidelines, we can update external data a maximum of 5 times per day. We strive to use these updates in the most optimal way:
(1st update) 15 minutes after U.S. market open
(2nd, 3rd, 4th updates) 1.5–3 hours during U.S. market open hours
(5th update) 10 minutes before U.S. market close.
You don’t need to refresh your window, our last refreshed data-pack is always automatically applied to your indicator, and you can see the time elapsed since the last update at the bottom of the corner on daily TF.
◎ Brokerage Calculation Differences:
Every brokerage has slight differences in how they calculate metrics like IV and IVx. If you open three windows for TOS, TastyTrade, and IBKR side by side, you will notice that the values are minimally different. We had to choose a standard, so we use the formulas and mathematical models described by TastyTrade when analyzing the options chain and drawing conclusions.
🔹 - EOD data:
The indicator always displays end-of-day (EOD) data for IVR, IV, and CALL/PUT pricing skew. During trading hours, it shows the current values for the ongoing day with each update, and at market close, these values become final. From that point on, the data is considered EOD, provided the day confirms as a closed daily candle.
🔹 - U.S. market only:
Since we only deal with liquid option chains: this option indicator only works for the USA options market and do not include future contracts; we have implemented each selected symbol individually.
Disclaimer:
Our option indicator uses approximately 15min-3 hour delayed option market snapshot data to calculate the main option metrics. Exact realtime option contract prices are never displayed; only derived metrics and interpolated delta are shown to ensure accurate and consistent visualization. Due to the above, this indicator can only be used for decision support; exclusive decisions cannot be made based on this indicator. We reserve the right to make errors.This indicator is designed for options traders who understand what they are doing. It assumes that they are familiar with options and can make well-informed, independent decisions. We work with public data and are not a data provider; therefore, we do not bear any financial or other liability.

VIX Bars [CrossTrade]In simple terms, this indicator colors your chart bars based on the VIX levels. We know that high volatility is unstainable and will naturally regress to a calmer market, therefore highlighting the bars where VIX is at extreme highs can sometimes indicate a market turning point. Consider pairing this indicator with my VIX Heatmap indicator for a complete picture of volatility.
Customizable VIX Levels: You can set your own thresholds for when the bars turn green or red. Green bars pop up when the VIX is above your set upper level (default is 30) - kind of like a heads-up that things might get bumpy. Red bars show up when the VIX dips below your lower threshold (default is 15), signaling calmer waters.
Optional Donchian Channel Filter: The Donchian Channel filter looks at the highest highs and lowest lows over your chosen period (default's 52 days) and only colors the bars if they match the filter's criteria. This adds an extra layer of confirmation that the colored bars at at a major high or low.
Visual Simplicity: The indicator keeps things visually straightforward. No cluttered screen, just colored bars telling you a story about market vibes. Alert come standard to signal those potential bottom or top bars based on the VIX being at your preferred extreme levels.
In essence, "VIX Bars" is like having a volatility radar on your chart. It doesn't make predictions, but it sure gives you a neat, color-coded heads-up on market sentiment. Great for adding an extra dimension to your analysis without getting all tangled up in complex indicators!

ATR by Time [QuantVue]"ATR by Time" incorporates time-specific volatility patterns by calculating the Average True Range (ATR) over a customizable period and comparing it to historical ATR values
at specific times of the day.
The Average True Range (ATR) is a popular technical indicator that measures market volatility by decomposing the entire range of an asset price for that period.
By taking the ATR at certain times of the day and comparing it to the current bar's ATR, traders can gain several potential advantages:
Volatility Pattern Recognition: Different times of the trading day often exhibit different levels of volatility. For instance, markets might be more volatile at the open and close compared to midday. By tracking ATR at specific times, traders can recognize these patterns and better predict periods of high or low volatility.
Risk Management: Understanding volatility trends throughout the day helps in better risk management. During periods of high expected volatility (indicated by higher ATR compared to the historical average), traders can adjust their stop-loss levels and position sizes accordingly to protect their capital.
Trend Confirmation and Divergence: This indicator can help confirm trends or identify potential reversals. For example, if the current ATR consistently exceeds the average ATR at specific times, it may confirm a strong trend. Conversely, if the current ATR falls below the historical average, it could signal a potential slowdown or reversal.
This indicator will work on all markets on all time frames. User can customize ATR length as well as the lookback period.
This script utilizes TradingView's RelativeValue library and averageAtTime function, which is used to compare a current data point in a time interval to an average of data points with corresponding time offsets across historical periods. Its purpose is to assess the significance of a value by considering the historical context within past time intervals.
Give this indicator a BOOST and COMMENT your thoughts!
We hope you enjoy.
Cheers!

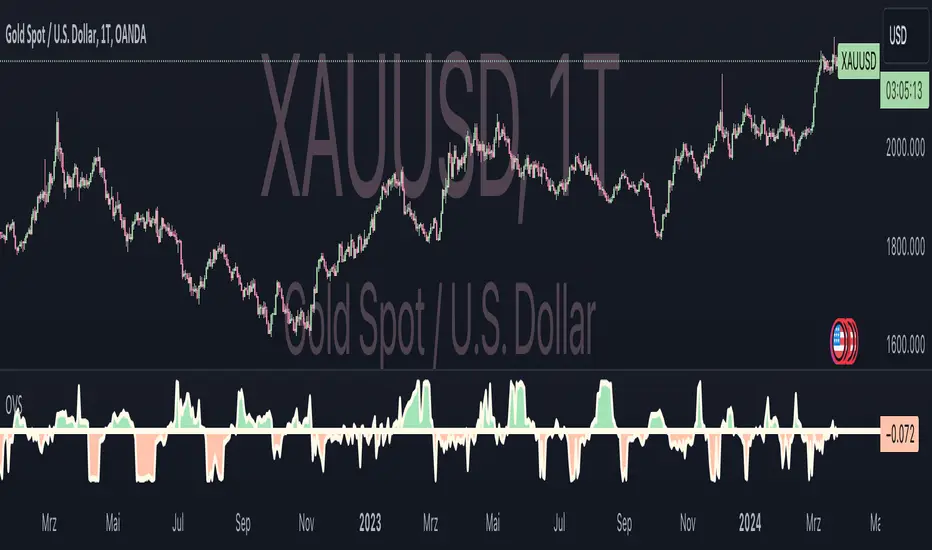
Oster's Vola Sentiment (OVS)Overview:
Oster's Vola Sentiment (OVS) is an indicator that reflects market sentiment dynamics based on volatility , employing Oster's Volatility Method for calculation. Inspired by traditional volatility analysis, this indicator provides a versatile tool for traders to interpret market sentiments and identify potential trading opportunities, including potential reversal points . By adjusting the period length in the settings, users can fine-tune OVS sensitivity to capture buy or sell signals, achieving different signal qualities.
Sophisticated Calculation Methodology:
The OVS derives insights from Oster's Volatility Method, utilizing metrics related to price range and movement to assess market dynamics. It calculates the relative movement index, providing traders with a quantifiable measure of market sentiment. Additionally, OVS incorporates the Average True Range (ATR) to further refine its analysis, ensuring comprehensive insights into market volatility dynamics.
Interpretation:
Oster's Vola Sentiment (OVS) , represented on the chart, offers traders insights into market sentiment dynamics and potential reversal points . Values above 0 indicate a buy tendency, suggesting favorable conditions for buying opportunities, while values below 0 suggest a sell tendency, signaling potential selling pressure. The probability of a significant market move increases as OVS values approach the predefined buy or sell thresholds. Values exceeding the buy threshold indicate stronger buying signals, while values below the sell threshold signify stronger selling signals. By aligning these interpretations with the trader's investment strategy, OVS aids in decision-making processes, offering nuanced perspectives on market movements.
Dynamic Color Coding for Visual Clarity:
To enhance user experience and facilitate quick decision-making, OVS incorporates dynamic color coding . Market conditions favoring selling are denoted by red hues, while those conducive to buying are highlighted in green. Neutral conditions, indicative of balanced market sentiment, are represented in neutral colors. This intuitive visual feedback enables traders to swiftly identify market opportunities and risks, empowering them to make informed trading decisions.
Customizable Parameters for Tailored Analysis:
Acknowledging the diverse trading preferences and strategies of its users, OVS offers customizable parameters. Traders can adjust the period length to fine-tune the indicator's sensitivity to their desired level, balancing the frequency and quality of signals according to their trading objectives. Additionally, OVSs alert functionalities allow traders to set personalized thresholds, aligning with their risk tolerance and market outlook.
Conclusion:
In conclusion, Oster's Vola Sentiment (OVS) emerges as a valuable addition to the trader's toolkit, offering a versatile and accessible approach to market analysis. Built upon Oster's Volatility Method and sophisticated calculation methodologies, OVS provides traders with actionable insights into market sentiment across various timeframes and asset classes , including potential reversal points. Its intuitive visualizations, coupled with customizable parameters and alert functionalities, empower traders to navigate dynamic market conditions with confidence. Whether you're a seasoned investor or a novice trader, OVS equips you with the tools needed to stay ahead in today's competitive markets.
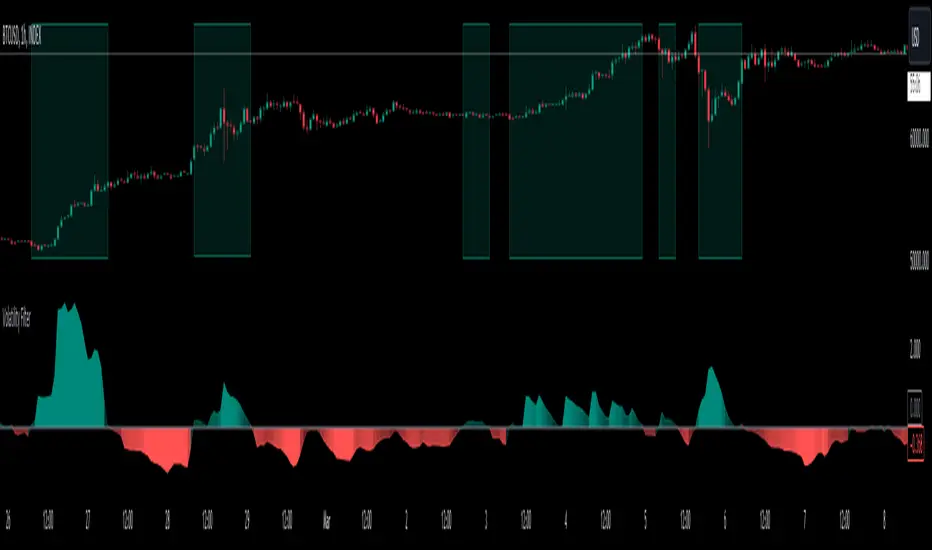
Volatility Filter v2VF v2 is a new iteration of my tool designed for traders who wish to gain a deeper understanding of market dynamics, specifically to distinguish periods of high volatility, which often correspond to strong market trends. By identifying these periods, traders can make more informed decisions, potentially leading to better trading outcomes.
Understanding Market Volatility:
At the heart of this script lies the concept of market volatility, a statistical measure reflecting the degree of variation in trading prices. Volatility is pivotal for traders; it provides insights into the market's emotional state, indicating periods of uncertainty or confidence. High volatility often correlates with strong trends, making it a critical indicator for trend-followers. By identifying when volatility crosses a certain threshold, traders can discern whether the market is likely to be in a trending phase or a more subdued, range-bound state.
How the Script Works:
The core functionality of the script revolves around a signal line that oscillates around a zero threshold. When the signal line is above zero, it indicates increased market volatility, suggesting the presence of a trend. The farther the oscillator deviates from zero, the stronger the implied trend. This mechanism enables traders to visually gauge market conditions and adjust their strategies accordingly.
Controlling the Indicator:
To cater to diverse trading styles and preferences, the script is equipped with several customizable settings:
Filter Threshold: This 'zero line' acts as the baseline for distinguishing between different volatility regimes. Crossing this threshold is a primary signal for changes in market volatility.
Moving Average Type: With over 30 types of moving averages to choose from, traders can select the one that best fits their analysis style. Each type offers a different perspective on price data, allowing for a tailored approach to trend identification.
Colorize Indicator: This feature enhances the visual representation of the indicator, making it easier to interpret. When enabled, the oscillator's color intensity varies with its proximity to the extremes, providing a quick visual cue about trend strength.
Advanced Settings – Length and Multiplier:
The script introduces an innovative approach to time frame analysis through its length and multiplier settings:
Length: This parameter sets the base period for all metrics within the script, similar to traditional indicators.
Multiplier: This unique feature differentiates the script by incorporating three distinct timeframes into the analysis: a lower timeframe, the main (current) timeframe, and a higher timeframe. The multiplier adjusts these timeframes relative to the main one. For instance, with a daily main timeframe and a multiplier of 2, the lower timeframe would be 12 hours, and the higher timeframe would be 2 days. This tri-timeframe approach aims to provide a more comprehensive volatility assessment.
Volatility Filter Indicators Section:
The script utilizes nine different, undisclosed metrics within its volatility filter. Traders have the flexibility to enable or disable these metrics based on their preferences, allowing for a customizable trading experience. Additionally, the script offers alert functionality for when the indicator crosses the threshold, either upwards or downwards, facilitating timely decision-making.
P.S
With better understanding of markets over time, I designed a new iteration of my volatility filter indicator. The second version provides faster, more precise way to analyze markets, but I also wanted to keep my first version untouched in case if some people find it better for their purposes. As I mentioned above, this version is calculated in a very different way from a previous one, so if you never tried it you can do it here
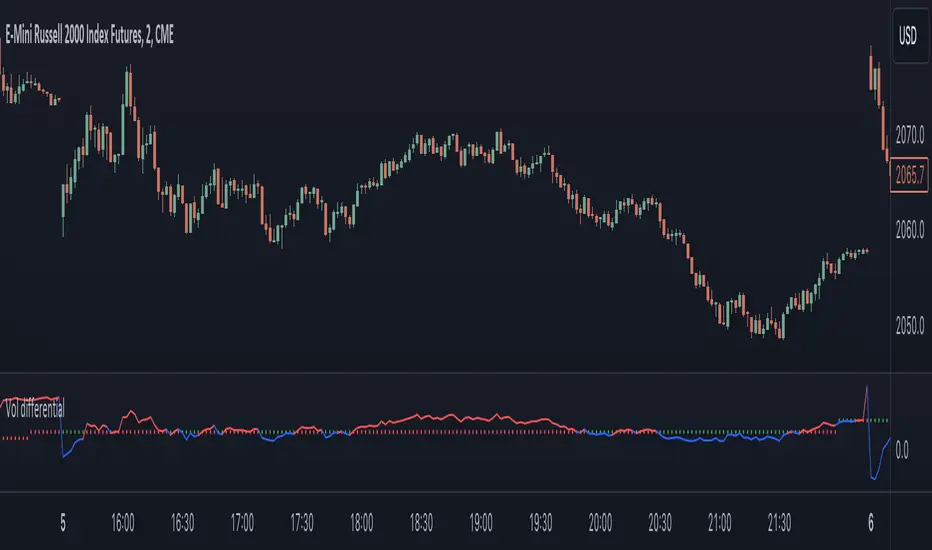
Realized volatility differentialAbout
This is a simple indicator that takes into account two types of realized volatility: Close-Close and High-Low (the latter is more useful for intraday trading).
The output of the indicator is two values / plots:
an average of High-Low volatility minus Close-Close volatility (10day period is used as a default)
the current value of the indicator
When the current value is:
lower / below the average, then it means that High-Low volatility should increase.
higher / above then obviously the opposite is true.
How to use it
It might be used as a timing tool for mean reversion strategies = when your primary strategy says a market is in mean reversion mode, you could use it as a signal for opening a position.
For example: let's say a security is in uptrend and approaching an important level (important to you).
If the current value is:
above the average, a short position can be opened, as High-Low volatility should decrease;
below the average, a trend should continue.
Intended securities
Futures contracts
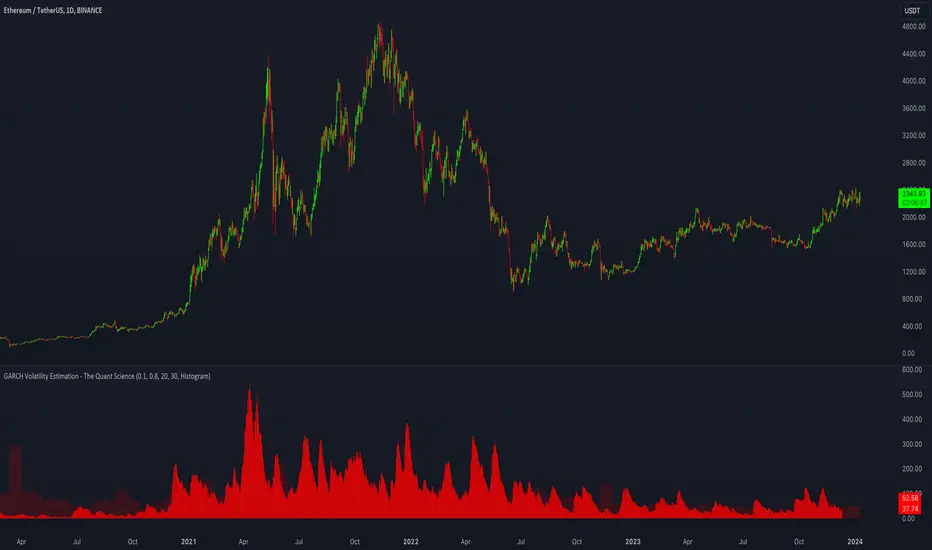
GARCH Volatility Estimation - The Quant ScienceThe GARCH (Generalized Autoregressive Conditional Heteroskedasticity) model is a statistical model used to forecast the volatility of a financial asset. This model takes into account the fluctuations in volatility over time, recognizing that volatility can vary in a heteroskedastic (i.e., non-constant variance) manner and can be influenced by past events.
The general formula of the GARCH model is:
σ²(t) = ω + α * ε²(t-1) + β * σ²(t-1)
where:
σ²(t) is the conditional variance at time t (i.e., squared volatility)
ω is the constant term (intercept) representing the baseline level of volatility
α is the coefficient representing the impact of the squared lagged error term on the conditional variance
ε²(t-1) is the squared lagged error term at the previous time period
β is the coefficient representing the impact of the lagged conditional variance on the current conditional variance
In the context of financial forecasting, the GARCH model is used to estimate the future volatility of the asset.
HOW TO USE
This quantitative indicator is capable of estimating the probable future movements of volatility. When the GARCH increases in value, it means that the volatility of the asset will likely increase as well, and vice versa. The indicator displays the relationship of the GARCH (bright red) with the trend of historical volatility (dark red).
USER INTERFACE
Alpha: select the starting value of Alpha (default value is 0.10).
Beta: select the starting value of Beta (default value is 0.80).
Lenght: select the period for calculating values within the model such as EMA (Exponential Moving Average) and Historical Volatility (default set to 20).
Forecasting: select the forecasting period, the number of bars you want to visualize data ahead (default set to 30).
Design: customize the indicator with your preferred color and choose from different types of charts, managing the design settings.
Squeeze & Release [AlgoAlpha]Introduction:
💡The Squeeze & Release by AlgoAlpha is an innovative tool designed to capture price volatility dynamics using a combination of EMA-based calculations and ATR principles. This script aims to provide traders with clear visual cues to spot potential market squeezes and release scenarios. Hence it is important to note that this indicator shows information on volatility, not direction.
Core Logic and Components:
🔶EMA Calculations: The script utilizes the Exponential Moving Average (EMA) in multiple ways to smooth out the data and provide indicator direction. There are specific lengths for the EMAs that users can modify as per their preference.
🔶ATR Dynamics: Average True Range (ATR) is a core component of the script. The differential between the smoothed ATR and its EMA is used to plot the main line. This differential, when represented as a percentage of the high-low range, provides insights into volatility.
🔶Squeeze and Release Detection: The script identifies and highlights squeeze and release scenarios based on the crossover and cross-under events between our main line and its smoothed version. Squeezes are potential setups where the market may be consolidating, and releases indicate a potential breakout or breakdown.
🔶Hyper Squeeze Detection: A unique feature that detects instances when the main line is rising consistently over a user-defined period. Hyper squeeze marks areas of extremely low volatility.
Visual Components:
The main line (ATR-based) changes color depending on its position relative to its EMA.
A middle line plotted at zero level which provides a quick visual cue about the main line's position. If the main line is above the zero level, it indicates that the price is squeezing on a longer time horizon, even if the indicator indicates a shorter-term release.
"𝓢" and "𝓡" characters are plotted to represent 'Squeeze' and 'Release' scenarios respectively.
Standard Deviation Bands are plotted to help users gauge the extremity and significance of the signal from the indicator, if the indicator is closer to either the upper or lower deviation bands, this means that statistically, the current value is considered to be more extreme and as it is further away from the mean where the indicator is oscillating at for the majority of the time. Thus indicating that the price has experienced an unusual amount or squeeze or release depending on the value of the indicator.
Usage Guidelines:
☝️Traders can use the script to:
Identify potential consolidation (squeeze) zones.
Gauge potential breakout or breakdown scenarios (release).
Fine-tune their entries and exits based on volatility.
Adjust the various lengths provided in the input for better customization based on individual trading styles and the asset being traded.

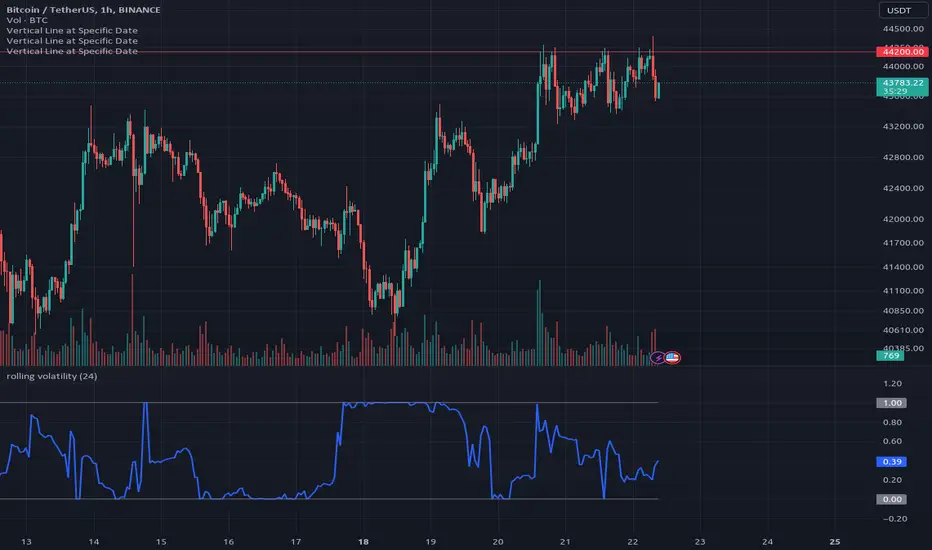
Rolling Volatility Indicator
Description :
The Rolling Volatility indicator calculates the volatility of an asset's price movements over a specified period. It measures the degree of variation in the price series over time, providing insights into the market's potential for price fluctuations.
This indicator utilizes a rolling window approach, computing the volatility by analyzing the logarithmic returns of the asset's price. The user-defined length parameter determines the timeframe for the volatility calculation.
How to Use :
Adjust the "Length" parameter to set the rolling window period for volatility calculation.
Ajust "trading_days" for the sampling period, this is the total number of trading days (usually 252 days for stocks and 365 for crypto)
Higher values for the length parameter will result in a smoother, longer-term view of volatility, while lower values will provide a more reactive, shorter-term perspective.
Volatility levels can assist in identifying periods of increased market activity or potential price changes. Higher volatility may suggest increased risk and potential opportunities, while lower volatility might indicate periods of reduced market activity.
Key Features :
Customizable length parameter for adjusting the calculation period and trading days such that it can also be applied to stock market or any markets.
Visual representation of volatility with a plotted line on the chart.
The Rolling Volatility indicator can be a valuable tool for traders and analysts seeking insights into market volatility trends, aiding in decision-making processes and risk management strategies.
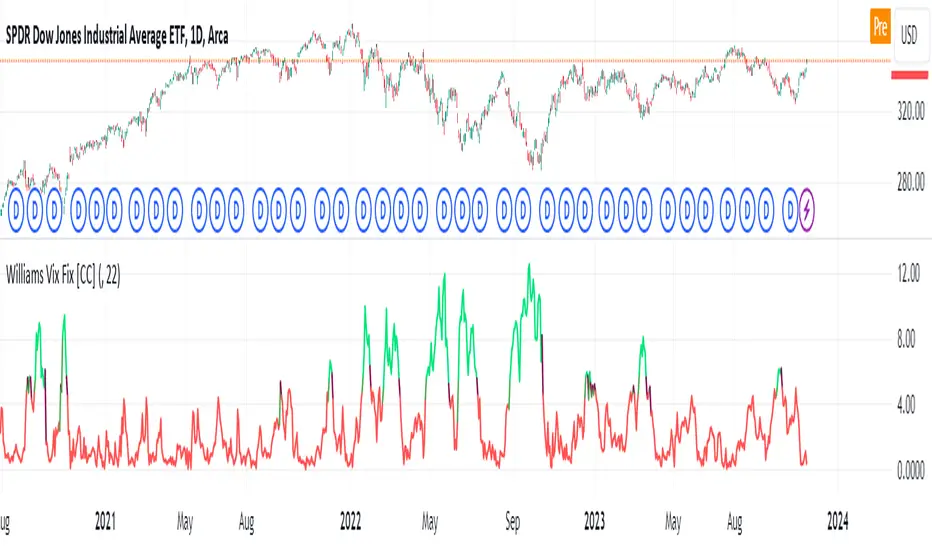
Williams Vix Fix [CC]The Vix Fix indicator was created by Larry Williams and is one of my giant backlog of unpublished scripts which I'm going to start publishing more of. This indicator is a great synthetic version of the classic Volatility Index and can be useful in combination with other indicators to determine when to enter or exit a trade due to the current volatility. The indicator creates this synthetic version of the Volatility Index by a fairly simple formula that subtracts the current low from the highest close over the last 22 days and then divides that result by the same highest close and multiplies by 100 to turn it into a percentage. The 22-day length is used by default since there is a max of 22 trading days in a month but this formula works well for any other timeframe. By itself, this indicator doesn't generate buy or sell signals but generally speaking, you will want to enter or exit a trade when the Vix fix indicator amount spikes and you get an entry or exit signal from another indicator of your choice. Keep in mind that the colors I'm using for this indicator are only a general idea of when volatility is high enough to enter or exit a trade so green colors mean higher volatility and red colors mean low volatility. This is one of the few indicators I have written that don't recommend to buy or sell when the colors change.
This was a custom request from one of my followers so please let me know if you guys have any other script requests you want to see!
Volatility Trend (Zeiierman)█ Overview
The Volatility Trend (Zeiierman) is an indicator designed to help traders identify and analyze market trends based on price volatility. By calculating a dynamic trend line and volatility-adjusted bands, the indicator provides visual cues to understand the current market direction, potential reversal points and volatility.
█ How It Works
The indicator uses a weighted moving average of historical prices to create a responsive trend line that is adjusted for volatility using standard deviation. The indicator sets upper and lower bands at intervals of two standard deviations, acting as markers for potential overbought or oversold conditions. Additionally, by comparing current and previous trend line values, the indicator identifies the trend direction, providing crucial insights for traders.
█ How to Use
Trend Identification
Use the trend line to identify the overall market direction. An upward-sloping line indicates an uptrend, while a downward-sloping line indicates a downtrend.
Volatility Assessment
Use the distance between the upper and lower bands to gauge market volatility. Wider bands indicate higher volatility, while narrower bands indicate lower volatility.
Overbought/Oversold
If the price reaches or exceeds the upper or lower bands, it may be in an overbought or oversold condition, respectively.
█ Settings
Trend Control: Adjusts the sensitivity and smoothness of the trend line. Lower values make the trend more responsive, while higher values make it smoother.
Trend Dynamic: Controls how quickly the trend adjusts to price changes. Higher values result in a slower adjustment.
Volatility: Consists of two parts - the scaling factor for volatility and the sensitivity for volatility adjustment. Adjusting these settings alters the distance between the trend lines and the price, as well as how sensitive the bands are to changes in volatility.
Squeeze Control: Influences the degree to which market squeeze is considered in the calculation, with higher values increasing sensitivity.
Enable Scalping Trend: A toggle that, when activated, makes the indicator focus on short-term trends, which is particularly useful for scalping strategies.
█ Related scripts with the same calculation philosophy
TrendCylinder
TrendSphere
Predictive Trend and Structure
-----------------
Disclaimer
The information contained in my Scripts/Indicators/Ideas/Algos/Systems does not constitute financial advice or a solicitation to buy or sell any securities of any type. I will not accept liability for any loss or damage, including without limitation any loss of profit, which may arise directly or indirectly from the use of or reliance on such information.
All investments involve risk, and the past performance of a security, industry, sector, market, financial product, trading strategy, backtest, or individual's trading does not guarantee future results or returns. Investors are fully responsible for any investment decisions they make. Such decisions should be based solely on an evaluation of their financial circumstances, investment objectives, risk tolerance, and liquidity needs.
My Scripts/Indicators/Ideas/Algos/Systems are only for educational purposes!

K's Reversal Indicator IIIK's Reversal Indicator III is based on the concept of autocorrelation of returns. The main theory is that extreme autocorrelation (trending) that coincide with a technical signals such as one from the RSI, may result in a powerful short-term signal that can be exploited.
The indicator is calculated as follows:
1. Calculate the price differential (returns) as the current price minus the previous price.
2. the correlation between the current return and the return from 14 periods ago using a lookback of 14 periods.
3. Calculate a 14-period RSI on the close prices.
To generate the signals, use the following rules:
* A bullish signal is generated whenever the correlation is above 0.60 while the RSI is below 40.
* A bearish signal is generated whenever the correlation is above 0.60 while the RSI is above 60.

L&S Volatility Index Refurbished█ Introduction
This is my second version of the L&S Volatility Index, hence the name "Refurbished".
The first version can be found at this link:
The reason I released a separate version is because I rewrote the source code from scratch with the aim of both improving the indicator and staying as close as possible to the original concept.
I feel that the first version was somewhat exotic and polluted in relation to the indicator originally described by the authors.
In short, the main idea remains the same, however, the way of presenting the result has been changed, reiterating what was said.
█ CONCEPTS
The L&S Volatility Index measures the volatility of price in relation to a moving average.
The indicator was originally described by Brazilian traders Alexandre Wolwacz (Stormer) and Fábio Figueiredo (Vlad) from L&S Educação Financeira.
Basically, this indicator can be used in two ways:
1. In a mean reversion strategy, when there is an unusual distance from it;
2. In a trend following strategy, when the price is in an acceptable region.
As an indicator of volatility, the greatest utility is shown in first case.
This is because it allows identifying abnormal prices, extremely stretched in relation to an average, including market crashes.
How the calculation is done:
First, the distance of the price from a given average in percentage terms is measured.
Then, the historical average volatility is obtained.
Finally the indicator is calculated through the ratio between the distance and the historical volatility.
According to the description proposed by the creators, when the L&S Volatility Index is above 30 it means that the price is "stretched".
The closer to 100 the more stretched.
When it reaches 0, it means the price is on average.
█ What to look for
Basically, you should look at non-standard prices.
How to identify it?
When the oscillator is outside the Dynamic Zone and/or the Fixed Zone (above 30), it is because the price is stretched.
Nothing on the market is guaranteed.
As with the RSI, it is not because the RSI is overbought or oversold that the price will necessarily go down or up.
It is critical to know when NOT to buy, NOT to sell or NOT to do anything.
It is always important to consider the context.
█ Improvements
The following improvements have been implemented.
It should be noted that these improvements can be disabled, thus using the indicator in the "purest" version, the same as the one conceived by the creators.
Resources:
1. Customization of limits and zones:
2. Customization of the timeframe, which can be different from the current one.
3. Repaint option (prints the indicator in real time even if the bar has not yet closed. This produces more signals).
4. Customization of price inputs. This affects the calculation.
5. Customization of the reference moving average (the moving average used to calculate the price distance).
6. Customization of the historical volatility calculation strategy.
- Accumulated ATR: calculates the historical volatility based on the accumulated ATR.
- Returns: calculates the historical volatility based on the returns of the source.
Both forms of volatility calculation have their specific utilities and applications.
Therefore, it is worthwhile to have both approaches available, and one should not necessarily replace the other.
Each method has its advantages and may be more appropriate in different contexts.
The first approach, using the accumulated ATR, can be useful when you want to take into account the implied volatility of prices over time,
reflecting broader price movements and higher impact events. It can be especially relevant in scenarios where unexpected events can drastically affect prices.
The second approach, using the standard deviation of returns, is more common and traditionally used to measure historical volatility.
It considers the variability of prices relative to their average, providing a more general measure of market volatility.
Therefore, both forms of calculation have their merits and can be useful depending on the context and specific analysis needs.
Having both options available gives users flexibility in choosing the most appropriate volatility measure for the situation at hand.
* When choosing "Accumulated ATR", if the indicator becomes difficult to see, there are 3 possibilities:
a) manually adjust the Fixed Zone value;
b) disable the Fixed Zone and use only the Dynamic Zone;
c) normalize the indicator.
7. Signal line (a moving average of the oscillator).
8. Option to normalize the indicator or not.
9. Colors to facilitate direction interpretation.
Since the L&S is a volatility indicator, it does not show whether the price is rising or falling.
This can sometimes confuse the user.
That said, the idea here is to show certain colors where the price is relative to the average, making it easier to analyze.
10. Alert messages for automations.

Volatility FilterThe "Volatility Filter" script is designed to measure market volatility across two different timeframes and determine whether the market is flat or trending.
It uses custom-tuned versions of four different indicators to measure volatility and distinguish between trending and ranging conditions.
The selected indicators are:
1 - Average Directional Index (ADX) Volatility
2 - Damiani Volameter
3 - Trader Pressure Index (TPI)
4 - Williams Alligator Indicator
The script calculates a filter score for both the current timeframe and a user-specified higher timeframe. It offers two types of filter scores, controlled by the 'FilterType' parameter. The filter score is then visualized on the chart as the main oscillator for the current timeframe and a filled bar for the higher timeframe.
The script utilizes a custom moving average function that provides 17 different ways to calculate a moving average, giving the user extensive flexibility in tailoring the script to their needs.
By using custom indicators and unique score calculation methods across two timeframes, this script provides a comprehensive measure of market volatility, aiding traders in identifying trending and ranging market conditions.
This script also provides two additional parameters for tuning its calculations and output, allowing to adjust the script to any trading style and the characteristics of the market being traded.
1 - Threshold: This parameter sets a threshold that the oscillator needs to surpass for the current market move to be considered as a trend. By adjusting the threshold, traders can control how much volatility is required to register a move as trending. A higher threshold will require more volatility for a trend to be recognized, meaning that the market needs to be moving more strongly for a trend to be identified.
2 - Length: This parameter is used to smooth the oscillator. It determines the number of periods used in the calculation of the moving average of the volatility filter score. A longer length will consider more data points and therefore provide a smoother line, which can be useful in accounting for the fading of trends. When trends start to lose their strength but are still present, a longer length can help in maintaining the recognition of the trend, aiding in making accurate trading decisions.
By adjusting these parameters, traders can fine-tune the script's sensitivity to market volatility and its recognition of trends, providing valuable flexibility in adapting to different market conditions and trading strategies.

Average Range PercentageIt is indicator for average percent range (range from high to low of stock/index price) of N days,
This will help to find high percentage moving stock/index for intraday.

TTP VIX SpyTTP VIX Spy is an indicator that uses data from TVC:VIX to better time entries in the market.
The assumption used is that when the VIX is coming down from the top of its range then the risk on assets can move to the upside and when the VIX is is pushing higher there's a high likelihood or risk on assets going down.
This indicator observes the momentum of VIX using MACD. It offers two different signals both for longs and shorts: signal 1 and 2.
Signal 1 is activate when the begging of a new trend for the VIX is confirmed.
Signal 2 is activated when the VIX pulls back from an extreme value.
You can configure the parameters of the internal super trend and the look back for the slope applied to price and RSIs.
The indicator offers the following filter parameters:
- Price RSI slope: it filters signals that have RSI slope pointing in the opposite direction of the signal.
- Counter trend: it filters signals that are not counter trending super trend.
- Wide BBW: it filters signals that happen when there hasn't been high price volatility
- Price slope: it filters signals when the price is not pointing in the direction of the signal (buy: up, sell: down)
- VIX RSI filter: it filters VIX RSI values overextended. MACD can be in the right range, but sometimes RSI contradicts it. By default is OFF since it can cause false negatives.
- Working days only: it filters signals that occur in the weekend.
The colours below the price action show how the VIX momentum is changing. Transitions from red into pink and then green show how the fear is fading which tends to lead to lead to bullish moves, and the opposite when the transitions are from green to red.
Performance and initial thoughts.
I have tried VIX Spy on both BINANCE:BTCUSDT.P and BINANCE:ETHUSDT.P and it seems to offer a decent win ratio. As you can see I had to add many filter to remove bad entries and left toggles available to decide which ones you want to use.
I tried the signal in the 4H, 1H and 15min with mixed results. I tend to incline for the results in the 1H.
VIX signal offers a backtestable stream and alerts both for signals 1 and 2.

AggBands (v1) [qrsq]The "AggBands" indicator is a custom trading indicator designed to provide a consolidated view of the price action across multiple assets or trading pairs. It combines the price data from multiple tickers and calculates an aggregated price using user-defined weights for each ticker.
The indicator starts by defining the tickers to be included in the aggregation. You can choose from predefined configurations such as "BTC PAIRS," "CRYPTO TOTAL MARKET CAP," "TOP 5 PAIRS," "TOP 5 MEMECOINS," "SPX," "DXY," or "FANG." Each configuration includes specific tickers or indices relevant to the chosen category.
The indicator then fetches the closing, high, and low prices for each ticker and applies the user-defined weights to calculate the aggregated prices. The aggregated prices are normalized within a specified length to provide a consistent scale across different assets or pairs.
Next, the indicator calculates the midpoint, which is the average of the highest high and lowest low of the aggregated prices over a specified aggregation period.
To assess the volatility, the indicator calculates the price range and applies the Average True Range (ATR) indicator to determine the volatility value. The standard deviation is then computed using the price range and aggregation period, with an additional scaling factor applied to the volatility value.
Based on the standard deviation, the indicator generates multiple bands above and below the midpoint. By default, three standard deviation bands are calculated, but the user can choose between one and five bands. The upper and lower bands are smoothed using various moving average (MA) types, such as Simple Moving Average (SMA), Exponential Moving Average (EMA), Smoothed Moving Average (SMMA/RMA), Weighted Moving Average (WMA), Volume Weighted Moving Average (VWMA), Volume Weighted Average Price (VWAP), or Arnaud Legoux Moving Average (ALMA). The user can also adjust the length, offset, and sigma parameters for the moving averages.
The indicator can optionally smooth the midpoint, upper bands, and lower bands using a separate set of moving average parameters.
The indicator can be useful for traders and analysts who want to gain a consolidated view of price movements across multiple assets or trading pairs. It helps identify trends, volatility, and potential support and resistance levels based on the aggregated price and standard deviation bands. Traders can use this information to make informed decisions about trading strategies, risk management, and market analysis.

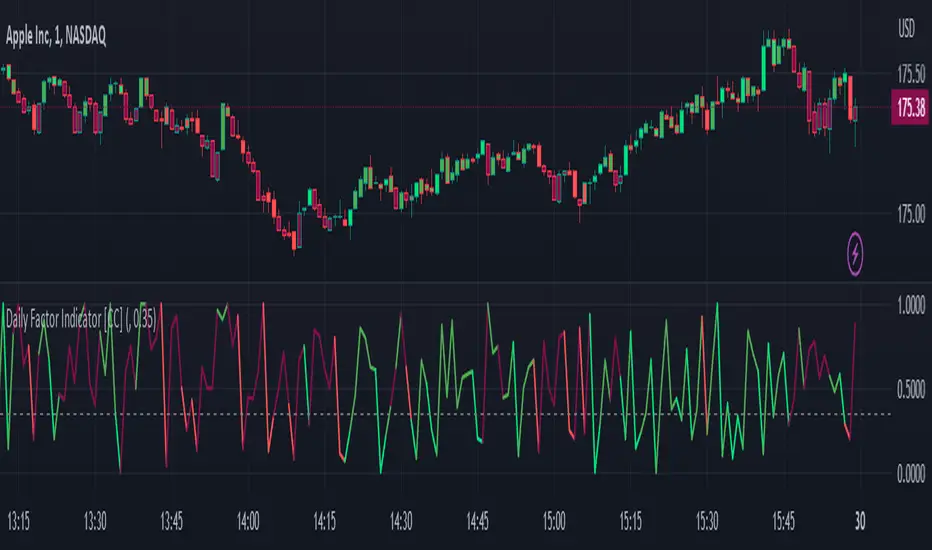
Daily Factor Indicator [CC]The Daily Factor Indicator was created by Andrea Unger (Stocks and Commodities Jun 2023 pgs 26-31), and this is a new volatility indicator that compares the body, which is the absolute difference between the previous open and previous close, and the range which is the difference between the previous high and previous low. The indicator is calculated by dividing the body and range to determine the volatility for the previous bar. This indicator will range between 0 and 1. Values closer to 1 mean very high volatility, and values closer to 0 mean very low volatility. I have introduced a simple moving average strategy to decide buy or sell signals and colors. Darker colors mean the indicator is above the threshold level, and lighter colors mean the indicator is below the threshold level. Colors are shades of green when the price is above the moving average and shades of red when the price is below the moving average. Feel free to try out your own threshold level and general buy and sell signals.
Let me know if there are any other indicators you would like me to publish!