RG - Volume Spike DetectorRG - Volume Spike Detector is a comprehensive volume analysis tool designed to help traders identify significant volume activity across different tickers on TradingView. This indicator not only detects overall volume spikes and percentage changes but also approximates and analyzes buying and selling volume separately, providing valuable insights into market dynamics. With customizable parameters, visual cues, and built-in alerts, it's suitable for traders of all levels looking to monitor volume-based market movements.
Features
Volume Spike Detection:
Identifies when total volume exceeds a user-defined multiple of its moving average (default: 2x).
Separate detection for buying and selling volume spikes based on their respective moving averages.
Volume Change Analysis:
Calculates and displays the percentage change in total volume from the previous bar.
Highlights significant increases (>50%) or decreases (<-50%) with alert options.
Buy/Sell Volume Approximation:
Estimates buying and selling volume using price movement and range:
Up bars: Buying volume ≈ volume * (close - low)/(high - low)
Down bars: Selling volume ≈ volume * (close - low)/(high - low)
Handles edge cases (e.g., high = low) to ensure accurate calculations.
Ideal For
Day traders monitoring sudden volume surges
Swing traders analyzing volume trends
Market analysts studying buying vs. selling pressure
This indicator empowers traders with a robust tool to track volume dynamics, offering both visual clarity and actionable alerts for informed decision-making.
Volume-spike

Volume CalendarDescription:
The indicator displays a calendar with Volume data for up to 6 last months. It is designed to work on any timeframe, but works best on Daily and below. It is also consistent in that it displays the same data even if you go to lower timeframes like 5 minutes (even though the data is used is Daily).
Features:
- displays volume data for last N months (volume, volume change, % of weekly, monthly and yearly volume)
- display total volume for each month
- display monthly sentiment
- find dates with volume spikes
Inputs:
- Number of months -> how many last months of data to display (from 1 to 6)
- Volume Type -> display only Bullish, only Bearish or all volume
- Cell color is based on -> Volume - the brighter the cell the higher volume was on that day; Volume Change - the brighter the cell the higher was the volume change that day; Volume Spike - the brighter the cell the higher was volume spike that day (volume spike is based on volume being above its average over last N candles)
- Cell color timeframe -> Weekly - the cell color is calculated comparing volume of that cell with weekly volume; Monthly - comparing volume with monthly volume
- Use volume for sentiment -> take the volume into account when calculating monthly sentiment (otherwise calculate it based on number of Bullish and Bearish days in the month)
- Spike Average Period -> period of the moving average used for spike calculation
- Spike Threshold -> current volume must be this many times greater than the average for it to be considered a spike
- Table Size -> size of the table
- Theme -> colouring of the table

Volume SpikeDetect current bar's volume is at least Ratio times than average volume of previous "Look back" bars.

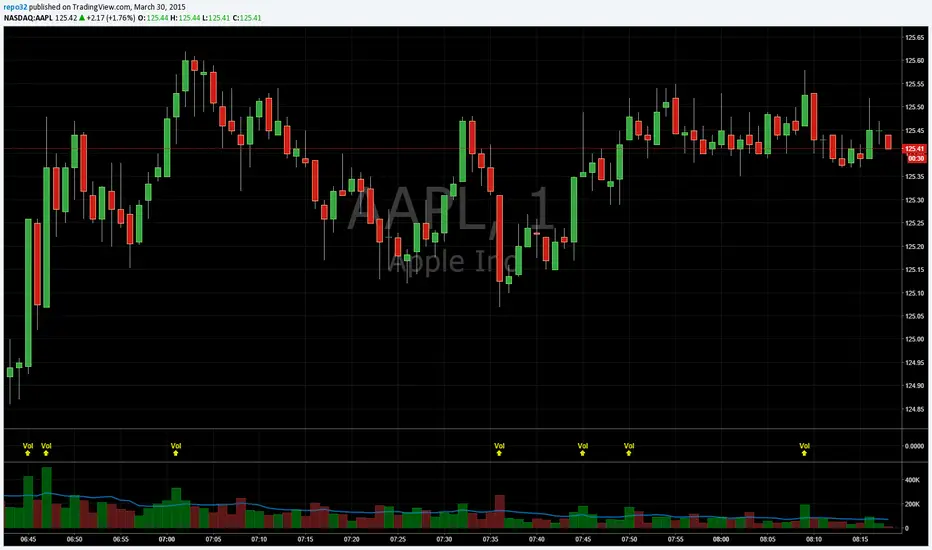
Volume BombI am republishing to use a clean chart. Previous one had too much of a mess. Idea for TradingView: Please allow us to change out the charts after publishing.
I like to know when volume spikes (only when it spikes). I am not interested in seeing the rest of the volume bars. I created this indicator to show me when it explodes (i.e. the name "Volume Bomb" , plus it sounds cool).
This indicator only shows you when volume exceeds the EMA of volume by whatever multiplier you set.
Default settings are the current volume with 10 EMA. Yellow arrowup will appear when volume is at 1.5x the 10 EMA.
Adjust it to your liking and particular stock.