Volume+The enhanced Volume+ Indicator is a valuable tool that builds upon the traditional Volume indicator by incorporating a technique known as linear prediction.
In traditional Volume analysis, the volume data for a bar is only known once the bar has closed. However, with the enhanced Volume+ Indicator, we utilize linear prediction to estimate the closing volume of the k-bar before it actually closes. This estimation is based on historical volume observed in the market.
By employing this indicator, traders and investors can gain an early insight into the potential volume of the current bar, even before it concludes. This can be particularly useful for those who wish to make informed decisions based on volume analysis and its impact on price movements.
===========================中文版本===========================
增强的Volume+指标是一个有价值的工具,它通过结合一种称为线性预测的技术建立在传统成交量指标的基础上。
在传统的成交量分析中,只有在柱线收盘后才能知道柱线的成交量数据。然而,通过增强的Volume+指标,我们利用线性预测来估计 k 柱实际收盘前的收盘成交量。该估计基于市场观察到的历史交易量。
通过使用该指标,交易者和投资者可以在k柱结束之前就尽早了解当前柱的潜在交易量。对于那些希望根据交易量分析及其对价格变动的影响做出明智决策的人来说,这尤其有用。
Indicatore volume

Volume Change Indicator 0.1 [PATREND]
(Volume Change Indicator)
It is an analytical tool that studies the trading volume and its changes.
This indicator uses the Simple Moving Average (SMA) to calculate the average volume for a specific period of time.
Only candles that meet the required conditions are determined when the trading volume is greater than or equal to the calculated average.
This means that the indicator identifies a volume candle only when there is a significant change in trading volume compared to the average.
This indicator is distinguished from other similar indicators in that it allows the user to determine the required percentage of change as an additional condition for determining the volume candle.
If the conditions are correct, the indicator will display a diamond below the candle that meets the requirements specified by the user.
The indicator also displays lines above and below the candle and places "A" and "B" marks next to them to determine the start and end points.
__________________________________
(Volume Change Indicator)
It is a useful analytical tool for traders who rely on volume analysis strategies in their trading decisions.
This indicator helps traders identify important volume candles and search for trading opportunities more accurately.
Traders can use this indicator to determine trends and search for potential entry and exit points.
The indicator helps determine when there is a significant change in trading volume compared to the average, indicating a possible change in direction.
In general
This indicator benefits traders who use volume analysis strategies in their trading decisions and who want additional information about trading volume and its changes.
It can also be used for all markets and on different time frames.
_________________________________
Settings:
1. The user is allowed to determine whether they want to display the indicator through the "Show Indicator" box.
2. The user is allowed to determine the required percentage of change through the "Percent Change" box.
3. The user is allowed to determine the type of candles they want to display (Bearish, Bullish, both) through the "Candle Type" box.
4. The user is allowed to calculate the average candle volume using the "Average Vol" box.
5. The user is allowed to determine the length of lines and number of lines they want to display through "Max Lines" and "Line Length" boxes.
_________________________________
We hope you find (Volume Change Indicator) useful in your analysis.
Feel free to try this indicator and customize its settings to meet your trading needs.
We look forward to seeing your opinions and comments on this indicator.
______________________________________________________________________________________________________
(Volume Change Indicator)
هو أداة تحليلية تعمل على دراسة حجم التداول وتغيراته.
يستخدم هذا المؤشر متوسط الحجم المتحرك (SMA) لحساب متوسط الحجم لفترة زمنية معينة.
يتم تحديد الشموع التي تلبي الشروط المطلوبة فقط عندما يكون حجم التداول أكبر من أو يساوي المتوسط المحسوب.
هذا يعني أن المؤشر يحدد شمعة الكميات فقط عندما يكون هناك تغير كبير في حجم التداول مقارنة بالمتوسط.
يتميز هذا المؤشر عن غيره من موشرات الممثاله بأنه يتيح للمستخدم تحديد النسبة المئوية المطلوبة للتغيير كشرط إضافي لتحديد شمعة الكميات.
إذا كانت الظروف صحيحة، فسيعرض المؤشر ماسًا أسفل الشمعة التي تلبي المتطلبات المحددة من قبل المستخدم.
كما يعرض المؤشر خطوطًا فوق وتحت الشمعة ويضع علامتي "A" و "B" بجانبهما لتحديد نقاط البداية والنهاية.
________________________________________
(Volume Change Indicator)
هو أداة تحليلية مفيدة للمتداولين الذين يعتمدون على استراتيجيات تحليل الحجم في قراراتهم التداولية.
يساعد هذا المؤشر المتداولين على تحديد شموع الكميات المهمة والبحث عن فرص تداولية بشكل أكثر دقة.
يمكن للمتداولين استخدام هذا المؤشر لتحديد الاتجاهات والبحث عن نقاط الإدخال والخروج المحتملة.
يساعد المؤشر على تحديد متى يكون هناك تغير كبير في حجم التداول مقارنة بالمتوسط، مما يشير إلى احتمالية حدوث تغير في الاتجاه.
In general
يستفيد من هذا المؤشر المتداولون الذين يستخدمون استراتيجيات تحليل الحجم في قراراتهم التداولية والذين يرغبون في الحصول على معلومات إضافية حول حجم التداول وتغيراته.
كما يمكن استخدامة لجميع الاسواق وعلى مختلف الفواصل الزمنية .
_________________________________________
Settings:
1. يُتيح للمستخدم تحديد ما إذا كان يرغب في عرض المؤشر من خلال خانة "Show Indicator".
2. يُتيح للمستخدم تحديد النسبة المئوية المطلوبة للتغير من خلال خانة "Percent Change".
3. يُتيح للمستخدم تحديد نوع الشموع التي يرغب في عرضها (Bearish, Bullish, both) من خلال خانة "Candle Type".
4. يُتيح للمستخدم حساب متوسط حجم الشموع باستخدام خانة "Average Vol".
5. يُتيح للمستخدم تحديد طول الخطوط وعدد الخطوط التي يرغب في عرضها من خلال خانات "Max Lines" و "Line Length".
_________________________________________
نأمل أن تجدواه مفيدًا في تحليلاتكم .
لا تترددوا في تجربة هذا المؤشر وتخصيص إعداداته لتلبية احتياجاتكم التداولية.
نتطلع إلى رؤية آرائكم وتعليقاتكم حول هذا المؤشر.

Price & Volume Profile (Expo)█ Overview
The Price & Volume Profile provides a holistic perspective on market dynamics by simultaneously tracking price action and trading volume across a range of price levels. So it is not only a volume-based indicator but also a price-based one. In addition to illustrating volume distribution, it quantifies how frequently the price has fallen within a particular range, thus offering a holistic perspective on market dynamics.
This unique and comprehensive approach to market analysis by considering both price action and trading volume, two crucial dimensions of market activity. Its distinctive methodology offers several advantages:
Holistic Market View: By simultaneously tracking the frequency of specific price ranges (Price Profile) and the volume traded at those ranges (Volume Profile), this indicator provides a more complete picture of market behavior. It shows not only where the market is trading but also how much it's trading, reflecting both price acceptance levels and market participation intensity.
Point of Control (POC): The POC, as highlighted by this indicator, serves as a significant reference point for traders. It identifies the price level with the highest trading activity, thus indicating a strong consensus among market participants about the asset's fair value. Observing how price interacts with the POC can offer valuable insights into market sentiment and potential trend reversals.
Support and Resistance Levels: Price levels with high trading activity often act as support or resistance in future price movements. The indicator visually represents these levels, enabling traders to anticipate potential price reactions.
Price Profile
Price and Volume Profile
█ Calculations
The algorithm analyzes both trade frequency and volume across different price levels. It identifies these levels within the visible chart range, then examines each bar to determine if the selected price falls within these levels. If so, it increases a counter and adds the trading volume. This process repeats across the visible range and is visualized as a horizontal histogram, each bar representing a price level and the bar length reflecting trade frequency and volume. Additionally, it calculates the Point of Control (POC), signifying the price level with the highest activity.
In summary: The histogram presents a dual perspective - not only the traded volume at each price level but also the frequency of the price hitting each range. The longer the bar, the more times the price has frequented that specific range, revealing key insights into price behavior and acceptance levels. These frequently visited areas often emerge as strong support or resistance zones, helping traders navigate market movements.
Please note that the indicator adjusts to the visible price range, making it adaptable to changing market conditions. This dynamic analysis can provide more relevant and timely information than static indicators.
█ How to use
This indicator is beneficial for traders as it offers insights into the distribution of trading activity across different price levels. It helps identify key areas of support and resistance and gives a visual representation of market sentiment and liquidity.
The point of control (POC) , which is the price level with the highest traded volume or frequency count, becomes even more crucial in this context. It marks the price at which the most trading activity occurred, signaling a strong consensus among market participants about the asset's fair value. If the market price deviates significantly from the POC, it could suggest an overbought or oversold condition, potentially leading to a price reversion.
Fair Price Areas/gaps are specific price levels or zones where an asset has spent limited time in the past. These areas are considered interesting or significant because they may have an impact on future price action.
Similar to the concept of fair value gaps, which refers to discrepancies between an asset's market price and its estimated intrinsic value, Fair Price Areas/gaps focus on price levels that have been relatively underutilized in terms of trading activity. When an asset's price reaches a Fair Price Area/gap, traders and investors pay attention because they expect the price to react in some way. The rationale behind this concept is that price tends to gravitate towards areas where it has spent less time in the past, as the market perceives them as significant levels.
█ Settings
The indicator is customizable, allowing users to define the number of price levels (rows), the offset, the data source, and whether to display volume or frequency count. It also adjusts dynamically to the visible price range on the chart, ensuring that the analysis remains relevant and timely with changing market conditions.
Source: The price to use for the calculation. Typically, this is the closing price. By considering the user-selected Source (typically the closing price), the indicator determines the frequency with which the price lands within each designated price level (row) over the selected period. In essence, the indicator provides a count of bars where the Source price falls within each range, essentially creating a "Price Profile."
Row Size: The number of price levels (rows) to divide the visible price range into.
Display: Choose whether to display the number of bars ("Counter") or the total volume ("Volume") for each price level.
Offset: The distance of the histogram from the price chart.
Point of Control (POC): If enabled, the indicator will highlight the price level with the most activity.
-----------------
Disclaimer
The information contained in my Scripts/Indicators/Ideas/Algos/Systems does not constitute financial advice or a solicitation to buy or sell any securities of any type. I will not accept liability for any loss or damage, including without limitation any loss of profit, which may arise directly or indirectly from the use of or reliance on such information.
All investments involve risk, and the past performance of a security, industry, sector, market, financial product, trading strategy, backtest, or individual's trading does not guarantee future results or returns. Investors are fully responsible for any investment decisions they make. Such decisions should be based solely on an evaluation of their financial circumstances, investment objectives, risk tolerance, and liquidity needs.
My Scripts/Indicators/Ideas/Algos/Systems are only for educational purposes!

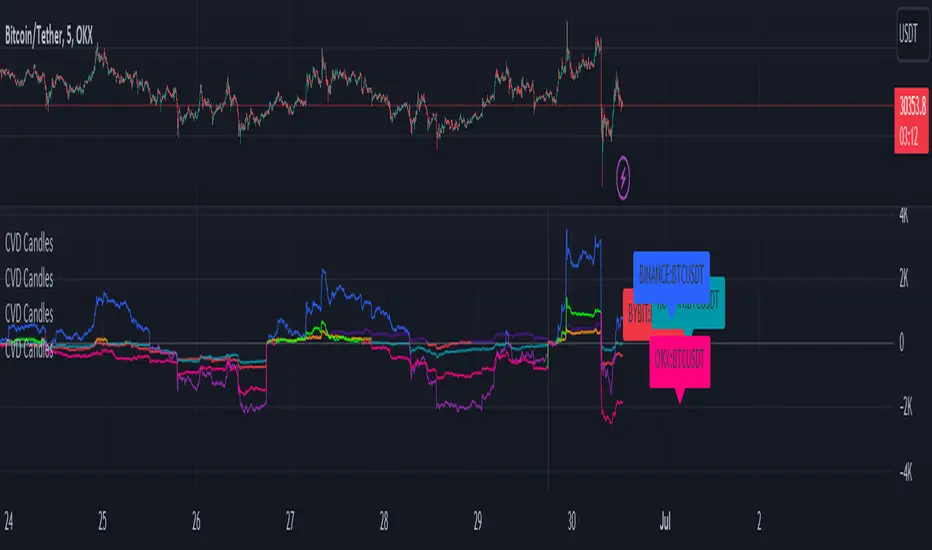
CVD+ - Multi Symbol Cumulative Volume DeltaEdit of TradingView's LTF CVD
TradingView's CVD is already the most accurate CVD on the platform because of the LTF data. The purpose of the edit is to provide the ability to compare volume flow between multiple exchanges, futures & spot, multiple symbols or any other potential use case. All in single layout or even a single pane.
Added features:
- Option to manually select a symbol from which to calculate the LTF CVD
- Option to normalize the selected symbol's CVD to the chart's symbol's CVD (Useful when you want to compare futures and spot on the same pane)
- Label that displays the selected symbol's name and exchange
- Changed presets to plot the CVD line as the predetermined option
All of TV's original features remain the same.
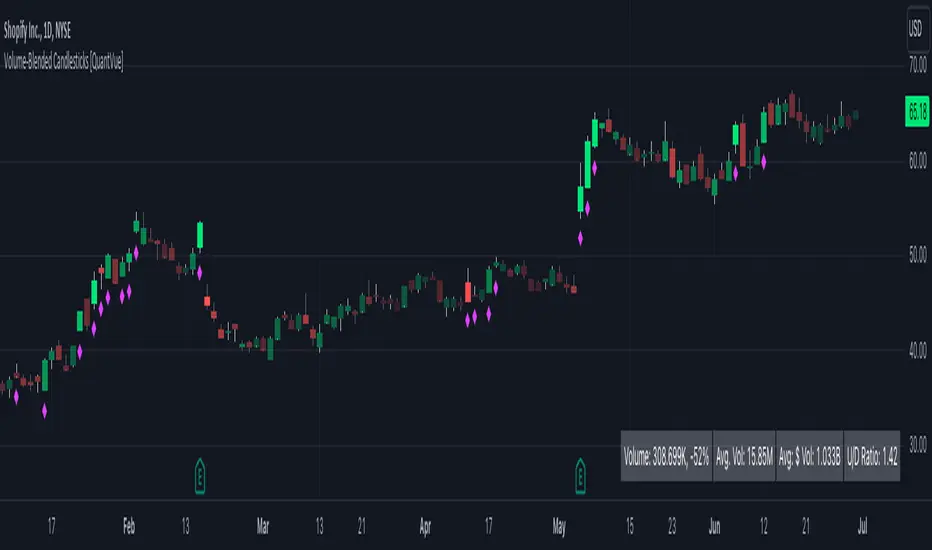
Volume-Blended Candlesticks [QuantVue]Introducing the Volume-Blended Candlestick Indicator, a powerful tool that seamlessly integrates volume information with candlesticks, providing you with a comprehensive view of market dynamics in a single glance.
The Volume-Blended Candlestick Indicator employs a unique approach of projecting volume totals by calculating the total volume traded per second and comparing it to the time left in the session as well as the historical average length selected by the user.
The indicator then dynamically adjusts the opacity of the candlestick colors based on the intensity of the projected volume. As volume intensifies, the candlestick colors become more pronounced, while low volume will cause colors to fade allowing you to visually perceive the level of buying or selling.
One of the standout features of the Volume-Blended Candlestick Indicator is its ability to identify pocket pivots. A pocket pivot is an up day with volume greater than any of the down days volume in the past 10 days. By highlighting these pocket pivots on your chart, the indicator helps you identify potential stealth accumulation.
In addition to blending volume with candlesticks and spotting pocket pivots, this versatile indicator provides you with an insightful table displaying key volume metrics. The table includes the average volume, average dollar volume, and the up-down volume ratio, allowing you to get a clear picture of buying and selling pressure.
Settings Include:
🔹Sensitivty Level: Normal, More, Less
🔹Volume MA Length
🔹Toggle Color based on previous close
🔹Show or hide volume info
🔹Chose candlestick colors
🔹Show or hide pocket pivots
🔹Show or hide volume info table
Don't hesitate to reach out with any questions or concerns.
We hope you enjoy!
Cheers.
Volume Orderbook (Expo)█ Overview
The Volume Orderbook indicator is a volume analysis tool that visually resembles an order book. It's used for displaying trading volume data in a way that may be easier to interpret or more intuitive for certain traders, especially those familiar with order book analysis.
This indicator aggregate and display the total trading volume at different price levels over the entire range of data available on the chart, similar to how an order book displays current buy and sell orders at different price levels. However, unlike a real-time order book, it only considers historical trading data, not current bid and ask orders. This provides a 'historical order book' of sorts, indicating where most trading activities have taken place.
Summary
This is a volume-based indicator that shows the volume traded at specific price levels, highlighting areas of high and low activity.
█ Calculations
The algorithm operates by calculating the cumulative volume traded in each specific price zone within the range of data displayed on the chart. The length of each horizontal bar corresponds to the total volume of trades that occurred within that particular price zone.
In essence, when the price is in a specific zone, the volume is added to the bar representing that zone. A thicker bar implies a larger price zone, meaning that more volume is accumulated within that bar. Therefore, the thickness of the bar visually indicates the amount of trading activity that took place within the associated price zone.
█ How to use
The Volume Orderbook indicator serves as a beneficial tool for traders by identifying key price levels with a significant amount of trading activity. These high-volume areas could represent potential support or resistance levels due to the large number of orders situated there. The indicator's ability to spotlight these zones might be particularly advantageous in pinpointing breakouts or breakdowns when prices move beyond these high-volume regions. Moreover, the indicator could also assist traders in recognizing anomalies, such as when an unusually large volume of trades occurs at unconventional price levels.
Identify Key Price Levels: The indicator highlights high-volume areas where a significant number of trades have occurred, which could act as potential support or resistance levels. This is based on the notion that many traders have established positions at these prices, so these levels may serve as significant areas for market activity in the future.
Volume Nodes: These are the peaks (high-volume areas) and troughs (low-volume areas) seen on the indicator. High-volume nodes represent price levels at which a large amount of volume has been traded, typically areas of strong support or resistance. Conversely, low-volume nodes, where very little volume has been traded, indicate price levels that traders have shown little interest in the past and could potentially act as barriers to price. It's important to note that while high trading volume can imply significant market interest, it doesn't always mean the price will stop or reverse at these levels. Sometimes, prices can quickly move through high-volume areas if there are no current orders (demand) to match with the new orders (supply).
Analyze Market Psychology: The distribution of volume across different price levels can provide insights into the market's psychology, revealing the balance of power between buyers and sellers.
Highlight Potential Reversal Points: The indicator can help identify price levels with high traded volume where the market might be more likely to reverse since these levels have previously attracted significant interest from traders.
Validate Breakouts or Breakdowns: If the price moves convincingly past a high-volume node, it could indicate a strong trend, suggesting a potential breakout or breakdown. Conversely, if the price struggles to move past a high-volume node, it could suggest that the trend is weak and might potentially reverse.
Trade Reversals: High-volume areas could also indicate potential turning points in the market. If the price reaches these levels and then starts to move away, it might suggest a possible price reversal.
Confirm Other Signals: As with all technical indicators, the "Volume Orderbook" should ideally be used in conjunction with other forms of technical and fundamental analysis to confirm signals and increase the odds of successful trades.
Summary
The Volume Orderbook indicator allows traders to identify key price levels, analyze market psychology, highlight potential reversal points, validate breakouts or breakdowns, confirm other trading signals, and anticipate possible trade reversals, thereby serving as a robust tool for trading analysis.
█ Settings
Source: The user can select the source, the default of which is "close." This implies that volume is added to the volume order book when the closing price falls within a specific zone. Users can modify this to any indicator present on their chart. For example, if it's set to an SMA (Simple Moving Average) of 20, the volume will be added to the volume order book when the SMA 20 falls within the specific zone.
Rows and width: These settings allow users to adjust the representation of volume order book zones. "ROWS" pertains to the number of volume order book zones displayed, while "WIDTH" refers to the breadth of each zone.
Table and Grid: These settings allow traders to customize the Volume order-book's position and appearance. By adjusting the "left" parameter, users can shift the position of the Volume order book on the chart; a higher value pushes the order book further to the right. Additionally, users can enable "Table Border" and "Table Grid" options to add gridlines or borders to the Volume order book for easier viewing and interpretation.
-----------------
Disclaimer
The information contained in my Scripts/Indicators/Ideas/Algos/Systems does not constitute financial advice or a solicitation to buy or sell any securities of any type. I will not accept liability for any loss or damage, including without limitation any loss of profit, which may arise directly or indirectly from the use of or reliance on such information.
All investments involve risk, and the past performance of a security, industry, sector, market, financial product, trading strategy, backtest, or individual's trading does not guarantee future results or returns. Investors are fully responsible for any investment decisions they make. Such decisions should be based solely on an evaluation of their financial circumstances, investment objectives, risk tolerance, and liquidity needs.
My Scripts/Indicators/Ideas/Algos/Systems are only for educational purposes!

Volume-Weighted Trend Filter CloudThe Volume-Weighted Trend Filter Cloud is a powerful technical analysis tool designed to identify trend directions and potential buy/sell signals in a trading instrument. The indicator combines volume-weighted moving averages, average true range (ATR), and cloud plotting techniques to provide a comprehensive view of the market trend.
Inputs:
Length: Specifies the length of Algo used for trend analysis. Default value is 14.
Multiplier: Adjusts the width of the trend filter bands based on the ATR. Default value is 2.0.
Tenkan-sen Period: Defines the period for calculating the Tenkan-sen line. Default value is 200.
Kijun-sen Period: Sets the period for calculating the Kijun-sen line. Default value is 400.
Senkou Span Period: Determines the period for calculating the Senkou Span A and Senkou Span B lines. Default value is 600.
Calculation:
Average True Range (ATR): The indicator calculates the ATR based on the specified moving average length.
Trend Filter Bands: The basic upper and lower bands are calculated using the highest high and lowest low values, respectively, along with the multiplier and ATR. These bands are then adjusted to create the final upper and lower bands, taking into account the previous values.
Trend Direction: The indicator determines the trend direction by comparing the close price with the lower and upper bands. If the close price is above the lower band, it indicates an upward trend (trendUp = 1). If the close price is below the upper band, it indicates a downward trend (trendDown = 1).
Volume-Weighted Z-Score: The indicator calculates the volume-weighted Z-Score by determining the mean and standard deviation of the close price with volume weighting. The Z-Score represents the deviation of the close price from the mean in terms of standard deviations.
Tenkan-sen, Kijun-sen, Senkou Span A, and Senkou Span B: These lines are calculated using the respective periods and the average of the high and low prices.
Sigmoid Transformation: The indicator applies the sigmoid function to the Z-Score values to obtain sigmoid-transformed values for open, high, low, and close prices. These transformed values help in visualizing the trend strength.
Plotting:
Trend Filter: The trend filter is plotted as a line that changes color based on the trend direction. The lower band is displayed for an upward trend, while the upper band is displayed for a downward trend.
Trend Cloud: The cloud plot represents the Senkou Span A and Senkou Span B lines. The cloud color changes based on the trend direction, providing a visual representation of the market trend.
Buy and Sell Signals: The indicator generates buy and sell signals based on the crossover of fast and slow moving averages, Z-Score values, trend direction, and other conditions. These signals are labeled on the chart, indicating potential entry points for traders.
The indicator generates buy and sell signals based on specific conditions, including the intersection of fast and slow moving averages, Z-Score values, trend direction, and more.
Buy signals are described as a "buy signal" on the chart, which indicates potential entry points for buy trades.
Sell signals are described as a "sell signal", which indicates potential entry points for sell trades. The signals in light color represent that they are signals in the opposite direction of the cloud that can be considered as exit points

REVE Cohorts - Range Extension Volume Expansion CohortsREVE Cohorts stands for Range Extensions Volume Expansions Cohorts.
Volume is divided in four cohorts, these are depicted in the middle band with colors and histogram spikes.
0-80 percent i.e. low volumes; these get a green color and a narrow histogram bar
80-120 percent, normal volumes, these get a blue color and a narrow histogram bar
120-200 percent, high volume, these get an orange color and a wide histogram bar
200 and more percent is extreme volume, maroon color and wide bar.
All histogram bars have the same length. They point to the exact candle where the volume occurs.
Range is divided in two cohorts, these are depicted as candles above and below the middle band.
0-120 percent: small and normal range, depicted as single size, square candles
120 percent and more, wide range depicted as double size, rectangular candles.
The range candles are placed and colored according to the Advanced Price Algorithm (published script). If the trend is up, the candles are in the uptrend area, which is above the volume band, , downtrend candles below in the downtrend area. Dark blue candles depict a price movement which confirms the uptrend, these are of course in the uptrend area. In this area are also light red candles with a blue border, these depict a faltering price movement countering the uptrend. In the downtrend area, which is below the volume band, are red candles which depict a price movement confirming the downtrend and light blue candles with a red border depicting price movement countering the downtrend. A trend in the Advanced Price Algorithm is in equal to the direction of a simple moving average with the same lookback. The indicator has the same lagging.as this SMA.
Signals are placed in the vacated spaces, e.g. during an uptrend the downtrend area is vacated.
There are six signals, which arise as follows:
1 Two blue triangles up on top of each other: high or extreme volume in combination with wide range confirming uptrend. This indicates strong and effective up pressure in uptrend
2 Two pink tringles down on top of each other: high or extreme volume in combination with wide range down confirming downtrend. This indicates strong and effective down pressure in downtrend
3 Blue square above pink down triangle down: extreme volume in combination with wide range countering uptrend. This indicates a change of heart, down trend is imminent, e.g. during a reversal pattern. Down Pressure in uptrend
4 Pink square below blue triangle up: extreme volume in combination with wide range countering downtrend. This indicates a change of heart, reversal to uptrend is imminent. Up Pressure in downtrend
5 single blue square: a. extreme volume in combination with small range confirming uptrend, b. extreme volume in combination with small range countering downtrend, c. high volume in combination with wide range countering uptrend. This indicates halting upward price movement, occurs often at tops or during distribution periods. Unresolved pressure in uptrend
6 Single pink square: a extreme volume in combination with small range confirming downtrend, b extreme volume in combination with small range countering uptrend, c high volume in combination with wide range countering downtrend. This indicated halting downward price movement. Occurs often at bottoms or during accumulation periods. Unresolved pressure in downtrend.
The signals 5 and 6 are introduced to prevent flipping of signals into their opposite when the lookback is changed. Now signals may only change from unresolved in directional or vice versa. Signals 3 and 4 were introduced to make sure that all occurrences of extreme volume will result in a signal. Occurrences of wide volume only partly lead to a signal.
Use of REVE Cohorts.
This is the indicator for volume-range analyses that I always wanted to have. Now that I managed to create it, I put it in all my charts, it is often the first part I look at, In my momentum investment system I use it primarily in the layout for following open positions. It helps me a lot to decide whether to close or hold a position. The advantage over my previous attempts to create a REVE indicator (published scripts), is that this version is concise because it reports and classifies all possible volumes and ranges, you see periods of drying out of volume, sequences of falter candles, occurrences of high morning volume, warning and confirming signals.. The assessment by script whether some volume should be considered low, normal, high or extreme gives an edge over using the standard volume bars.
Settings of REVE Cohorts
The default setting for lookback is ‘script sets lookback’ I put this in my indicators because I want them harmonized, the script sets lookback according to timeframe. The tooltip informs which lookback will be set at which timeframe, you can enable a feedback label to show the current lookback. If you switch ‘script sets lookback’ off, you can set your own preferred user lookback. The script self-adapts its settings in such a way that it will show up from the very first bar of historical chart data, it adds volume starting at the fourth bar.
You can switch off volume cohorts, only range candles will show while the middle band disappears. Signals will remain if volume is present in the data. Some Instruments have no volume data, e.g. SPX-S&P 500 Index,, then only range candles will be shown.
Colors can be adapted in the inputs. Because the script calculates matching colors with more transparency it is advised to use 100 percent opacity in these settings.
Take care, Eykpunter

Enhanced Volume By TradeINskiFeatures available and logic behind it,
Section - Moving Average
- This will plot a simple moving average line.
- In Settings {Input Tab} "MA Period" can be changed. Default value is 20.
- In Settings {Style Tab} "MA Line" can be ON/OFF by check mark, color and type can be changed. Default "ON", "Line" and "White".
Section - Bar Color
1. Up color
- When Up day, the color of column is green.
- In settings {Input Tab} Color can be changed. Default "Green".
- In settings {Style Tab} Type of volume indicator can be changed such as dots and area etc. Default "Columns".
2. Down color
- When Down day then the color of column is red.
- In settings {Input Tab} Color can be changed. Default color "Red".
3. Relatively High Volume
-When Up day plus that day volume is 2.5 times the average volume then its Relatively High Volume.
- In settings {Input Tab} Color can be changed. Default color "Lime".
4. Relatively Low Volume
- When volume is less than 50% of average volume, irrespective of up or down day then it is Relatively Low Volume.
- In settings {Input Tab} Color can be changed. Default color "Silver".
Section - Step Up and Down Volume
1. Step Up
- When today's volume is more than yesterday's volume and both days' volume should be less than average volume.
- In settings {Style Tab} Color, Type and location of the marker can be changed by user. Default is "Yellow", "Upward Triangle" and "Top".
1. Step Down
- When today's volume is less than yesterday's volume and both days' volume should be less than average volume.
- In settings {Style Tab} Color, Type and location of the marker can be changed by user. Default is "Yellow", "Down Ward Triangle" and "Top".
{NOTE}
This indicator best suited for Daily Timeframe and color selection is best suited for Dark theme.
10 hours ago
Release Notes:
{Note} Up and Down volume is based on previous close.

OSPL Volume [Community Edition]NSE:BANKNIFTY1!
This indicator is based on the concepts popularized by @OptionsScalper123 "Siva" of OiPulse. His ideology Is that large moves come after high volume candles. For Nifty, high volume is considered to be a candle above 125k volume and for BankNifty it’s 50k.
This indicator allows you to cut the noise and focus only on the high volume candle. It shows high volume candle in a brighter shade and lower volume candles in a less visible shade.
You can set the minimum volume threshold limit for Nifty and BankNifty. The indicator smartly recognizes which index you are using it in and uses the respective threshold volume limit.
All colors are customizable.
Thanks for Siva for all the ideas and wonderful products he has given to the community
Thanks to all the wonderful Pinescipters for developing awesome indicators and keeping the source open.
The source code of this indicator is just a few lines. Hope you can use it in your projects and learn something from this just how I learned from other scripts.
Any changes or updates needed in this indicator, please suggest. I was thinking some kind of alerts can be added when volume crosses the threshold. Let me know.
Boost/like this indicator and comment if you find this useful. Cheers and happy trading!!!

Average Daily Volume with Anomalies A trigger program to print volume triggers on stocks that are being watched.
It helps with identifying the trigger volume on a candle and helps determine whether one can enter a position or not.

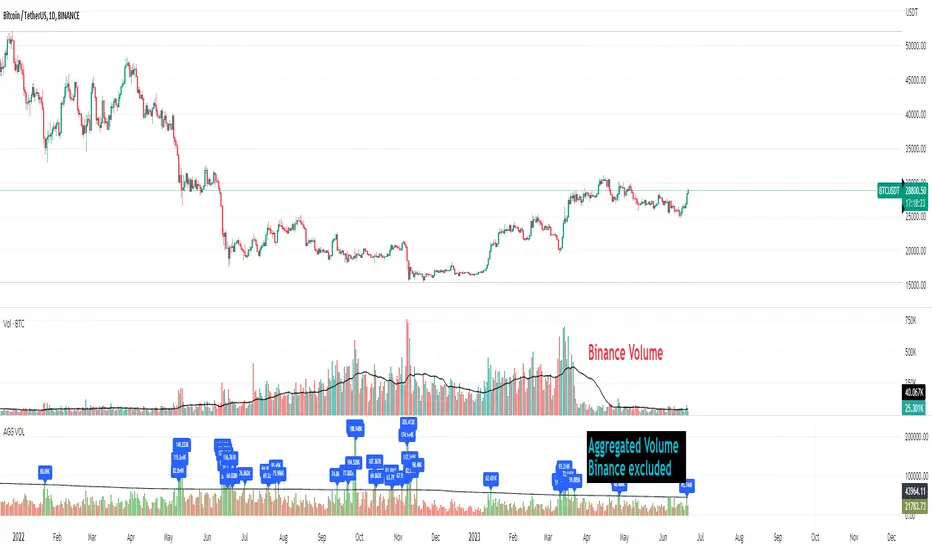
Crypto Aggregated Volume «NoaTrader»If you use volume in your crypto analysis, you may have encountered the situation which an exchange's policy change can affect your judgement falsely. For example, you can see the huge difference of volume on the given chart since binance transferred its fee discount from USDT to TUSD pair.
This script sums up volume of all major centralized exchanges ( according to coinmarketcap ) on the symbol you are visiting and has an option to exclude Binance's volume which can give you a more stable understanding for judgement when needed (and you can see the difference on the chart).
The colors also give a good vision about the relative volume in the area which can show the interest of market in trading.
The script only aggregates the same symbol on different exchanges and does not get the volume from other pairs.
Included CEXs are:
binance
bitstamp
coinbase
huobi
kraken
bitfinex
bybit
okx
kucoin
bithumb
VOLD Ratio (Volume Difference Ratio) by TenozenAnother helpful indicator is here! VOLD Ratio is calculated by the net volume of a buying candle, divided by the net volume of a sell candle.
Formula:
buying net volume/selling net volume
It's a simple indicator, but don't underestimate this simplicity. It's a powerful indicator that would help you to decide whether the volume is getting interested in the direction that the market would take. So assume when the market is above the Bollinger Bands, it means that the volume is at a buying extreme, by that, we could expect the market to get back towards the mean, as there is a lot of buying demand that entered the market. How about below the Bollinger Bands? it means that the volume is at a selling extreme, we could expect that there is a lot of volume getting in toward the sellers, so we could take advantage of the opportunity to go for a long. Lastly, the Bollinger Bands would help you guys to determine the liquidity of the market, if the Bollinger Bands get smaller over time, it means there is no interest for the market to enter yet, and if the Bollinger Bands get bigger over time, it means there is interest for the market to enter in the session.
Tips & Reminder:
- We shouldn't use this indicator by itself, make sure to use an Indicator that would help you guys to determine the momentum and the liquidity of the market.
- The higher the timeframe, the slower this indicator would signal an entry, by that use a smaller timeframe... I suggest using a 15M chart for the execution.
- Always trade in the medium-longterm direction if you want to have a high probability trade.
- Be patient in your execution, it's more likely the market would go higher or lower after going in the extreme of the Bollinger Bands.
Well, that's it! Hope you guys enjoy using this indicator, let me know if there is any question or suggestion. Ciao...

MonkeyblackmailThis script consists of several sections. test it and tell me your concerns. a lot of more works will be done
Volume Accumulation : The first part of the script checks for a new 5-minute interval and accumulates the volume of the current interval. It separates the volume into buying volume and selling volume based on whether the closing price is closer to the high or low of the bar.
Volume Normalization and Pressure Calculation : The script then normalizes the volume with a 20-period EMA, and calculates buying pressure, selling pressure, and total pressure. These calculations provide insight into the underlying demand (buying pressure) and supply (selling pressure) conditions in the market.
RSI Calculation and Overbought/Oversold Conditions : The script calculates the RSI (Relative Strength Index) and checks whether it is in an overbought (RSI > 70) or oversold (RSI < 30) state. The RSI is a momentum indicator, providing insights into the speed and change of price movements.
Volume Condition Check and Wondertrend Indicator : The script checks if the volume is high for the past five bars. If it is, it applies the Wondertrend Indicator, which uses a combination of the Parabolic SAR (Stop and Reverse) and Keltner Channel to identify potential trends in the market.
Swing High/Low and Fibonacci Retracement : The script identifies swing high and swing low points using a specified pivot length. Then, it draws Fibonacci retracement levels between these swing high and swing low points.
he monkeyblackmail script works well in the 5 minutes chart and combines several elements of technical analysis, including volume analysis, momentum indicators, trend-following indicators, volatility channels, and Fibonacci retracements. It aims to provide a comprehensive view of the market condition, highlighting key levels and potential trends in an easily understandable format. Don’t be too quick to start trading with it, first study how it work and you will blackmail the market.

B/S Volume with Timeframe InputDaytrading For Success's volume indicator with timeframe input selection added. Example shown is 1 minute time frame with 5 minute input selected.

Volume Profile Bar-Magnified Order Blocks [MyTradingCoder]Introducing "Volume Profile Bar-Magnified Order Blocks", an innovative and unique trading indicator designed to provide traders with a comprehensive understanding of market dynamics. This tool takes the concept of identifying order blocks on your chart and elevates it by integrating a detailed volume profile within each order block zone.
Unlike standard order block indicators, Volume Profile Bar-Magnified Order Blocks pulls data from lower timeframe bars and assigns it to various segments of the order block. By providing this volume profile inside the order block, the indicator supplies a deeper, multi-dimensional view of market activity that can enhance your trading decisions.
Crucially, users have the ability to fine-tune the detection of order blocks. This is made possible through a single input setting called "Tuning". This integer value allows you to control the significance and frequency of the order blocks. Higher numbers will produce more significant order blocks, though they will appear less frequently. Lower numbers, on the other hand, will yield less significant order blocks, but they will occur more often. This enables you to adjust the sensitivity of the indicator according to your specific trading strategy and style.
Key Settings:
Number of Segments: Customize the level of detail in your volume profile by selecting the number of segments you want inside each order block.
Tuning: Adjust the sensitivity of order block detection to align with your trading strategy. Higher values produce more significant but less frequent order blocks, while lower values yield less significant but more frequent order blocks.
Color Inputs: Personalize the look of your chart by selecting the colors for various elements of the indicator. This ensures a seamless integration with your current chart aesthetics and improves visual clarity.
Here is a s creenshot that beautifully demonstrates the power of this indicator. You'll see how the price rejects perfectly off the highest volume segment in an order block, showcasing the indicator's potential for pinpointing high-impact price levels.
While Volume Profile Bar-Magnified Order Blocks offers many unique features, it should be used in conjunction with other indicators and forms of analysis for a complete trading strategy. As with all tools, it does not guarantee profitable trades but is intended to give traders more information to base their decisions on. Use it to complement your existing analysis and enhance your understanding of market behavior.
Experience a new level of clarity in your trading with Volume Profile Bar-Magnified Order Blocks - an indicator that goes beyond the surface to help you navigate the markets more effectively.

ETN - Volume CandleHighlights candlestick based on volume data.
Indicator looks back and analyzing volume to find the volume bar with the largest numerical value
Indicator highlights the corresponding candlestick .
Indicator marks the high and low of that candlestick.
Users can adjust lookback period. Default is set to 50 .
Users can adjust how the indicator plots the high and low.
I currently have the high and low not being displayed on the charts until I come up with a better version.
On my chart, indicator colored the candlesticks YELLOW.
improved volumeIt is an indicator that displays the trading volume.
Red-colored candle bars indicate a decrease in trading volume.
Green-colored candle bars indicate an increase in trading volume.
The transparent yellow cloud above the volume bars represents the 21-bar moving average volume, which shows the average volume over the specified period. (You can change the number of bars and the type of moving average from the indicator settings.)
This allows for easier comparison between the current trading volume and the average volume.
In the price scale section, there are 4 target levels. They represent the following in ascending order: Average volume, Average volume multiplied by 2, Average volume multiplied by 3, Average volume multiplied by 4.
Additionally, you can use the alarm feature based on these average volume levels.

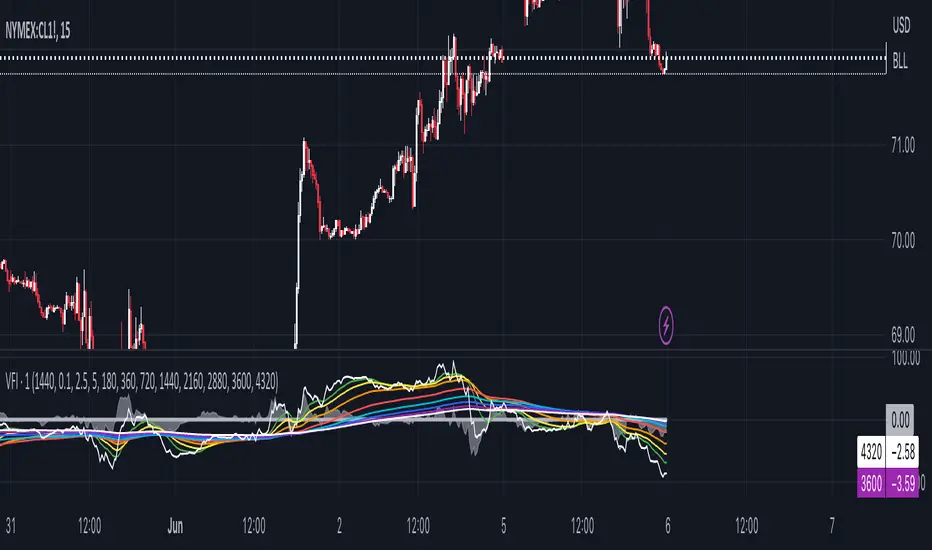
1 min Volume Flow Indicator (VFI) with EMA ribbonOriginally Markos Katsanos' indicator that LazyBear made popular here on TW. Now updated to Pine Script version 5, which makes multi-timeframe charting easier.
The initial Katsanos' idea for the indicator is the following:
"The VFI is based on the popular On Balance Volume (OBV) but with three very important modifications:
Unlike the OBV, indicator values are no longer meaningless. Positive readings are bullish and negative bearish.
The calculation is based on the day’s median instead of the closing price.
A volatility threshold takes into account minimal price changes and another threshold eliminates excessive volume. ...
A simplified interpretation of the VFI is that values above zero indicate a bullish state and the crossing of the zero line is the trigger or buy signal.
The strongest signal with all money flow indicators is of course divergence.
The classic form of divergence is when the indicator refuses to follow the price action and makes lower highs while price makes higher highs (negative divergence). If price reaches a new low but the indicator fails to do so, then price probably traveled lower than it should have. In this instance, you have positive divergence."
I set up default settings for intraday trading I personally have found the most useful. And what I have found useful is how and which volume flows in and out on 1 min chart. For 1 min volume flow I find it convenient to have specific EMAs as guidance: 360, 720, 1440, 2160, 2880, 3600, 4320 -- the logic is derived from how many minutes there are per specific hours and days. Since short term trends typically last for three days, 1440 and 4320 EMAs are the ones I myself concentrate the most. That is to say, quite often 1min volume flow pivots around 1440 and 4320 EMAs.
If you want to see 1 min volume flow on some other timeframe than 1 min, change the timeframe in the settings.
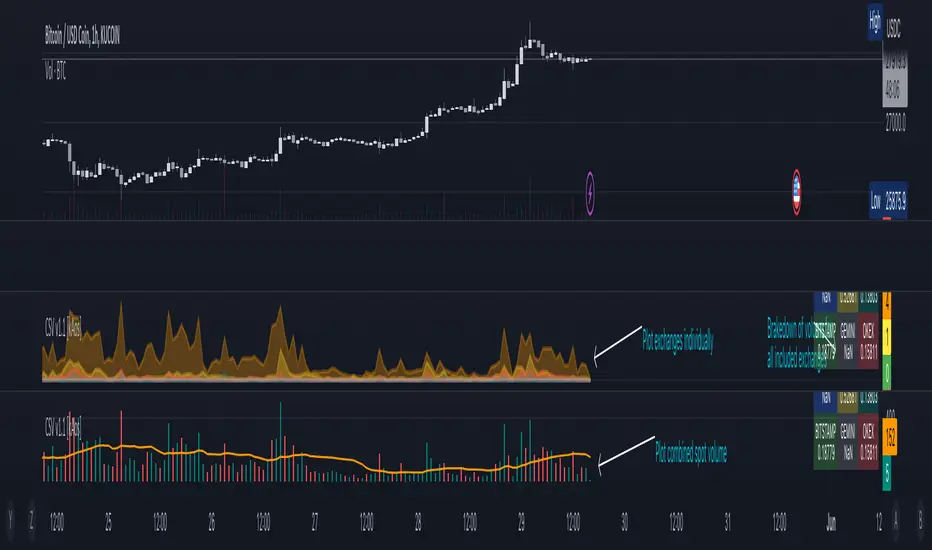
Combined Spot Volume | Crypto v1.1 [kAos]This script combines the "ticker volume" from 9 different exchanges. The default settings are for Crypto Assets only. In the settings window you can choose to plot the "combined volume" in a histogram form or "individual exchange volume" in an area view. (as shown on the chart) Addition to the plots there is also an Info Table in the bottom right corner that brakes down the volume to individual exchanges, shows how much volume was traded on which exchange. If the Table shows "NaN" on an exchange you need to check the spelling of that exchange, if thats correct, than the ticker is not available on that exchange.
Volume accumulation [TCS] | VTAThe indicator calculates buy and sell volume values for different look-back periods, based on the high, low, close, and tick volume data of the chart.
The calculated buy and sell volume values are stored in separate variables, which represent cumulative volume values over the respective look-back periods.
It's important to note that the code provided calculates the buy and sell volume values individually for each look-back period and after sum them.
It can be useful to understand who is in control of the market based on the look-back period.
For example if the price is decreasing but the volume in the past candle are bullish it means that the trend probably will turn.
Please note that this indicator is for educational purposes only and should not be used for trading without further testing and analysis.

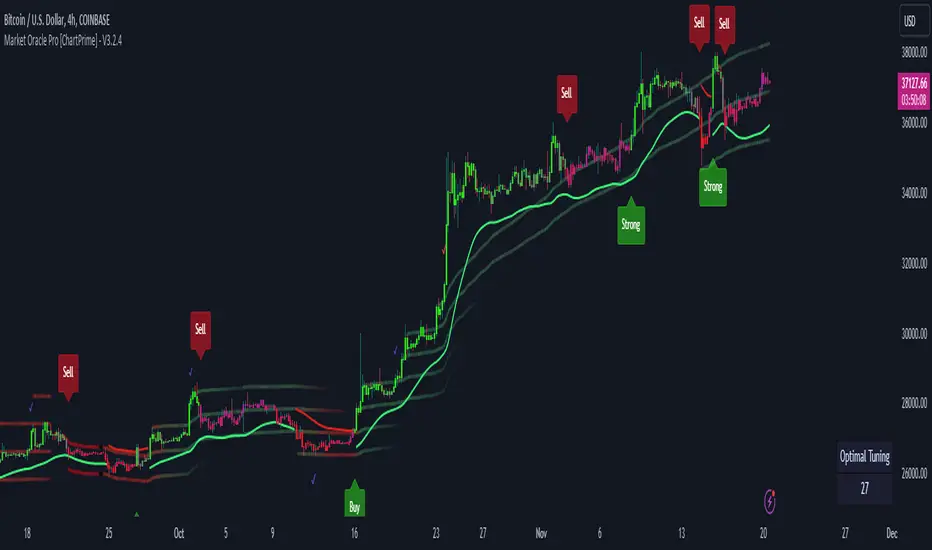
Market Oracle Pro [ChartPrime]ChartPrime Oracle Pro combines actionable, elegant and functional indicators into a single toolkit. Combinations of both trend following and contrarian logic aim to provide traders with a deeper insight into market movements; aiming to assist in better entries and exits.
Designed and created by the ChartPrime team, peacefullizard (digital signal processing expert), Gecko, and ExoMaven, this toolkit takes deeper level theory and expresses it in a useable format for traders. ChartPrime Oracle Pro is designed to satisfy and cover major trading theories allowing the user to pick and select the features that fit them.
When using any indicator suite it is important to understand these tools are there to assist trading rather than to be a single source of truth. Functionality such as Auto Maximization of parameters is there to guide and enhance user experience, however it is important to be aware of overfitting results.
Features included & Use cases:
Signal Mode: Select the type of assistive signals you are requiring. Provided are both trend following signals with self optimization using backtest results as well as reversal signals, aiming to provide real time tops and bottoms in markets. Both these signal modes can be fine tuned using the tuning input to refine signals to a trader's liking. The ChartPrime Auto Maximizer will automatically apply a backtested parameter and display the "best performing signals" on your chart. It is important to note this is not indicative of future results. ChartPrime Trend Signals leverage audio engineering inspired techniques and low-pass filters in order to achieve and attempt to produce lower lag response times and therefore is designed to have a uniqueness when compared to more classical trend following approaches.
Candle Highlighting: Choose between a clean gradient or more classical red/green coloring. These color the candles to assist with trend identification.
ChartPrime Dashboard: This cleanly designed dashboard provides 3 simple to interpret metrics. Firstly, the Optimal Tuning box provides a backtested result giving you the most accurate input. Again, it is important to note this is not indicative of future results. A Prime Score is also provided. This metric is a collection of ChartPrime trend following indicators bundled into a single item. It ranges from 0 (being very bearish trend) to 10 (being a very bullish trend). 5 would indicate a ranging market. A consolidation score is also provided showing how "ranging" the market is. 10 being a low volatility and consolidating market and 0 being a more volatile and trending market which can assist the trader in avoiding ranges (if undesired).
Additional Features:
The Dynamic Reactor provides a simple band passing through the chart. This can provide assistance in support and resistance locations as well as identifying the trend direction expressed via green and red colors. Taking a moving average and applying unique adaptivity calculations gives this plot a unique and fast behaviour.
The Prime Ranges provide VWAP inspired real time actionable ranges on your chart. These ranges provide support and resistance levels as well as coloring, once again, there to aid trend identifcation. By generating a distribution and projecting it we produce real time levels for traders.
Candlestick structures analyze candlestick formation putting a spin on classical candlestick patterns and provide the most relevant formations on the chart. These are not classical and are filtered by further analyzing market activity. A trader's classic with a spin.
The Momentum Wave Bands provide classical areas of high deviation where the price may reverse. It also provides additional insight on trend direction and volatility.
The Prime Trend Assistant provides a trend following dynamic support and resistance level. This makes it perfect to use in confluence or as a filter for other supporting indicators. This is an adaptive trend following system designed to handle volatility leveraging filter kernels as apposed to low pass filters.
Settings:
Signal Mode: Drop down to select the types of signals wanted
Tuning: Integer input to adjust signal's responsiveness. Lower inputs result in more frequent signals being produced.
Auto Maximizer Toggle: Automatically apply a backtested parameter to the signals
Dashboard Size: Drop down to select the size of the dashboard
Dashboard Position: Change the location of the dashboard on your chart
Additional Features: A set of toggles turning on/off these indicators.
Example Usecases:
Trend based confluences:
ChartPrime Oracle Pro provides classical (all be-it self optimizing) trend based signals. When trading, taking into consideration other forms of confluences are crucial. Take the image below: Here we see a *uptrend* where smaller retracements in price action are resulting in sell signals. When identifying a trend, analyzing the macro and micro price action can help the trader deduce how relevant a move in the market may be. We can use the Prime Trend Assistant to help filter out said retracements. We are also able to use the Prime Ranges in a similar way.
Features such as the Prime Ranges have duplicate usecases whereby a trend can be idenfied via the color of the bands as well as providing TP/SL levels. Considering these assisting features is vital before entering a trade.
Contrarian trading methodologies:
Commonly; trading with a trending market is most well known. However; markets are just as susceptible to ranging behaviors. ChartPrime has designed this toolkit to cater to most market conditions. For example, finding confluence between reversal indicators such as our contrarian signals and the momentum wave band can provide for some very strong confluence that can help a trader attempt to enter at bottoms of retracements and achieve the best possible entries or exits.
Developing confluences as shown above can be key to a trader's success. It is import ant to avoid biases when looking at indicators and view the market as objectively as possible.
ChartPrime believe that there is no magic indicator that is able to print money. Indicator toolkits provide value via their convinience, adaptibility and uniqueness. Combining these items can help a trader make more educated; less messy, more planned trades and in turn hopefully help them succeed.
Risk Disclaimer
All content and developments created by ChartPrime are purely for informational & educational purposes only. Past performance does not guarantee future results.
Script a pagamento
Volumen Salvatierra
The "Salvatierra Volume" Indicator is an indicator based and created in homage to Tom Williams (author of "Master The Markets") . It helps to interpret the volume and movements of the market, in a simple way. Its benefits are:
Helps identify climatic volumes
Helps identify if there are or not strong hands in the market
Shows if a trend is being driven by volume and if the volume is strong
Red Volume:
Weak hands only
Green Volume:
Strong Hands Testing or guiding the price
Black Volume:
volume is normal
White Candles:
Sail with very little volume
Black Candles:
candle with a lot of volume
El Indicador de "Volumen Salvatierra" es un indicador basado y creado en homenaje a Tom Williams (autor de "Master The Markets") . Ayuda a interpretar el volumen y los movimientos del mercado, de una manera sencilla. Sus beneficios son:
Ayuda a identificar los volúmenes climáticos
Ayuda a identificar los momentos en los que no hay manos fuertes en el mercado
Muestra si una tendencia esta siendo guiada por el volumen y si el volumen es fuerte
Volumen Rojo:
Solo manos débiles
Volumen Verde:
Manos Fuertes Testeando o guiando el precio
Volumen Negro:
El volumen es normal
Velas blancas:
Vela con muy poco volumen
Velas Negras:
Vela con mucho volumen
