Orderblock Footprints [AlgoAlpha]🟠 OVERVIEW
This script highlights orderblocks and then drills into what actually trades inside them. Zones are created only after an abnormal directional impulse, measured with a z-score on consecutive candle bodies, so the orderblocks are tied to real expansion rather than simple pivots. Once a zone exists, the script overlays lower-timeframe volume footprints inside the candle when price trades back into that zone. The goal is to show not just where an orderblock sits, but whether price is being accepted or absorbed when it is revisited.
🟠 CONCEPTS
Orderblocks are detected after extreme bullish or bearish impulses. The script tracks consecutive body movement up or down, normalizes that distance with a rolling z-score, and only triggers when the move is statistically large. The last opposite candle before that impulse defines the orderblock range. These zones then extend forward until they are either mitigated by price closing through them or they expire by age.
Inside an active zone, the script switches to a lower timeframe and builds a footprint-style profile for each bar. Each candle is split into price rows, counting time-at-price and volume delta. Positive and negative delta are colored separately. Absorption is flagged when opposing delta prints appear in the wick that rejects the zone. In practice: the impulse defines context ; the footprint shows interaction .
🟠 FEATURES
Separate bullish and bearish zones with automatic extension
Volume split inside each zone candle (up vs down volume)
Lower-timeframe footprint with TPO-style rows and delta gradient
Absorption detection using opposing delta in rejection wicks
Alerts for zone creation and absorption events
🟠 USAGE
Setup : Add the script to your chart. It works on any market and timeframe. The lower timeframe for footprints is fixed at 5 minutes, so higher chart timeframes show clearer structure. Use the Z-Score Window to control how strict impulse detection is and Max Box Age to limit how long old zones stay on the chart.
Read the chart : Bullish orderblocks are created after strong upward impulses and are invalidated when price closes below them. Bearish orderblocks are created after strong downward impulses and are invalidated when price closes above them. When price trades inside a zone, footprint rows appear. Green-tinted rows show positive delta; red-tinted rows show negative delta. Absorption labels appear when opposing delta prints into a rejecting wick.
Settings that matter : Increasing the Z-Score Window makes orderblocks rarer but more significant. Disabling Prevent Overlap allows stacked zones if you want to study clustering. Adjusting Rows per bar changes footprint resolution—lower values are cleaner, higher values show more detail but use more objects.
Volume

Elev8+ Impulse Levels | Smart Support & ResistanceElev8+ Impulse Levels
Why does price reject specific levels that look "empty" on the chart?
The answer usually lies in the past. These are Institutional Impulses—footprints left behind by massive market moves that algorithms and smart money defend days or even weeks later.
The Elev8+ Impulse Levels indicator is designed to automatically reveal this hidden Market Structure. It scans for the "Perfect Storm" of Volume + Aggression and projects these critical levels forward for you.
🧠 How It Works (The Logic)
This is not a standard Support & Resistance tool. It does not look for swing highs or lows. Instead, it detects Market Intent.
The indicator highlights specific candles where:
Volume Spikes: Buying or Selling pressure exceeds the average by a significant multiplier.
Volatility Expands: The candle body is unusually large relative to recent price action (ATR).
When these two factors combine, it signals that a major player has entered the market. The closing price of this impulse becomes a "Line in the Sand" for future price action.
🎯 How to Trade This Strategy
We built a "Smart Line" feature into this tool that changes the visual style of the level based on price behavior. This helps you trade two distinct setups:
1. The Defense (Bounce)
Visual: 🟢 Solid Lines
The Setup: A Solid Line represents a Fresh Level that has never been touched.
Why it works: Institutions often defend their entry price. When price returns to a fresh Solid Line, look for a rejection or a bounce.
2. The Flip (Break & Retest)
Visual: ◌ Dotted Lines
The Setup: When a candle closes past a level, the indicator automatically dims it to a Dotted Line.
Why it works: This signals a "Breaker Block." If a Support level (Green) is broken, it often flips to become Resistance. Watch for price to come back and "kiss" the Dotted Line from the other side before continuing the trend.
✨ Key Features
Smart Visualization: Lines automatically switch from Solid to Dotted when broken, keeping your chart analysis clean and logical.
Impulse Coloring: The indicator highlights the specific candle that created the level, so you can see the origin of the move.
Fully Customizable: Adjust the sensitivity of the Volume and Size detection to fit any asset class (Crypto, Forex, Futures, or Stocks).
🚀 The Elev8+ Workflow
Elev8+ Impulse Levels gives you the "Map"—it tells you where the market is likely to react.
To know exactly when to enter, we recommend pairing this tool with our premium Elev8+ Reversal Indicator, which specializes in timing the entry signal precisely when price hits these high-value levels.
Build your narrative. See the structure. Elev8 your trading.
Disclaimer: Trading involves high risk. This tool is for educational purposes to assist with technical analysis and does not guarantee future performance.

able FRVP Reversal# able FRVP Reversal - Complete User Guide
## 📌 Overview
**able FRVP Reversal** is a professional-grade Volume Profile indicator with an integrated reversal detection system. It combines Fixed Range Volume Profile (FRVP) analysis with a confluence-based reversal scoring system to identify high-probability turning points at key volume levels.
---
## ✨ Key Features
| Feature | Description |
|---------|-------------|
| **Session-Based Volume Profile** | Automatically resets at the beginning of each regular trading session |
| **POC (Point of Control)** | Highest volume price level - strongest support/resistance |
| **VAH (Value Area High)** | Upper boundary of the 70% value area - resistance zone |
| **VAL (Value Area Low)** | Lower boundary of the 70% value area - support zone |
| **Confluence Scoring System** | 5-point scoring system for reversal detection |
| **Smart Cooldown** | Prevents signal spam with customizable cooldown period |
| **Real-time Info Table** | Displays all key metrics in a retro-style dashboard |
---
## 🔧 Installation
1. Open TradingView and go to **Pine Editor**
2. Delete any existing code and paste the indicator code
3. Click **"Add to Chart"**
4. Configure settings as needed
---
## ⚙️ Settings Explained
### 📊 Volume Profile Settings
| Setting | Default | Description |
|---------|---------|-------------|
| **Number of Rows** | 50 | Resolution of the volume profile (more rows = finer detail) |
| **Value Area %** | 70 | Percentage of volume to include in Value Area (industry standard: 70%) |
| **Profile Width** | 40 | Visual width of the histogram on chart |
| **Show Histogram** | ✓ | Display volume histogram bars |
| **Show POC/VAH/VAL** | ✓ | Display the three key levels |
| **Show Labels** | ✓ | Display price labels for each level |
| **Extend Lines** | ✓ | Extend levels to the right of current price |
| **Extend Length** | 100 | How far to extend the lines (in bars) |
### 🔄 Reversal Detection Settings
| Setting | Default | Description |
|---------|---------|-------------|
| **Enable Reversal Detection** | ✓ | Turn reversal signals on/off |
| **Min Confluence Score** | 3 | Minimum score required to trigger signal (1-5) |
| **Cooldown Bars** | 10 | Minimum bars between signals to prevent spam |
#### Understanding Min Confluence Score:
- **Score 1-2**: Very sensitive, many signals (not recommended)
- **Score 3**: Balanced - good for most traders ⭐ Recommended
- **Score 4**: Conservative - fewer but higher quality signals
- **Score 5**: Very strict - only strongest reversals
### 🎨 Color Settings
All colors are fully customizable:
- **POC Line**: Default Gold (#FFD700)
- **VAH Line**: Default Coral Red (#FF6B6B)
- **VAL Line**: Default Teal (#4ECDC4)
- **Bullish Reversal**: Default Green (#00E676)
- **Bearish Reversal**: Default Red (#FF5252)
---
## 📖 How to Read the Indicator
### Volume Profile Histogram
```
█████████████ ← High volume = Strong S/R
████████ ← Medium volume
████ ← Low volume = Weak S/R
██
```
- **Darker/Longer bars** = More trading activity at that price
- **Inside Value Area** = Colored based on session direction (Bull/Bear)
- **Outside Value Area** = Muted gray color
### Key Levels
| Level | Color | Meaning |
|-------|-------|---------|
| **POC** | Yellow | Price with highest volume - Strongest magnet |
| **VAH** | Red | Upper resistance - Look for bearish reversals |
| **VAL** | Teal | Lower support - Look for bullish reversals |
---
## 🔄 Reversal Detection System
### How the Scoring System Works
The indicator uses a **5-point confluence scoring system**. Each condition adds 1 point:
#### 🟢 Bullish Reversal Score (at VAL)
| Condition | Points | Description |
|-----------|--------|-------------|
| Price at VAL Zone | +1 | Price is within VAL ± 0.2 ATR |
| Bullish Candle | +1 | Close > Open (green candle) |
| RSI Oversold | +1 | RSI < 35 |
| Rejection Wick | +1 | Lower wick > 1.5× body size |
| Failed Breakdown | +1 | Touched below VAL but closed above |
#### 🔴 Bearish Reversal Score (at VAH)
| Condition | Points | Description |
|-----------|--------|-------------|
| Price at VAH Zone | +1 | Price is within VAH ± 0.2 ATR |
| Bearish Candle | +1 | Close < Open (red candle) |
| RSI Overbought | +1 | RSI > 65 |
| Rejection Wick | +1 | Upper wick > 1.5× body size |
| Failed Breakout | +1 | Touched above VAH but closed below |
### Signal Quality Ratings
| Score | Rating | Meaning |
|-------|--------|---------|
| 5/5 | ★★★ | Excellent - Highest probability |
| 4/5 | ★★ | Good - High probability |
| 3/5 | ★ | Acceptable - Moderate probability |
| <3 | - | No signal triggered |
---
## 📋 Info Table Explained
```
╔═ able-REV ═╗ 15 ████████ SCR
─────────────────────────────────────
ZONE UPPER VA ▒▒▓▓████ ▲
POC 4272.680 ██████·· ▲
VAH 4322.745 ████···· ·
VAL 4264.977 ██████·· ·
═ SCORE ═════════════════════════════
BULL 0/5 ········ ·
BEAR 1/5 ░······· ·
RSI 49 ▒▒▓▓···· ·
◄SIGNAL► WAIT ········ ·
```
| Row | Description |
|-----|-------------|
| **ZONE** | Current price position relative to Value Area |
| **POC/VAH/VAL** | Price levels with distance indicators |
| **BULL Score** | Current bullish confluence score |
| **BEAR Score** | Current bearish confluence score |
| **RSI** | RSI value with OB/OS status |
| **SIGNAL** | Current signal status (BUY/SELL/WAIT) |
### Zone Types
| Zone | Meaning | Bias |
|------|---------|------|
| ABOVE VAH | Price broke above resistance | Bullish (but watch for rejection) |
| ⚠ AT VAH | Price testing resistance | Watch for bearish reversal |
| UPPER VA | Price in upper value area | Slight bullish bias |
| LOWER VA | Price in lower value area | Slight bearish bias |
| ⚠ AT VAL | Price testing support | Watch for bullish reversal |
| BELOW VAL | Price broke below support | Bearish (but watch for rejection) |
---
## 📈 Trading Strategies
### Strategy 1: VAH Rejection (Bearish Reversal)
**Setup:**
1. Price approaches or touches VAH (red dashed line)
2. BEAR score reaches 3+ (or your minimum setting)
3. REV signal appears above the candle
**Entry:**
- Enter SHORT on signal candle close
- Or wait for confirmation candle
**Stop Loss:**
- Above the signal candle high
- Or above VAH + 0.5 ATR
**Take Profit:**
- First target: POC (yellow line)
- Second target: VAL (teal line)
---
### Strategy 2: VAL Bounce (Bullish Reversal)
**Setup:**
1. Price approaches or touches VAL (teal dashed line)
2. BULL score reaches 3+ (or your minimum setting)
3. REV signal appears below the candle
**Entry:**
- Enter LONG on signal candle close
- Or wait for confirmation candle
**Stop Loss:**
- Below the signal candle low
- Or below VAL - 0.5 ATR
**Take Profit:**
- First target: POC (yellow line)
- Second target: VAH (red line)
---
### Strategy 3: POC Bounce
**Setup:**
1. Price pulls back to POC after trending
2. POC acts as support/resistance
3. Watch for reversal candle patterns
**Entry:**
- Long if bullish candle at POC from below
- Short if bearish candle at POC from above
**Stop Loss:**
- Other side of POC ± buffer
---
## ⚠️ Important Notes
### When Signals Work Best
✅ **High Probability Setups:**
- Score 4-5 with clear rejection wick
- RSI confirms (oversold for long, overbought for short)
- First test of VAH/VAL in the session
- Clear trend before reversal
❌ **Low Probability Setups:**
- Score barely meeting minimum (3/5)
- Multiple tests of same level (level weakening)
- Low volume/choppy market
- News events pending
### Risk Management Rules
1. **Never risk more than 1-2% per trade**
2. **Always use stop loss** - place beyond the level
3. **Wait for candle close** - don't enter on wick touches
4. **Respect the cooldown** - avoid overtrading
5. **Consider the trend** - counter-trend reversals are riskier
---
## 🔔 Alerts
The indicator includes built-in alerts:
| Alert | Trigger |
|-------|---------|
| VAL Bullish Reversal | BULL score meets minimum at VAL |
| VAH Bearish Reversal | BEAR score meets minimum at VAH |
### Setting Up Alerts:
1. Right-click on the chart
2. Select "Add Alert"
3. Choose "able FRVP Reversal" as condition
4. Select desired alert type
5. Configure notification method
---
## 💡 Pro Tips
1. **Combine with trend analysis** - Reversals in trend direction are more reliable
2. **Watch for confluence with other S/R** - If VAH/VAL aligns with round numbers, previous highs/lows, or fib levels, the level is stronger
3. **Volume confirmation** - Higher volume on reversal candle = stronger signal
4. **Time of day matters** - Reversals during active trading hours are more reliable
5. **Adjust sensitivity by market** - Volatile assets may need higher Min Confluence Score
6. **Use multiple timeframes** - Check if reversal level aligns with higher timeframe levels
---
## 🔧 Recommended Settings by Trading Style
| Style | Min Confluence | Cooldown | Best For |
|-------|----------------|----------|----------|
| Scalping | 3 | 5-7 | Quick trades, more signals |
| Day Trading | 3-4 | 10-15 | Balanced approach |
| Swing Trading | 4-5 | 20+ | Fewer, higher quality signals |
---
## ❓ Troubleshooting
| Issue | Solution |
|-------|----------|
| No signals appearing | Lower Min Confluence Score or check if market is ranging |
| Too many signals | Increase Min Confluence Score or Cooldown Bars |
| Levels not showing | Enable Show POC/VAH/VAL in settings |
| Histogram too wide/narrow | Adjust Profile Width setting |
---
## 📞 Support
For questions, suggestions, or bug reports, please contact the developer.
---
**Version:** 1.0
**Last Updated:** 2024
**Platform:** TradingView (Pine Script v6)

AlgoZ Smart Divergence [Trend Filtered]AlgoZ Smart Divergence is a precision entry tool designed to catch market reversals by analyzing Volume Divergence combined with Multi-Timeframe Trend Filtering. Unlike standard divergence indicators that signal on every minor price fluctuation, this script uses a strict set of filters to only present high-probability trade setups that align with the broader market trend.
This is the Free Edition of the AlgoZ Suite, focused on providing clean, non-repainting Buy and Sell signals based on institutional volume flow.
How It Works The script operates on a 3-step validation process:
Volume Divergence:
It detects anomalies where volume spikes relative to price action (e.g., Price makes a Lower Low, but Volume hits a Higher High).
HTF Trend Painting:
It analyzes a Higher Timeframe (Default: 3 Hours) to determine the macro trend. If the 3H trend is Bullish, the candles turn Green. If Bearish, they turn Red.
Color Match Filtering:
The script includes a smart filter that blocks signals that go against the trend. You will only see BUY signals when the candles are Green (Uptrend) and SELL signals when the candles are Red (Downtrend).
Key Features
Volume Divergence Engine:
Identifies hidden accumulation and distribution zones.
HTF Trend Coloring:
Automatically paints your chart based on Higher Timeframe breakouts (Default: 3-Hour Trend).
Smart Signal Filtering:
Toggles are available to "Only Show Signals Matching Candle Color," ensuring you never trade against the momentum.
EMA Trend Filter:
Includes a built-in 10-period EMA filter to further refine entries.
Volatility Filters:
Optional RSI and ADX filters are included to avoid trading during low-volatility "chop."
How to Use
For Longs (Buys):
Wait for the candles to turn Green (indicating the 3-Hour trend is up) and look for a BUY label. The price must also be above the 10 EMA (if enabled).
For Shorts (Sells):
Wait for the candles to turn Red (indicating the 3-Hour trend is down) and look for a SELL label.
Risk Management:
This script is designed to catch reversals. Always place your Stop Loss below the recent swing low (for buys) or above the swing high (for sells).
Settings
Higher Timeframe:
Default is set to 3 Hours (180 minutes). You can adjust this to 1 Day or 4 Hours depending on your trading style.
EMA Length:
Default is 10.
Color Match Filter:
On by default.

Clean Volume (SUV)The Problem with Raw Volume
Traditional volume bars tell you how much traded, but not whether that amount is unusual. This creates noise that misleads traders:
Stock A averages 1M shares with wild daily swings (500K-2M is normal). Today's 2M volume looks like a spike—but it's just a routine high day.
Stock B averages 1M shares with rock-steady volume (950K-1.05M typical). Today's 2M volume is genuinely extraordinary—institutions are clearly active.
Both show identical 200% relative volume. But Stock B's reading is far more significant. Raw volume and simple relative volume (RVol) can't distinguish between these situations, leading to:
- False signals on naturally volatile stocks
- Missed signals on stable stocks where smaller deviations matter
- Inconsistent comparisons across different securities
---
A Solution: Standardized Unexpected Volume (SUV)
SUV applies statistical normalization to volume, measuring how many standard deviations today's volume is from the mean. This z-score approach accounts for each stock's individual volume stability, not just its average.
SUV = (Today's Volume - Average Volume) / Standard Deviation of Volume
Using the examples above:
- Stock A (high volatility): SUV = 2.0 — elevated but not unusual for this stock
- Stock B (low volatility): SUV = 10.0 — extremely unusual, demands attention
SUV automatically calibrates to each security's behaviour, making volume readings comparable across any stock, ETF, or timeframe.
---
What SUV Is Good For
✅ Identifying genuine volume anomalies — separates signal from noise
✅ Comparing volume across different securities — apples-to-apples z-scores
✅ Spotting institutional activity — large players create statistically significant footprints
✅ Confirming breakouts — high SUV validates price moves
✅ Detecting exhaustion — extreme SUV after extended moves may signal climax
✅ Finding "dry" setups — negative SUV reveals quiet accumulation periods
---
Where SUV Has Limitations
⚠️ Earnings/news events — SUV will spike dramatically (by design), but the statistical reading may be less meaningful when fundamentals change
⚠️ Low-float stocks — extreme volume volatility can produce erratic SUV readings
⚠️ First 20 bars — needs lookback period to establish baseline; early readings are less reliable
⚠️ Doesn't predict direction — SUV measures volume intensity, not whether price will rise or fall
---
How to Read This Indicator
Bar Height
Displays actual volume (like a traditional volume chart) so you can still see absolute levels.
Bar Color (SUV Intensity)
Color intensity reflects the SUV z-score. Brighter = more unusual.
Up Days (Green Gradient):
| Color | SUV Range | Meaning |
|--------------|-----------|------------------------------------------|
| Bright Green | ≥ 3.0 | EXTREME — Highly unusual buying activity |
| Green | ≥ 2.0 | VERY HIGH — Significant accumulation |
| Light Green | ≥ 1.5 | HIGH — Above-average interest |
| Pale Green | ≥ 1.0 | ELEVATED — Moderately active |
| Muted Green | 0 to 1.0 | NORMAL — Typical volume |
| Dark Grey | < 0 | DRY — Below-average, quiet |
Down Days (Red Gradient):
| Color | SUV Range | Meaning |
|------------|-----------|-----------------------------------------|
| Bright Red | ≥ 3.0 | EXTREME — Panic selling or capitulation |
| Red | ≥ 2.0 | VERY HIGH — Heavy distribution |
| Light Red | ≥ 1.5 | HIGH — Active selling |
| Pale Red | ≥ 1.0 | ELEVATED — Moderate selling |
| Muted Red | 0 to 1.0 | NORMAL — Routine down day |
| Dark Grey | < 0 | DRY — Light profit-taking |
Coiled State (Tan/Beige):
When detected, bars turn muted tan regardless of direction. This indicates:
- Volume compression (SUV below threshold for consecutive days)
- Volatility contraction (ATR below average)
- Price tightness (small recent moves)
Coiled states may precede significant breakouts.
Special Markers
"P" Label (Blue) — Pocket Pivot detected. Morales & Kacher's signal fires when:
- Price closes higher than previous close
- Price closes above the open (green candle)
- Volume exceeds the highest down-day volume of the last 10 bars
Pocket Pivots may indicate institutional buying before a traditional breakout.
"C" Label (Orange) — Coiled state confirmed. The stock is consolidating with compressed volume and tight price action. Watch for expansion.
Dashboard
The configurable dashboard displays real-time metrics. Default items:
- Vol — Current bar volume
- SUV — Z-score value
- Class — Classification (EXTREME/VERY HIGH/HIGH/ELEVATED/NORMAL/DRY/COILED)
- Proj RVol — Projected end-of-day relative volume (intraday only)
Additional optional items: Direction, Coil Status, Relative ATR, Pocket Pivot, Average Volume.
---
Practical Usage Tips
1. SUV ≥ 2 on breakouts — Validates the move has institutional participation
2. Watch for SUV < 0 bases — Quiet accumulation zones where smart money builds positions
3. Coil → Expansion — After consecutive coiled days, the first SUV ≥ 1.5 bar often signals direction
4. Pocket Pivots in bases — Early accumulation signals before price breaks out
5. Extreme SUV (≥3) after extended moves — May indicate climax/exhaustion rather than continuation
---
Settings Overview
| Group | Key Settings |
|-----------------|-----------------------------------------------------|
| SUV Settings | Lookback period (default 20) |
| Coil Detection | Enable/disable, sensitivity thresholds |
| Pocket Pivot | Enable/disable, lookback period |
| Display | Dashboard style (Ribbon/Table), position, text size |
| Dashboard Items | Toggle which metrics appear |
| Colors | Fully customizable gradient colors |
---
Credits
SUV concept adapted from academic literature on standardized unexpected volume in market microstructure research. Pocket Pivot methodology based on Gil Morales and Chris Kacher's work. Coil detection inspired by volatility contraction patterns.
---
This indicator does not provide financial advice. Always combine volume analysis with price action, market context, and proper risk management. No animals were harmed during the coding and testing of this indicator.

SNIPER ORB V3# 🎯 SNIPER ORB TRADING CHEAT SHEET
## Quick Reference Guide for Live Trading
---
## 📊 VISUAL IDENTIFICATION GUIDE
```
═══════════════════════════════════════════════════════════════════
YOUR CHART AT A GLANCE
═══════════════════════════════════════════════════════════════════
🔵 BRIGHT BLUE LINES (3px) → 5min ORB High/Low
🔷 CYAN LINES (2px) → 15min ORB High/Low
🟣 PURPLE LINES (2px) → 30min ORB High/Low (PRIMARY)
🟢 GREEN DASHED LINES (1px) → Upside targets (1x, 2x, 3x from 30min ORB)
🔴 RED DASHED LINES (1px) → Downside targets (1x, 2x, 3x from 30min ORB)
🟡 GOLD LINE (2px) → Anchored VWAP (9:30 AM anchor for NY, 3:00 AM for London)
📋 INFO TABLE (top-right) → Shows live ORB ranges, VWAP price, status
═══════════════════════════════════════════════════════════════════
```
**KEY DIFFERENCE FROM OTHER ORB INDICATORS:**
- You see **ALL 3 ORB PERIODS SIMULTANEOUSLY** (5min, 15min, 30min)
- Targets calculated from **30min ORB ONLY** (not 5min or 15min)
- **NO BOX FILLS** - clean line-only display for sniper precision
- Auto-disappears at session end (no clutter from old sessions)
---
## 🔘 NEW FEATURE: ORB DISPLAY TOGGLES
**You now have FULL CONTROL over which ORB periods to display!**
```
In indicator settings → "ORB Display" section:
☑ Show 5min ORB → Toggle blue lines ON/OFF
☑ Show 15min ORB → Toggle cyan lines ON/OFF
☑ Show 30min ORB → Toggle purple lines ON/OFF
USE CASES:
━━━━━━━━━━━━━━━━━━━━━━━━━━━━━━━━━━━━━━━━━━━━━━━
1. FOCUS MODE (30min only)
☐ 5min ☐ 15min ☑ 30min
→ Clean chart, just your primary trading range
→ Best for beginners or minimalist traders
2. EARLY WARNING MODE (5min + 30min)
☑ 5min ☐ 15min ☑ 30min
→ See early breaks with 5min, trade 30min confirmation
→ Reduces visual noise from 15min
3. CONFLUENCE MODE (all 3 ORBs)
☑ 5min ☑ 15min ☑ 30min
→ Maximum information, all alignment signals
→ For advanced traders seeking highest probability
4. INTRADAY SCALP MODE (5min only)
☑ 5min ☐ 15min ☐ 30min
→ Ultra-fast entries on 5min breaks
→ High-risk, high-frequency approach
━━━━━━━━━━━━━━━━━━━━━━━━━━━━━━━━━━━━━━━━━━━━━━━
💡 PRO TIP: Start with 30min only, then add 5min/15min as you gain experience
```
---
## 🎯 FIXED: ANCHORED VWAP (TIMESTAMP-BASED)
**The VWAP now anchors with SURGICAL PRECISION to the exact session start candle!**
```
LONDON SESSION:
• Anchors at the EXACT 3:00 AM ET candle
• Uses timestamp checking: hour == 3 AND minute == 0
• Resets every morning at London Open
NEW YORK SESSION:
• Anchors at the EXACT 9:30 AM ET candle
• Uses timestamp checking: hour == 9 AND minute == 30
• Resets every day at NY Open
WHAT THIS MEANS:
✅ VWAP starts accumulating from the first tick of the session
✅ No more "off by one bar" errors
✅ Institutional-grade VWAP anchoring
✅ Perfect alignment with your ORB start times
HOW TO VERIFY IT'S WORKING:
1. Load indicator on 1min or 5min chart
2. Find the exact 9:30 AM candle (NY) or 3:00 AM candle (London)
3. VWAP should START appearing from that exact bar
4. Not the bar before, not the bar after - THAT EXACT BAR
```
---
## ⏰ SESSION TIMING MATRIX
| Session | Start Time | 5min Complete | 15min Complete | 30min Complete | Session End |
|---------|-----------|---------------|----------------|----------------|-------------|
| **London** | 3:00 AM ET | 3:05 AM | 3:15 AM | 3:30 AM | 9:30 AM ET (disappears) |
| **New York** | 9:30 AM ET | 9:35 AM | 9:45 AM | 10:00 AM | 5:00 PM ET (disappears) |
**💡 GOLDEN RULES:**
1. **WAIT FOR 30MIN ORB TO COMPLETE** before trading targets (10:00 AM NY / 3:30 AM London)
2. Use 5min and 15min ORBs as **early warning signals** only
3. All ORB lines + VWAP **auto-delete** at session end (clean chart)
---
## 🎯 THE 3-ORB SYSTEM: HOW IT WORKS
### **Hierarchical ORB Structure**
```
TIME: 9:30 AM ─────────────────────────────────> 10:00 AM ──────> 5:00 PM
↓ ↓
SESSION START 30min ORB COMPLETE
(all 3 ORBs begin forming) (targets appear)
📍 5min ORB (9:30-9:35 AM): ━━━━━━━━━━━━━━━━━━━━━━━━━━━━━━━━━━━━━>
Purpose: EARLY breakout signal, fastest-moving boundary
📍 15min ORB (9:30-9:45 AM): ━━━━━━━━━━━━━━━━━━━━━━━━━━━━━━━━━━━━━>
Purpose: MID-TERM institutional reference level
📍 30min ORB (9:30-10:00 AM): ━━━━━━━━━━━━━━━━━━━━━━━━━━━━━━━━━━━━━>
Purpose: PRIMARY TRADING RANGE - all targets calculated from this
🎯 TARGETS (10:00 AM onward): ▪ ▪ ▪ ▪ ▪ (1x, 2x, 3x from 30min ORB)
Purpose: Profit-taking levels based on 30min range
```
**Why 3 ORBs Instead of 1?**
- **5min ORB**: Captures early institutional positioning (first 5 minutes)
- **15min ORB**: Confirms directional bias (more stable than 5min)
- **30min ORB**: Full market digestion of overnight news + opening orders
- **Confluence = Higher Win Rate**: When all 3 align, breakouts are extremely reliable
---
## 🎯 THE 5 HIGH-PROBABILITY SETUPS
### **SETUP #1: TRIPLE ORB BREAKOUT CONFLUENCE** ⭐⭐⭐⭐⭐
```
CONDITIONS:
✅ 30min ORB complete (10:00 AM NY / 3:30 AM London)
✅ Price breaks ALL 3 ORBs simultaneously:
• 5min high/low (blue line)
• 15min high/low (cyan line)
• 30min high/low (purple line)
✅ VWAP confirms direction (below price = bullish, above = bearish)
✅ Volume spike on breakout candle
ENTRY: Close of breakout candle (must close beyond ALL 3 ORBs)
STOP: Inside 30min ORB at 30m low (long) or 30m high (short)
TARGET 1: First green/red dashed line (0.5x 30m range)
TARGET 2: Second target (1x 30m range)
TARGET 3: Third target (1.5x 30m range)
WIN RATE: 75-85% | R:R = 1:2.5 minimum
NOTES: When all 3 ORBs align, institutional order flow is unanimous
```
---
### **SETUP #2: 5MIN EARLY BREAKOUT → 30MIN CONFIRMATION** ⭐⭐⭐⭐
```
CONDITIONS:
✅ Price breaks 5min ORB first (blue line crossed)
✅ 15min ORB holds initially (cyan line not crossed yet)
✅ After 30min ORB completes, price breaks 30min boundary (purple)
✅ VWAP alignment confirms direction
✅ All 3 ORBs now broken in same direction
ENTRY: When 30min ORB breaks (purple line) + 5min/15min already broken
STOP: 30min ORB opposite boundary
TARGET 1-3: Standard targets from 30min ORB
WIN RATE: 70-80% | R:R = 1:2+
NOTES: 5min gave early warning, 30min confirms institutional commitment
```
---
### **SETUP #3: FALSE 5MIN BREAKOUT → 30MIN REVERSAL** ⭐⭐⭐⭐⭐
```
CONDITIONS:
✅ Price breaks 5min ORB (blue line)
✅ Fails to break 15min or 30min ORBs (cyan/purple lines hold)
✅ Price reverses back inside 5min ORB
✅ Then breaks OPPOSITE side of 30min ORB (purple line)
✅ VWAP flips to confirm new direction
ENTRY: When 30min ORB breaks in OPPOSITE direction of failed 5min break
STOP: Failed 5min breakout high/low (now a liquidity grab zone)
TARGET 1-3: Standard targets
WIN RATE: 80-90% | R:R = 1:3+ (trapped traders forced to exit)
NOTES: Most profitable setup - 5min breakout was liquidity hunt
```
---
### **SETUP #4: TIGHT COMPRESSION → EXPLOSION** ⭐⭐⭐⭐
```
CONDITIONS:
✅ All 3 ORBs tightly overlapping (5m, 15m, 30m within 50 points on YM)
✅ Range < 0.3% of price (very tight consolidation)
✅ VWAP sitting in middle of compression
✅ 30min ORB complete, price still inside all 3
ENTRY: Simultaneous break of ALL 3 ORBs + VWAP cross
STOP: Middle of compression zone
TARGET: 2x-4x normal targets (volatility expansion)
WIN RATE: 65-75% | R:R = 1:5+ (explosive breakout)
NOTES: Low volatility → high volatility shift, institutions coiling spring
```
---
### **SETUP #5: VWAP BOUNCE WITHIN 30MIN ORB** ⭐⭐⭐⭐
```
CONDITIONS:
✅ Price stayed inside 30min ORB for 1+ hours post-formation
✅ VWAP acting as dynamic support (long) or resistance (short)
✅ Price bouncing between VWAP and 30min ORB boundaries
✅ Clear rejection candles at VWAP
ENTRY: When price bounces off VWAP toward 30min ORB boundary
• Long: VWAP bounce up toward 30m high (purple)
• Short: VWAP rejection down toward 30m low (purple)
STOP: Beyond VWAP by 20 points
TARGET: 30min ORB opposite boundary
WIN RATE: 70-80% | R:R = 1:1.5-2
NOTES: Range-bound play, NOT for breakout traders
```
---
## 🛡️ RISK MANAGEMENT RULES
### **Position Sizing by ORB Range**
```
30min ORB Range | Stop Distance | Risk $500 (1%) | YM Contracts
-----------------|------------------|-----------------|-------------
< 50 points | 50 pts | $500 ÷ $250 = | 2 contracts
50-100 points | 100 pts | $500 ÷ $500 = | 1 contract
100-150 points | 150 pts | $500 ÷ $750 = | 0.66 (use 1)
150-200 points | 200 pts | $500 ÷ $1000 = | 0.5 (use 1)
> 200 points | Don't trade | Too wide | Skip setup
Formula: Risk $ ÷ (Stop Distance × $5 per YM point) = Max Contracts
```
### **The 3-Strike Rule (MANDATORY)**
```
✅ Trade 1: Full position size (based on 30m ORB range)
❌ Stop hit → Trade 2: HALF position size
❌ Stop hit → Trade 3: QUARTER position size
❌ Stop hit → DONE FOR THE DAY (no exceptions)
```
### **Profit Taking Ladder**
```
TARGET 1 (0.5x 30m range): Take 50% off, move stop to breakeven
TARGET 2 (1.0x 30m range): Take 30% off, trail stop by 25 points
TARGET 3 (1.5x 30m range): Take 15% off, let 5% run with 50pt trail
```
---
## ⚠️ DO NOT TRADE IF...
```
🚫 30min ORB incomplete (< 10:00 AM NY / < 3:30 AM London)
🚫 30min ORB range < 40 points YM (too tight, likely chop)
🚫 30min ORB range > 250 points YM (too wide, unpredictable)
🚫 All 3 ORBs wildly divergent (5m=100pts, 15m=180pts, 30m=240pts)
🚫 Major news release within 30 minutes (wait for ORB to reform)
🚫 You've hit 3 losses in the session (3-strike rule)
🚫 You're tired, emotional, revenge trading, or distracted
🚫 Time > 12:00 PM ET (lunch, avoid until 1:00 PM)
🚫 Time > 3:00 PM ET unless Power Hour (3:00-4:00 PM) momentum
```
---
## 🔍 PRE-SESSION CHECKLIST
**15 Minutes Before London (2:45 AM ET) or NY (9:15 AM ET):**
```
□ Check economic calendar (FOMC? NFP? CPI? → extra caution)
□ Review previous session's ORB ranges (context for today's volatility)
□ Load SNIPER ORB on 1min or 5min chart
□ Select correct session: "London" or "New York"
□ Verify indicator settings:
• Number of Targets: 3
• Target % of 30min Range: 50%
• Show Anchored VWAP: ON
□ Set TradingView alerts:
• 30min ORB complete (10:00 AM or 3:30 AM)
• Price crossing 30min high/low
• VWAP crosses
□ Prepare bracket orders mentally (entry, stop, 3 targets)
□ Review yesterday's P&L and lessons learned
□ Set phone to "Do Not Disturb" mode
```
---
## 🎨 INDICATOR SETTINGS GUIDE
### **Core Settings (Updated with Toggles)**
```
SESSION SETTINGS:
━━━━━━━━━━━━━━━━━━━━━━━━━━━━━━━━━━━━━━━━
• Active Session: "London" or "New York"
ORB DISPLAY (NEW!):
━━━━━━━━━━━━━━━━━━━━━━━━━━━━━━━━━━━━━━━━
☑ Show 5min ORB (toggle blue lines)
☑ Show 15min ORB (toggle cyan lines)
☑ Show 30min ORB (toggle purple lines)
💡 Turn OFF any ORB to declutter your chart!
TARGET SETTINGS:
━━━━━━━━━━━━━━━━━━━━━━━━━━━━━━━━━━━━━━━━
• Number of Targets: 3 (default)
• Target % of 30min Range: 50% (default)
VWAP SETTINGS:
━━━━━━━━━━━━━━━━━━━━━━━━━━━━━━━━━━━━━━━━
☑ Show Anchored VWAP
• VWAP Color: Gold (#FFC107)
• VWAP Width: 2px
```
### **Color Customization (Optimized for Dark Charts)**
```
DEFAULT COLORS:
━━━━━━━━━━━━━━━━━━━━━━━━━━━━━━━━━━━━━━━━
5min ORB: Bright Blue (#2196F3) - 3px wide
15min ORB: Cyan (#00BCD4) - 2px wide
30min ORB: Purple (#9C27B0) - 2px wide
Upside Targets: Green (#4CAF50) - 1px dashed
Downside Targets: Red (#F44336) - 1px dashed
VWAP: Gold (#FFC107) - 2px solid
━━━━━━━━━━━━━━━━━━━━━━━━━━━━━━━━━━━━━━━━
WHY THESE COLORS?
• Blue family (5m/15m) = short-term, high-frequency
• Purple (30m) = primary, institutional level
• Green/Red = universal up/down
• Gold VWAP = fair value anchor (stands out)
```
### **Settings by Trading Style**
**BEGINNER (Clean & Simple):**
```
ORB Display:
☐ Show 5min ORB
☐ Show 15min ORB
☑ Show 30min ORB (30min only - focus mode)
Number of Targets: 2-3
Target % of 30min Range: 50%
Chart Timeframe: 5-minute
```
**SCALPER (5-15 min holds):**
```
ORB Display:
☑ Show 5min ORB (early signals)
☐ Show 15min ORB
☑ Show 30min ORB (confirmation)
Number of Targets: 5
Target % of 30min Range: 30-40%
Label Size: Tiny
Chart Timeframe: 1-minute
```
**DAY TRADER (30-90 min holds):**
```
ORB Display:
☑ Show 5min ORB
☑ Show 15min ORB
☑ Show 30min ORB (all 3 - confluence mode)
Number of Targets: 3
Target % of 30min Range: 50%
Label Size: Small
Chart Timeframe: 5-minute (RECOMMENDED)
```
**SWING TRADER (2-4 hour holds):**
```
ORB Display:
☐ Show 5min ORB (too noisy for swings)
☑ Show 15min ORB
☑ Show 30min ORB
Number of Targets: 2-3
Target % of 30min Range: 75-100%
Label Size: Normal
Chart Timeframe: 15-minute
```
---
## 📈 TIMEFRAME SELECTION GUIDE
| Your Timeframe | What You See | Best For |
|---------------|--------------|----------|
| **1-minute** | Every tick, high noise | Scalping, precision entries |
| **5-minute** | Balanced clarity | Day trading (RECOMMENDED) |
| **15-minute** | Clean structure | Swing positions |
| **30-minute** | Too compressed | Not recommended (can't see ORB form) |
**💡 PRO TIP:**
- **Primary chart: 5-minute** (for entries and monitoring)
- **Secondary chart: 1-minute** (for precise timing)
- **Never go above 15-minute** (ORBs won't form properly)
---
## 🧠 READING THE 3-ORB STRUCTURE
### **Bullish Alignment Patterns**
```
PATTERN 1: "Staircase Expansion"
5min: ━━━━ (tight, 60 pts)
15min: ━━━━━━ (wider, 90 pts)
30min: ━━━━━━━━ (widest, 120 pts)
→ Bullish expansion, expect upside breakout
PATTERN 2: "Nested Compression"
5min: ━━ (30 pts)
15min: ━━━ (35 pts)
30min: ━━━━ (40 pts)
→ All tight, explosive breakout likely
PATTERN 3: "Early Commitment"
5min: ━━━━━━ (100 pts, already broken up)
15min: ━━━━━ (80 pts, holding)
30min: ━━━━━ (110 pts, about to break)
→ 5min led the way, 30min confirmation coming
```
### **Bearish Alignment Patterns**
```
PATTERN 1: "Waterfall Setup"
5min: ━━━━ (50 pts, broke down)
15min: ━━━━━ (70 pts, broke down)
30min: ━━━━━━ (90 pts, about to break)
→ Sequential breakdown, strong bearish momentum
PATTERN 2: "Failed Highs"
5min: ━━━━━━ (upper wick rejections)
15min: ━━━━━━ (couldn't break)
30min: ━━━━━━━ (topped out)
→ All 3 rejecting highs, bearish reversal likely
```
### **Neutral/Chop Patterns (AVOID TRADING)**
```
PATTERN 1: "Wide Divergence"
5min: ━━ (30 pts)
15min: ━━━━━━━ (120 pts)
30min: ━━━━━━━━━━━ (200 pts)
→ No consensus, unpredictable, skip
PATTERN 2: "Whipsaw City"
• Price breaking 5min up, then down, then up again
• 15min and 30min not aligned
• VWAP getting crossed every 5 minutes
→ Chop day, step aside, wait for clarity
```
---
## 📊 INTEGRATION WITH YM ULTIMATE SNIPER v8.1
**The 2-System Confluence Method:**
```
┌─────────────────────────────────────────────────────────────┐
│ STEP 1: SNIPER ORB → Defines "Zones That Matter" │
│ • 30min ORB = primary institutional range │
│ • VWAP = fair value anchor │
│ • Targets = profit zones │
│ • 5min/15min = early warning signals │
└─────────────────────────────────────────────────────────────┘
↓
┌─────────────────────────────────────────────────────────────┐
│ STEP 2: YM ULTIMATE SNIPER → Triggers precise entry │
│ • Wait for GOD MODE signal AT 30min ORB boundary │
│ • 6-gate filter: Score ≥9, fat body ≥70%, delta ≥70% │
│ • Candle Dominance Index (CDI) ≥7 │
│ • Intrabar pressure consistent throughout formation │
└─────────────────────────────────────────────────────────────┘
↓
┌─────────────────────────────────────────────────────────────┐
│ STEP 3: EXECUTE TRADE │
│ • ORB breakout + GOD MODE = MAXIMUM PROBABILITY │
│ • Enter ONLY when BOTH systems align │
│ • This is TRUE "sniper" trading (2-5 trades/day max) │
└─────────────────────────────────────────────────────────────┘
```
**Confluence Scoring for Combined System:**
```
SNIPER ORB Criteria:
□ 30min ORB complete (10:00 AM+) +2 points
□ All 3 ORBs broken in same direction +2 points
□ VWAP alignment (below=bull, above=bear) +1 point
□ Volume spike on breakout candle +1 point
□ Tight 3-ORB compression (<100pt divergence) +1 point
YM ULTIMATE SNIPER Criteria:
□ GOD MODE signal at ORB boundary +3 points
□ Score ≥9.0 (tier classification) +1 point
□ Candle Dominance Index (CDI) ≥8 +1 point
TOTAL POSSIBLE: 12 points
TRADE EXECUTION RULES:
• 10-12 points = MAX SIZE (this is the holy grail setup)
• 8-9 points = FULL SIZE (high probability)
• 6-7 points = HALF SIZE (moderate probability)
• <6 points = NO TRADE (wait for better alignment)
```
---
## 💡 COMMON MISTAKES & FIXES
```
❌ MISTAKE: Trading before 30min ORB completes
✅ FIX: Wait until 10:00 AM (NY) or 3:30 AM (London), NO EXCEPTIONS
❌ MISTAKE: Ignoring 5min and 15min ORBs (only watching 30min)
✅ FIX: Use all 3 for confluence - they're your early warning system
❌ MISTAKE: Chasing breakouts 100+ points beyond 30min ORB
✅ FIX: Wait for pullback to VWAP or 30min boundary for re-entry
❌ MISTAKE: Not adjusting target % for market conditions
✅ FIX: Volatile day (ORB >200pts)? Use 75-100% targets
Calm day (ORB <80pts)? Use 30-40% targets
❌ MISTAKE: Trading when all 3 ORBs are wildly different sizes
✅ FIX: Skip the day if 5m/15m/30m diverge by >100pts - no consensus
❌ MISTAKE: Forgetting VWAP position
✅ FIX: VWAP MUST confirm bias:
• Long: price > VWAP
• Short: price < VWAP
• If VWAP contradicts, skip the trade
❌ MISTAKE: Not respecting the 3-strike rule
✅ FIX: 3 losses = DONE for the session, no rationalization
❌ MISTAKE: Trading during lunch (12:00-1:00 PM ET)
✅ FIX: Volume dies, ORBs lose relevance, false signals increase
```
---
## 🔔 ALERT SETUP (ESSENTIAL)
**TradingView Alerts You MUST Set:**
```
ALERT 1: "30min ORB Complete"
• Type: Time-based
• Trigger: 10:00 AM ET (NY) or 3:30 AM ET (London)
• Message: "🎯 30min ORB complete - targets now active"
ALERT 2: "30min ORB High Breakout"
• Type: Crossing Up
• Value 1: Close
• Value 2: 30min ORB High (purple line)
• Message: "🚀 30m ORB HIGH broken - check for long setup"
ALERT 3: "30min ORB Low Breakdown"
• Type: Crossing Down
• Value 1: Close
• Value 2: 30min ORB Low (purple line)
• Message: "📉 30m ORB LOW broken - check for short setup"
ALERT 4: "VWAP Cross"
• Type: Crossing
• Value 1: Close
• Value 2: VWAP
• Message: "⚡ VWAP crossed - check institutional bias shift"
ALERT 5: "Target 1 Hit"
• Type: Crossing
• Value 1: High (for longs) or Low (for shorts)
• Value 2: First target line
• Message: "🎯 Target 1 hit - take 50% off, move stop to BE"
```
---
## 📱 MOBILE TRADING WORKFLOW
**TradingView Mobile App Setup:**
```
1. SAVE LAYOUT
• Chart: 5-minute timeframe
• SNIPER ORB indicator loaded
• YM Ultimate SNIPER v8.1 loaded (if using)
• Save as "SNIPER ORB - YM"
2. ENABLE NOTIFICATIONS
• Settings → Notifications → Push Alerts: ON
• All 5 alerts above configured
3. QUICK ACCESS
• Add YM futures to Watchlist: "MYM" or "YM1!"
• Pin SNIPER ORB layout to favorites
4. EXECUTION READY
• Broker app (TastyTrade, NinjaTrader, etc.) logged in
• Preset bracket orders:
- Entry: market order
- Stop: 30m ORB opposite boundary
- Targets: 3 levels (50%, 30%, 20% of position)
5. BATTERY & CONNECTIVITY
• Phone charged 100% before session
• Stable WiFi or LTE connection
• Backup power bank available
```
---
## 🎓 DAILY PERFORMANCE JOURNAL
**After Each Trading Session (MANDATORY):**
```
═══════════════════════════════════════════════════════════════
DATE: __________ SESSION: □ London □ New York
═══════════════════════════════════════════════════════════════
ORB DATA:
• 5min ORB Range: ______ points
• 15min ORB Range: ______ points
• 30min ORB Range: ______ points
• Alignment: □ Tight □ Moderate □ Wide (skip if wide)
VWAP BEHAVIOR:
• Opening position: □ Above price □ Below price □ Mixed
• Did VWAP act as support/resistance? □ Yes □ No
TRADES TAKEN:
Total Setups Identified: _____
Trades Executed: _____
Win/Loss Record: _____ W / _____ L
Win Rate: _____%
Gross P&L: $_______
Net P&L (after commissions): $_______
BEST TRADE:
• Setup: ____________________ (which of the 5 setups?)
• Entry Price: ______ Exit Price: ______
• Profit: $_______
• What went RIGHT: _________________________________
_________________________________________________
WORST TRADE:
• Setup: ____________________
• Entry Price: ______ Exit Price: ______
• Loss: $_______
• What went WRONG: _________________________________
_________________________________________________
• Lesson Learned: ___________________________________
3-STRIKE RULE STATUS:
□ No losses (great day)
□ 1 loss (still in game)
□ 2 losses (caution, half size)
□ 3 losses (stopped for day, as required)
TOMORROW'S ADJUSTMENTS:
□ _________________________________________________
□ _________________________________________________
□ _________________________________________________
EMOTIONAL STATE TODAY:
□ Calm & focused (optimal)
□ Anxious/rushed (need to work on patience)
□ Overconfident (dial back position size)
□ Fearful (review winning trades to build confidence)
═══════════════════════════════════════════════════════════════
```
---
## 🚀 YOUR FIRST LIVE TRADE WALKTHROUGH
**Step-by-Step for New York Session (Most Common):**
```
⏰ 9:15 AM ET - PREPARATION
□ Load SNIPER ORB on YM 5-minute chart
□ Select "New York" session in indicator settings
□ Verify VWAP is showing (gold line)
□ Check economic calendar (any big news at 9:30?)
□ Prepare mentally: "I will wait for 30min ORB to complete"
⏰ 9:30 AM ET - SESSION OPENS
□ Watch 3 ORBs begin forming:
• Blue lines (5min) will lock in at 9:35 AM
• Cyan lines (15min) will lock in at 9:45 AM
• Purple lines (30min) will lock in at 10:00 AM
□ Observe VWAP anchoring at 9:30 AM candle
□ DO NOT TRADE YET - just observe
⏰ 9:35 AM - 5MIN ORB COMPLETE
□ Note 5min high/low (blue lines locked)
□ Check info table: "5m Range = XX points"
□ If 5min ORB breaks early, note direction but DON'T ENTER
⏰ 9:45 AM - 15MIN ORB COMPLETE
□ Note 15min high/low (cyan lines locked)
□ Compare to 5min ORB: Aligned? Expanding?
□ Still waiting... patience pays
⏰ 10:00 AM - 30MIN ORB COMPLETE (TARGETS APPEAR!)
□ Purple lines locked (30m high/low)
□ Green/red dashed target lines appear automatically
□ Info table shows "Status: ✓ Complete"
□ NOW you can trade breakouts
⏰ 10:00 AM - 11:30 AM - TRADING WINDOW
□ Wait for price to break purple line (30m ORB high or low)
□ Confirm:
1. All 3 ORBs broken in same direction?
2. VWAP confirming (below=bullish, above=bearish)?
3. Volume spike visible?
4. YM SNIPER GOD MODE signal? (if using)
□ If all YES → ENTER TRADE:
• Market order at breakout close
• Stop at 30m ORB opposite boundary
• Targets at green/red dashed lines
⏰ TARGET MANAGEMENT
□ Price hits first target (1x) → Take 50% off, move stop to BE
□ Price hits second target (2x) → Take 30% off, trail stop
□ Price hits third target (3x) → Take 15% off, let 5% run
⏰ 12:00 PM - LUNCH (AVOID TRADING)
□ Volume dies down
□ ORBs become less relevant
□ Take a break, review morning trades
⏰ 1:00 PM - 3:00 PM - AFTERNOON SESSION
□ ORBs still valid but less reliable
□ Consider waiting for Power Hour (3:00-4:00 PM)
⏰ 5:00 PM - SESSION END
□ All ORB lines disappear automatically
□ VWAP disappears automatically
□ Chart cleans itself - ready for tomorrow
□ Fill out daily journal
```
---
## 🏆 WINNING MINDSET AFFIRMATIONS
Read these BEFORE each trading session:
```
"I trade ORBs, not chaos. Structure gives me edge."
"3 high-quality trades beat 20 mediocre ones."
"The 30min ORB is my anchor. I wait for it. Every. Single. Time."
"When all 3 ORBs align, institutions are unified. I follow."
"VWAP is my institutional compass. I respect its guidance."
"3 strikes and I'm out. Discipline > Ego."
"I am a SNIPER, not a machine gunner. Precision wins."
"My edge is patience. Let the ORBs complete."
"I don't predict. I react to proven structure."
"One perfect setup is worth waiting all morning."
```
---
## 📞 TROUBLESHOOTING
**"ORB lines not showing on chart!"**
→ Check timeframe: Must be 1min-30min (not daily/weekly)
→ Verify session time: Must be during London (3AM-9:30AM) or NY (9:30AM-5PM)
→ Check indicator status: Should say "⏳ Forming" or "✓ Complete" in table
**"Targets not appearing!"**
→ 30min ORB must be complete (10:00 AM NY / 3:30 AM London)
→ Check "Number of Targets" setting (must be ≥1)
→ Verify "Target % of 30min Range" is set (default 50%)
**"VWAP disappeared!"**
→ Normal behavior: VWAP auto-deletes at session end (5PM NY / 9:30AM London)
→ Toggle "Show Anchored VWAP" OFF then ON to reset
→ Check if you're viewing chart outside session hours
**"All 3 ORBs look the same!"**
→ This is actually GOOD - means tight alignment (high-probability setup)
→ If they're diverging wildly (>100pts difference), that's a skip signal
**"Info table blocking my view!"**
→ Info table is in top-right corner by default
→ Drag it to a different position (TradingView allows moving)
→ Or minimize it by clicking the small arrow
**"Colors are hard to see on my chart!"**
→ Go to indicator settings:
• "5min ORB", "15min ORB", "30min ORB" color pickers
• "Upside Targets", "Downside Targets" color pickers
• Recommended: Use contrasting colors vs your chart background
---
## 📚 ADVANCED INTEGRATION TECHNIQUES
### **Combining with Market Profile**
```
• Use Volume Profile to identify Value Area High (VAH) and Low (VAL)
• If 30min ORB aligns with VAH/VAL → extra confluence
• POC (Point of Control) acts similar to VWAP
```
### **Combining with Cumulative Delta**
```
• Check if delta is positive on 30min ORB high break (bullish confirmation)
• Negative delta on low break confirms bearish institutional flow
• Your YM SNIPER already tracks this - use together!
```
### **Combining with Options Flow**
```
• Large call buying near 30min ORB high? Institutions positioning for breakout
• Large put buying near 30min ORB low? Smart money hedging/shorting
• Tools: Unusual Whales, Cheddar Flow, OptionStrat
```
---
## 🎯 FINAL PRE-LIVE CHECKLIST
**DO NOT GO LIVE UNTIL ALL CHECKED:**
```
□ Practiced on TradingView Replay for 2+ weeks
□ Can identify all 5 setups by pattern recognition
□ Understand why targets come from 30min ORB only
□ Know difference between 5min/15min/30min roles
□ Risk management rules memorized (position sizing, 3-strike)
□ YM Ultimate SNIPER v8.1 loaded (optional but recommended)
□ All 5 TradingView alerts configured
□ Broker platform tested with demo account
□ Stop/target orders can be placed in <10 seconds
□ Daily journal template prepared
□ Emotional state: calm, patient, focused
□ Account size: Minimum $10,000 recommended
□ Understand auto-disappear behavior (ORBs delete at session end)
□ Know NOT to trade before 30min ORB complete
□ Comfortable with looking at chart and seeing 6+ lines (3 ORBs + targets)
IF ALL CHECKED → YOU'RE READY TO SNIPE! 🎯
IF ANY UNCHECKED → KEEP PRACTICING, DON'T RUSH
```
---
## 💎 THE CORE PRINCIPLE
```
╔═══════════════════════════════════════════════════════════╗
║ ║
║ "The ORB doesn't predict the market. ║
║ The ORB reveals where institutions are positioned. ║
║ ║
║ When you see all 3 ORBs align and break, ║
║ you're not guessing direction— ║
║ you're following the billion-dollar order flow." ║
║ ║
║ THAT'S YOUR EDGE. ║
║ ║
╚═══════════════════════════════════════════════════════════╝
```
**🎯 Good luck, stay patient, and happy sniping! 🎯**
═══════════════════════════════════════════════════════════════════
END OF SNIPER ORB TRADING CHEAT SHEET v3.0
═══════════════════════════════════════════════════════════════════

Parabolic SAR (PSAR) - Basit//@version=5
indicator("Parabolic SAR (PSAR) - Basit", overlay=true)
start = input.float(0.02, "Start (Step)", step=0.01)
increment = input.float(0.02, "Increment", step=0.01)
maximum = input.float(0.2, "Maximum", step=0.01)
showDots = input.bool(true, "Dotları Göster")
showLine = input.bool(false, "PSAR Çizgisi Göster")
bgTrend = input.bool(true, "Arka planı trende göre renklendir")
psar = ta.sar(start, increment, maxim
bull = close > psar
bear = close < psar
psarColor = bull ? color.green : color.
plot(showLine ? psar : na, title="PSAR Line", color=psarColor, linewi
plotshape(showDots and bull, title="PSAR Bull Dot", location=location.belowbar, style=shape.circle, size=size.tiny, color=color.green)
plotshape(showDots and bear, title="PSAR Bear Dot", location=location.abovebar, style=shape.circle, size=size.tiny, color=color.red)
bgcolor(bgTrend ? (bull ? color.new(color.green, 90) : color.new(color.red, 90)) : n
buySignal = ta.crossover(close, psar)
sellSignal = ta.crossunder(close, psa
plotshape(buySignal, title="AL Sinyali", location=location.belowbar, style=shape.triangleup, size=size.small, color=color.green)
plotshape(sellSignal, title="SAT Sinyali", location=location.abovebar, style=shape.triangledown, size=size.small, color=color.red)
alertcondition(buySignal, title="AL (PSAR flip)", message="PSAR flip: AL sinyali")
alertcondition(sellSignal, title="SAT (PSAR flip)", message="PSAR flip: SAT sinyali")

SuperTrend Long/Short Signals With Fibonacci“By using the updated version of the previously published indicator with a Fibonacci extension, you can obtain multiple take-profit levels and make profitable trades.
Wishing you plenty of profits.

SuperTrend Long/Short Signals“Provides trend-based long and short signals. With regular use while adhering to the entry, stop-loss, and take-profit levels, profits can be achieved.”

Vortex Imbalance DetectorVortex Imbalance Detector (VID)
Core Purpose:
To spot "fresh" institutional order flow entering the market, aiming to catch the early stage of a potential reversal driven by an imbalance between aggressive buyers and sellers.
It looks for moments when a surge in buying or selling pressure coincides with a sharp acceleration in price momentum at a market extreme.
The Vortex Imbalance Detector identifies high-probability reversal points by detecting simultaneous shifts in order flow (buy/sell pressure) and price momentum acceleration.
What It Does:
Order Flow Proxy: Creates a cumulative delta-like metric using price action (body vs. range) to estimate net buying or selling pressure.
Momentum Vortex: Calculates price acceleration (the rate of change of velocity) to gauge the force behind a move.
Imbalance Signal: Triggers when both conditions align:
Flow Flip: The order flow proxy crosses above/below zero with significant strength (exceeding a threshold).
Vortex Reversal: The momentum acceleration confirms the direction (positive for buys, negative for sells).
Price Extreme: The signal occurs at a recent low (for buys) or high (for sells).
Output:
Buy Signal (▲): A bullish order flow imbalance with upward momentum acceleration at a short-term low.
Sell Signal (▼): A bearish order flow imbalance with downward momentum acceleration at a short-term high.

RSI+Breadth Multi-Factor# RSI+ Breadth Multi-Factor Indicator
**Multi-factor scoring system for US market timing | 美股多因子择时评分系统**
[! (img.shields.io)](www.tradingview.com)
[! (img.shields.io)](www.tradingview.com)
[! (img.shields.io)](LICENSE)
---
## Overview | 概述
A quantitative indicator that combines **RSI**, **market breadth** (% above 20/50-day MA), and **up/down volume ratio** to generate actionable buy/sell signals for SPY, QQQ, and IWM.
这是一个结合 **RSI**、**市场广度**(站上20/50日均线比例)和 **涨跌成交量比** 的量化指标,为 SPY、QQQ 和 IWM 生成可操作的买卖信号。
---
## Features | 功能特点
| Feature | 功能 |
|---------|------|
| 🎯 Multi-factor scoring (-10 to +10) | 多因子评分系统 (-10 到 +10) |
| 📊 RSI + Breadth + Volume integration | RSI + 广度 + 成交量三重验证 |
| 🔀 Three markets: SPY, QQQ, IWM | 三大市场:SPY、QQQ、IWM |
| 🔥 Cross-market resonance detection | 跨市场共振信号检测 |
| 📈 Trend filter (MA-based) | 趋势过滤(均线判断) |
| ⏰ Auto-adapts to intraday timeframes | 自动适配日内时间周期 |
| 🎚️ Three modes: Aggressive/Standard/Conservative | 三种模式:激进/标准/保守 |
---
## Signal Reference | 信号说明
| Score | Emoji | Signal | 中文 | Action |
|:-----:|:-----:|--------|:----:|--------|
| ≥ 6 | 🚀 | **PANIC LOW** | 恐慌低点 | Strong buy 强烈买入 |
| ≥ 4 | 📈 | **BUY ZONE** | 低吸区 | Accumulate 分批建仓 |
| -3~3 | - | **HOLD** | 持有 | Hold position 持仓观望 |
| ≤ -4↑ | ⭐ | **ELEVATED** | 高估 | Hold cautious 持有但谨慎 |
| ≤ -4↓ | ⚡ | **CAUTION** | 观望 | Take profit 止盈 |
| ≤ -6↓ | ⚠️ | **REDUCE** | 减仓 | Reduce position 减少仓位 |
> **↑ = Uptrend** (price > MA) | **↓ = Downtrend** (price < MA)
### Resonance Signals | 共振信号
| Emoji | Signal | Description |
|:-----:|--------|-------------|
| 🔥 | Resonance Buy | Multiple markets in buy zone 多市场同时低吸 |
| ❄️ | Resonance Risk | Multiple markets in risk zone 多市场同时高估 |
---
## Scoring Logic | 评分逻辑
### Factors | 因子
| Factor | Weight | Buy Score | Sell Score |
|--------|--------|-----------|------------|
| **RSI** | 1x | RSI < 30 → +2, < 40 → +1 | RSI > 75 → -2, > 65 → -1 |
| **FI (50D MA%)** | Bottom focus | < 25% → +3, < 35% → +2 | > 85% → -2, > 78% → -1 |
| **TW (20D MA%)** | Top focus | < 30% → +1 | > 82% → -3, > 72% → -2 |
| **Volume Ratio** | 1x | UVOL/DVOL < 0.5 → +2 | > 2.5 → -2 |
### Breadth Symbols | 广度数据
| Market | TW Symbol | FI Symbol | Volume |
|--------|-----------|-----------|--------|
| SPY (S&P 500) | INDEX:S5TW | INDEX:S5FI | USI:UVOL/DVOL |
| QQQ (NASDAQ) | INDEX:NCTW | INDEX:NCFI | USI:UVOLQ/DVOLQ |
| IWM (Russell 2000) | INDEX:R2TW | INDEX:R2FI | USI:UVOL/DVOL |
---
## Settings | 设置说明
### Mode | 模式
- **Aggressive**: Lower thresholds, shorter cooldown (5 bars)
- **Standard**: Balanced defaults (10 bar cooldown)
- **Conservative**: Higher thresholds, longer cooldown (15 bars)
### Key Parameters | 关键参数
| Parameter | Default | Description |
|-----------|---------|-------------|
| RSI Length | 14 | RSI calculation period |
| Trend MA Length | 10 | MA for trend filter |
| Cooldown Bars | 10 | Min bars between same signals |
| Resonance Window | 3 | Bars to check for multi-market agreement |
| Min Markets | 2 | # of markets needed for resonance |
---
## Usage | 使用方法
### Installation | 安装
1. Copy the indicator code
2. In TradingView: **Pine Editor** → **New** → Paste code → **Add to Chart**
### Recommended Setup | 推荐设置
- **Timeframe**: Daily (D) for best accuracy | 推荐日线图
- **Markets**: Apply on SPY, QQQ, or IWM | 应用于SPY/QQQ/IWM
- **Mode**: Start with "Standard" | 建议从"标准"模式开始
### Intraday Mode | 日内模式
The indicator automatically detects intraday timeframes and adjusts:
- Uses only RSI + Volume factors (TW/FI are daily-only data)
- Lowers signal thresholds accordingly
指标会自动检测日内周期并调整:
- 仅使用 RSI + 成交量因子(TW/FI 仅有日线数据)
- 相应降低信号触发阈值
---
## Dashboard | 仪表盘
Displays real-time factor breakdown:
```
┌────────┬───────┬────────┐
│ Factor │ Score │ Weight │
├────────┼───────┼────────┤
│ RSI │ 1.0 │ 1x │
│ FI(50D)│ 2.0 │ Bottom │
│ TW(20D)│ -1.0 │ Top │
│ Vol │ 1.0 │ 1x │
│ Trend │ ↑ │ 10MA │
├────────┼───────┼────────┤
│ Total │ 3.0 │ HOLD │
└────────┴───────┴────────┘
```
---
## Alerts | 警报
Available alerts for each market (SPY/QQQ/IWM):
- Panic Low / Buy Zone (entry signals)
- Reduce / Caution (exit signals)
- Resonance Buy / Risk (cross-market confirmation)
每个市场(SPY/QQQ/IWM)可设置以下警报:
- 恐慌低点 / 低吸区(入场信号)
- 减仓 / 观望(出场信号)
- 共振买入 / 风险(跨市场确认)
---
## Trend Filter | 趋势过滤
**Key feature**: Risk signals (CAUTION/REDUCE) only trigger when **price is below the trend MA**.
When price is above MA (uptrend), the indicator shows **ELEVATED** ⭐ instead, preventing premature exits during strong rallies.
**核心功能**:风险信号(观望/减仓)仅在 **价格跌破趋势均线** 时触发。
当价格在均线之上(上升趋势)时,指标显示 **高估** ⭐,避免在强势上涨中过早离场。
---
## Disclaimer | 免责声明
This indicator is for **educational and informational purposes only**. It is not financial advice. Past performance does not guarantee future results. Always do your own research and consider your risk tolerance before trading.
本指标仅供 **教育和参考用途**,不构成投资建议。历史表现不代表未来收益。交易前请自行研究并考虑风险承受能力。
---
## License | 许可
MIT License - Free to use and modify with attribution.
MIT 许可证 - 可自由使用和修改,请注明出处。
---
## Author | 作者
Built with ❤️ for the trading community.
为交易社区精心打造 ❤️

Golden Volume Lines📌 Golden Volume — Lines (Golden Team)
Golden Volume — Lines is an advanced volume-based indicator that detects Ultra High Volume candles using a statistical percentile model, then automatically draws and tracks key price levels derived from those candles.
The indicator highlights where real market interest and liquidity appear and shows how price reacts when those levels are broken.
🔍 How It Works
Volume Measurement
Choose between:
Units (raw volume)
Money (Volume × Average Price)
Average price can be calculated using HL2 or OHLC4.
Percentile-Based Classification
Volume is classified into:
Medium
High
Ultra High Volume
Thresholds are calculated using a rolling percentile window.
Ultra Volume candles are colored orange.
Dynamic High & Low Levels
For every Ultra Volume candle:
A High and Low dotted line is drawn.
Lines extend to the right until price breaks them.
Smart Line Break Detection (Wick-Based)
A line is considered broken when price wicks through it.
When a break occurs:
🟧 Orange line → broken by an Ultra Volume candle
⚪ White line → broken by a normal candle
The line stops exactly at the breaking candle.
🔔 Alerts
Alert on Ultra High Volume candles
Alert when a High or Low line is broken
Separate alerts for:
Break by Ultra Volume candle
Break by Normal candle
🎯 Use Cases
Breakout & continuation confirmation
Liquidity sweep detection
Volume-validated support & resistance
Market reaction after extreme participation
⚙️ Key Inputs
Volume display mode (Units / Money)
Percentile thresholds
Lookback window size
Maximum number of active Ultra levels
Optional dynamic alerts
⚠️ Disclaimer
This indicator is a volume and market structure tool, not a standalone trading system.
Always use proper risk management and additional confirmation.

PEAD ScreenerPEAD Screener - Post-Earnings Announcement Drift Scanner
═══════════════════════════════════════════════════════════════
WHY EARNINGS ANNOUNCEMENTS CREATE OPPORTUNITY
═══════════════════════════════════════════════════════════════
The days immediately following an earnings announcement are among the noisiest periods for any stock. Within hours, the market must digest new information about a company's profits, revenue, and future outlook. Analysts scramble to update their models. Institutions rebalance positions. Retail traders react to headlines.
This chaos creates a well-documented phenomenon called Post-Earnings Announcement Drift (PEAD): stocks that beat expectations tend to keep rising, while those that miss tend to keep falling - often for weeks after the initial announcement. Academic research has confirmed this pattern persists across decades and markets.
But not every earnings surprise is equal. A company that beats estimates by 5 cents might move very differently than one that beats by 5 cents with unusually high volume, or one where both earnings AND revenue exceeded expectations. Raw numbers alone don't tell the full story.
═══════════════════════════════════════════════════════════════
HOW "STANDARDIZED UNEXPECTED" METRICS CUT THROUGH THE NOISE
═══════════════════════════════════════════════════════════════
This screener uses a statistical technique to measure how "surprising" a result truly is - not just whether it beat or missed, but how unusual that beat or miss was compared to the company's own history.
The core idea: convert raw surprises into Z-scores.
A Z-score answers the question: "How many standard deviations away from normal is this result?"
- A Z-score of 0 means the result was exactly average
- A Z-score of +2 means the result was unusually high (better than ~95% of historical results)
- A Z-score of -2 means the result was unusually low
By standardizing surprises this way, we can compare apples to apples. A small-cap biotech's $0.02 beat might actually be more significant than a mega-cap's $0.50 beat, once we account for each company's typical variability.
This screener applies this standardization to three dimensions: earnings (SUE), revenue (SURGE), and volume (SUV).
═══════════════════════════════════════════════════════════════
THE 9 SCREENING CRITERIA
═══════════════════════════════════════════════════════════════
─────────────────────────────────────────
1. SUE (Standardized Unexpected Earnings)
─────────────────────────────────────────
WHAT IT IS:
SUE measures how surprising an earnings result was, adjusted for the company's historical forecast accuracy.
Calculation: Take the earnings surprise (actual EPS minus analyst estimate), then divide by the standard deviation of past forecast errors. This uses a rolling window of the last 8 quarters by default.
Formula: SUE = (Actual EPS - Estimated EPS) / Standard Deviation of Past Errors
HOW TO INTERPRET:
- SUE > +2.0: Strongly positive surprise - earnings beat expectations by an unusually large margin. These stocks often continue drifting higher.
- SUE between 0 and +2.0: Modest positive surprise - beat expectations, but within normal range.
- SUE between -2.0 and 0: Modest negative surprise - missed expectations, but within normal range.
- SUE < -2.0: Strongly negative surprise - significant miss. These stocks often continue drifting lower.
For long positions, look for SUE values above +2.0, ideally combined with positive SURGE.
─────────────────────────────────────────
2. SURGE (Standardized Unexpected Revenue)
─────────────────────────────────────────
WHAT IT IS:
SURGE applies the same standardization technique to revenue surprises. While earnings can be manipulated through accounting choices, revenue is harder to fake - it represents actual sales.
Calculation: Take the revenue surprise (actual revenue minus analyst estimate), then divide by the standard deviation of past revenue forecast errors.
Formula: SURGE = (Actual Revenue - Estimated Revenue) / Standard Deviation of Past Errors
HOW TO INTERPRET:
- SURGE > +1.5: Strongly positive revenue surprise - the company sold significantly more than expected.
- SURGE between 0 and +1.5: Modest positive surprise.
- SURGE < 0: Revenue missed expectations.
The most powerful signals occur when BOTH SUE and SURGE are positive and elevated (ideally SUE > 2.0 AND SURGE > 1.5). This indicates the company beat on both profitability AND top-line growth - a much stronger signal than either alone.
When SUE and SURGE diverge significantly (e.g., high SUE but negative SURGE), treat with caution - the earnings beat may have come from cost-cutting rather than genuine growth.
─────────────────────────────────────────
3. SUV (Standardized Unexpected Volume)
─────────────────────────────────────────
WHAT IT IS:
SUV detects unusual trading volume after accounting for how volatile the stock is. More volatile stocks naturally have higher volume, so raw volume comparisons can be misleading.
Calculation: This uses regression analysis to model the expected relationship between price volatility and volume. The "unexpected" volume is the residual - how much actual volume deviated from what the model predicted. This residual is then standardized into a Z-score.
In plain terms: SUV asks "Given how much this stock typically moves, is today's volume unusually high or low?"
HOW TO INTERPRET:
- SUV > +2.0: Exceptionally high volume relative to the stock's volatility. This often signals institutional activity - big players moving in or out.
- SUV between +1.0 and +2.0: Elevated volume - above normal interest.
- SUV between -1.0 and +1.0: Normal volume range.
- SUV < -1.0: Unusually quiet - less activity than expected.
High SUV combined with positive price movement suggests accumulation (buying). High SUV combined with negative price movement suggests distribution (selling).
─────────────────────────────────────────
4. % From D0 Close
─────────────────────────────────────────
WHAT IT IS:
This measures how far the current price has moved from the closing price on its initial earnings reaction day (D0). The "reaction day" is the first trading day that fully reflects the earnings news - typically the day after an after-hours announcement, or the announcement day itself for pre-market releases.
Calculation: ((Current Price - D0 Close) / D0 Close) × 100
HOW TO INTERPRET:
- Positive values: Stock has gained ground since earnings. The higher the percentage, the stronger the post-earnings drift.
- 0% to +5%: Modest positive drift - earnings were received well but momentum is limited.
- +5% to +15%: Strong drift - buyers continue accumulating.
- > +15%: Exceptional drift - significant institutional interest likely.
- Negative values: Stock has given back gains or extended losses since earnings. May indicate the initial reaction was overdone, or that sentiment is deteriorating.
This metric is most meaningful within the first 5-20 trading days after earnings. Extended drift (maintaining gains over 2+ weeks) is a stronger signal than a quick spike that fades.
─────────────────────────────────────────
5. # Pocket Pivots
─────────────────────────────────────────
WHAT IT IS:
Pocket Pivots are a volume-based pattern developed by Chris Kacher and Gil Morales. They identify days where institutional buyers are likely accumulating shares without causing obvious breakouts.
Calculation: A Pocket Pivot occurs when:
- The stock closes higher than it opened (up day)
- The stock closes higher than the previous day's close
- Today's volume exceeds the highest down-day volume of the prior 10 trading sessions
The screener counts how many Pocket Pivots have occurred since the earnings announcement.
HOW TO INTERPRET:
- 0 Pocket Pivots: No detected institutional accumulation patterns since earnings.
- 1-2 Pocket Pivots: Some institutional buying interest - worth monitoring.
- 3+ Pocket Pivots: Strong accumulation signal - institutions appear to be building positions.
Pocket Pivots are most significant when they occur:
- Immediately following earnings announcements
- Near moving average support (10-day, 21-day, or 50-day)
- On above-average volume
- After a period of price consolidation
Multiple Pocket Pivots in a short period suggest sustained institutional demand, not just a one-day event.
─────────────────────────────────────────
6. ADX/DI (Trend Strength and Direction)
─────────────────────────────────────────
WHAT IT IS:
ADX (Average Directional Index) measures trend strength regardless of direction. DI (Directional Indicator) shows whether the trend is bullish or bearish.
Calculation: ADX uses a 14-period lookback to measure how directional (trending) price movement is. Values range from 0 to 100. The +DI and -DI components compare upward and downward movement.
The screener shows:
- ADX value (trend strength)
- Direction indicator: "+" for bullish (price trending up), "-" for bearish (price trending down)
HOW TO INTERPRET:
- ADX < 20: Weak trend - the stock is moving sideways, choppy. Not ideal for momentum trading.
- ADX 20-25: Trend is emerging - potentially starting a directional move.
- ADX 25-40: Strong trend - clear directional movement. Good for momentum plays.
- ADX > 40: Very strong trend - powerful move in progress, but may be extended.
The direction indicator (+/-) tells you which way:
- "25+" means ADX of 25 with bullish direction (uptrend)
- "25-" means ADX of 25 with bearish direction (downtrend)
For post-earnings plays, ideal setups show ADX rising above 25 with positive direction, confirming the earnings reaction is developing into a sustained trend rather than a one-day spike.
─────────────────────────────────────────
7. Institutional Buying PASS
─────────────────────────────────────────
WHAT IT IS:
This proprietary composite indicator detects patterns consistent with institutional accumulation at three stages after earnings:
EARLY (Days 0-4): Looks for "large block" buying on the earnings reaction day (exceptionally high volume with a close in the upper half of the day's range) combined with follow-through buying on the next day.
MID (Days 5-9): Checks for sustained elevated volume (averaging 1.5x the 20-day average) combined with positive drift and consistent upward price movement (more up days than down days).
LATE (Days 10+): Detects either visible accumulation (positive drift with high volume) OR stealth accumulation (positive drift with unusually LOW volume - suggesting smart money is quietly building positions without attracting attention).
HOW TO INTERPRET:
- Check mark/value of '1': Institutional buying pattern detected. The stock shows characteristics consistent with large players accumulating shares.
- X mark/value of '0': No institutional buying pattern detected. This doesn't mean institutions aren't buying - just that the typical footprints aren't visible.
A passing grade here adds conviction to other bullish signals. Institutions have research teams, information advantages, and long time horizons. When their footprints appear in the data, it often precedes sustained moves.
Important: This is a pattern detection tool, not a guarantee. Always combine with other analysis.
─────────────────────────────────────────
8. Strong ATR Drift PASS
─────────────────────────────────────────
WHAT IT IS:
This measures whether the stock has drifted significantly relative to its own volatility. Instead of asking "did it move 10%?", it asks "did it move more than 1.5 ATRs?"
ATR (Average True Range) measures a stock's typical daily movement. A volatile stock might move 5% daily, while a stable stock might move 0.5%. Using ATR normalizes for this difference.
Calculation:
ATR Drift = (Current Close - D0 Close) / D0 ATR in dollars
The indicator passes when ATR Drift exceeds 1.5 AND at least 5 days have passed since earnings.
HOW TO INTERPRET:
- Check mark/value of '1': The stock has drifted more than 1.5 times its average daily range since earnings - a statistically significant move that suggests genuine momentum, not just noise.
- X mark/value of '0': The drift (if any) is within normal volatility bounds - could just be random fluctuation.
Why wait 5 days? The immediate post-earnings reaction (days 0-2) often includes gap fills and noise. By day 5, if the stock is still extended beyond 1.5 ATRs from the earnings close, it suggests real buying pressure, not just a reflexive gap.
A passing grade here helps filter out stocks that "beat earnings" but haven't actually moved meaningfully. It focuses attention on stocks where the market is voting with real capital.
─────────────────────────────────────────
9. Days Since D0
─────────────────────────────────────────
WHAT IT IS:
Simply counts the number of trading days since the earnings reaction day (D0).
HOW TO INTERPRET:
- Days 0-5 (Green): Fresh earnings - the information is new, institutional repositioning is active, and momentum trades are most potent. This is the "sweet spot" for PEAD strategies.
- Days 6-10 (Neutral): Mid-period - some edge remains but diminishing. Good for adding to winning positions, less ideal for new entries.
- Days 11+ (Red): Extended period - most of the post-earnings drift has typically played out. Higher risk that momentum fades or reverses.
Research shows PEAD effects are strongest in the first 5-10 days after earnings, then decay. Beyond 20-30 days, the informational advantage of the earnings surprise is largely priced in.
Use this to prioritize: focus on stocks with strong signals that are still in the early window, and be more selective about entries as days accumulate.
═══════════════════════════════════════════════════════════════
PUTTING IT ALL TOGETHER
═══════════════════════════════════════════════════════════════
You can use this screener in the chart view or in the Screener.
One combination of the above filters to develop a shortlist of positive drift candidates may be:
- SUE > 2.0 (significant earnings beat)
- SURGE > 1.5 (significant revenue beat)
- Positive % From D0 Close (price confirming the good news)
- Institutional Buying PASS (big players accumulating)
- Strong ATR Drift PASS (statistically significant movement)
- Days Since D0 < 10 (still in the active drift window)
No single indicator is sufficient. The power comes from convergence - when multiple independent measures all point the same direction.
═══════════════════════════════════════════════════════════════
SETTINGS
═══════════════════════════════════════════════════════════════
Key adjustable parameters:
- SUE Method: "Analyst-based" uses consensus estimates; "Time-series" uses year-over-year comparison
- Window Size: Number of quarters used for standardization (default: 8)
- ATR Drift Threshold: Minimum ATR multiple for "strong" classification (default: 1.5)
- Institutional Buying thresholds: Adjustable volume and CLV parameters
═══════════════════════════════════════════════════════════════
DISCLAIMER
═══════════════════════════════════════════════════════════════
This screener is a research tool, not financial advice. Past patterns do not guarantee future results. Always conduct your own due diligence and manage risk appropriately. Post-earnings trading involves significant uncertainty and volatility. The 'SUE' in this indicator does not represent a real person; any similarity to actual Sue's (or Susans for that matter) living or dead is quite frankly ridiculous, not to mention coincidental.

Custom Monthly Volume Profile [Multi-Timeframe]This indicator renders a high-precision Monthly Volume Profile designed for intraday traders and practitioners of Auction Market Theory. Unlike standard volume profiles, this script utilizes Multi-Timeframe (MTF) data request capability to build the profile from lower timeframe data (e.g., 5-minute bars) while displaying it on your trading timeframe.
This tool is optimized to keep your chart clean while providing critical developing levels (POC, VAH, VAL) and historical context from the previous month.
Key Features:
1. Dynamic "Auto-Scaling" Width One of the biggest issues with monthly profiles is visual clutter.
Early Month: The profile starts wide (default 10% width) so you can clearly see the developing structure when data is scarce.
Late Month: As volume accumulates, the profile automatically shrinks (scales down to 2% width) to prevent the histogram from obscuring price action.
Note: This can be toggled off for a static width.
2. Developing & Static Levels
Current Month: Displays real-time Developing Point of Control (dPOC), Value Area High (dVAH), and Value Area Low (dVAL).
Previous Month: Automatically locks in the levels from the previous month at the close, providing immediate support/resistance references for the new month.
3. Time-Filtered Alerts Avoid waking up to notifications during low-volume overnight sessions. This script includes a Session Filter (Default: 0830-1500).
Alerts for crossing POC, VAH, or VAL will only trigger if the price cross occurs within the user-defined time window.
4. Calculation Precision
Multi-Timeframe Data: The profile is built using lower timeframe data (Input: Calculation Precision) rather than just the current chart bars. This ensures the Volume Profile shape remains accurate even when viewing higher timeframes.
Row Size: Fully adjustable "Tick/Row Size" to control the resolution of the volume buckets.
Settings Overview:
Calculation Precision: Determine the granularity of the data (e.g., "5" for 5-minute data).
Row Size: Controls vertical resolution (Lower = higher detail).
Value Area %: Standard 70% default, fully adjustable.
Auto-Width: Set the Start % (Day 1) and End % (Day 31).
Alerts: Toggle Current or Previous month alerts and define the active time session.
Visual Customization:
Customize colors for the Histogram (Value Area vs. Outer Area).
Customize line width and colors for POC, VAH, and VAL.
Supports Right or Left alignment.
Disclaimer: This tool is for informational purposes only. Past performance and volume levels do not guarantee future price action.

Gamma & Volatility Levels [Pro]General Purpose
This indicator analyzes volatility levels and expected price movements, combining gamma concepts (financial options) with volatility analysis to identify support and resistance zones.
Main Components
High Volatility Level (HVL): Calculates a volatility level based on the simple moving average (SMA) of the price plus one standard deviation. This level is represented by an orange line showing where volatility is concentrated.
Expected Movement (Movimiento Esperante): Uses the Average True Range (ATR) multiplied by an adjustable factor to project potential upward and downward movement ranges from the current price. It is drawn in green (upward) and red (downward).
Gamma Levels (Nivelas Gamma): Identifies two key levels: the call resistance (highest high of the last 50 periods) in blue, and the put support (lowest low) in purple. These are based on recent extreme prices.
Additional Information: The indicator calculates the percentage distance between the current price and the HVL, displaying it in a label.
Visual Elements
Colored lines on the chart for each level.
Labels with exact values next to each line.
A table in the upper right corner summarizing all calculated values.
Options to show or hide each element according to preference.
This is a useful tool for traders who work with options or seek to identify levels of extreme volatility and dynamic support/resistance zones.

DeltaPulseDeltaPulse: Professional Cumulative Volume Delta Indicator
DeltaPulse is a free cumulative volume delta (CVD) indicator engineered for modern traders who demand precision, adaptability, and visual clarity. Unlike traditional CVD tools that often suffer from scaling issues, excessive noise, or poor responsiveness across timeframes, DeltaPulse delivers a streamlined, professional-grade solution that "just works" – providing actionable insights into buying and selling pressure with minimal setup.
This indicator accumulates the net difference between buying and selling volume (inferred from candle direction), normalizes it intelligently for consistent readability, and applies advanced smoothing to filter out market noise while preserving momentum signals. The result is a clean, momentum-colored line in a dedicated pane, enhanced by subtle visual cues that highlight key market dynamics.
Whether you're a day trader scalping intraday moves, a swing trader analyzing weekly trends, or an institutional analyst reviewing futures contracts, DeltaPulse adapts seamlessly to your workflow. It's designed to be your go-to tool for confirming trends, spotting divergences, and identifying order flow imbalances – all without the bloat of overcomplicated features.
Key Features
Intelligent Normalization for Universal Compatibility
Automatically adjusts scaling based on chart timeframe and symbol volume profile.
Intraday (1-5 min): Uses a 100-period volume average for responsive, lively signals.
Intraday (15+ min): 50-period average for balanced sensitivity.
Daily/Weekly+: 20-period average for clean, long-term perspective.
Ensures the indicator remains visually meaningful and non-flat on any asset – from low-volume penny stocks to high-liquidity indices like ES or NQ.
Advanced Smoothing Options
Six moving averages to match your trading style:
EMA - Quick reactions to recent delta shifts
SMA - Simple Moving Average - Stable, noise-resistant baseline
WMA - Weighted Moving Average - Emphasizes recent data with linear weighting
HMA - Hull Moving Average - Ultra-smooth yet lag-free – ideal for momentum trading
RMA - Running Moving Average (Wilder's) - Trend-following with minimal whipsaws
VWMA - Volume-Weighted Moving Average - Highlights high-volume delta moves
Lower values increase reactivity; higher values enhance smoothness.
Flexible Reset Mechanisms
Session Reset: Clears CVD at the first regular trading bar each day – perfect for intraday analysis.
Weekly Reset: Resets at the start of each new week – suited for swing and position trading.
No manual intervention required; the indicator handles resets reliably across all timeframes.
Background Shading:
Light green tint above zero; light red below.
Extreme highlights when smoothed CVD exceeds 90% of its 80-bar high/low – flags potential exhaustion or absorption zones.
How It Works
DeltaPulse calculates a simple yet effective volume delta on each bar:
Bullish Bar (close ≥ open): Adds full volume as positive delta.
Bearish Bar (close < open): Subtracts full volume as negative delta.
This raw delta accumulates into a running total (CVD), resetting based on your chosen mode. The total is then:
Normalized against a timeframe-adaptive volume average to ensure consistent scaling.
Smoothed using your selected MA type for noise reduction and trend clarity.
Plotted with momentum-based coloring and visual enhancements.
The output is a single, intuitive line that reveals the underlying battle between buyers and sellers – far more reliably than raw volume bars or basic oscillators.
Trading Applications
DeltaPulse shines in revealing order flow dynamics that price action alone often conceals. Here are proven ways to integrate it:
Trend Confirmation & Momentum Trading
Bullish Setup: Rising green line above zero confirms buyer control – enter longs on pullbacks to support.
Bearish Setup: Falling red line below zero signals seller dominance – short on rallies to resistance.
Zero Line Crosses as Reversal Signals
A crossover from negative to positive territory often marks a sentiment shift – use for entry triggers.
Combine with volume spikes or key levels for high-probability setups.
Enhancement: VWMA mode amplifies signals on high-volume breakouts.
Absorption & Exhaustion Zones
Watch for extreme background highlights: A spike to highs followed by reversal suggests large players absorbing supply.
Ideal for fade trades near overextended levels (e.g., after news events).
Avoid low-volume or illiquid symbols, as delta inference relies on reliable candle data.
Timeframe-Agnostic: Solves the common CVD pitfall of being "dead" on intraday charts or erratic on daily ones through smart, automatic normalization.
Lag-Free Responsiveness: The default HMA smoothing strikes a rare balance – smoother than EMA, faster than SMA – without the computational overhead of exotic filters.
Zero Clutter: No histograms, no extraneous plots, no overwhelming alerts. Just pure, distilled order flow intelligence.

FVG 15 min PilotOverview
This indicator implements a fully automated FVG (Fair Value Gap) rejection trading strategy with precise entry management, session limitation, and performance tracking. The indicator identifies fair value gaps, waits for the first tap into the 0.79 level, and automatically accepts entries with a fixed stop loss and an adjustable risk-reward ratio.
Overview
This indicator implements a fully automated FVG (Fair Value Gap) rejection trading strategy with precise entry management, session limitation, and performance tracking. The indicator detects fair value gaps, waits for the first tap into the 0.79 level, and automatically accepts entries with a fixed stop loss and an adjustable risk-reward ratio.
... Core Trading Logic
Entry Conditions
For LONG (Bullish FVG Rejection):
A bullish FVG must exist (upward price gap)
FVG must not be older than X candles (default: 20)
FVG must not be larger than X ticks (default: 50)
FVG must not have been tapped (not even before the trading session)
Price must touch the 0.79 level of the FVG
Entry occurs exactly at the 0.79 level (79% of the lower to the upper edge of the FVG)
SL is placed X ticks below the entry (default: 25)
TP is calculated based on a risk:reward ratio (default: 1:1)
For SHORT (Bearish FVG Rejection):
Identical logic to bearish FVGs
Entry at the 0.79 level (79% of the upper to the lower edge)
SL X ticks above the entry
TP is calculated based on a risk:reward ratio
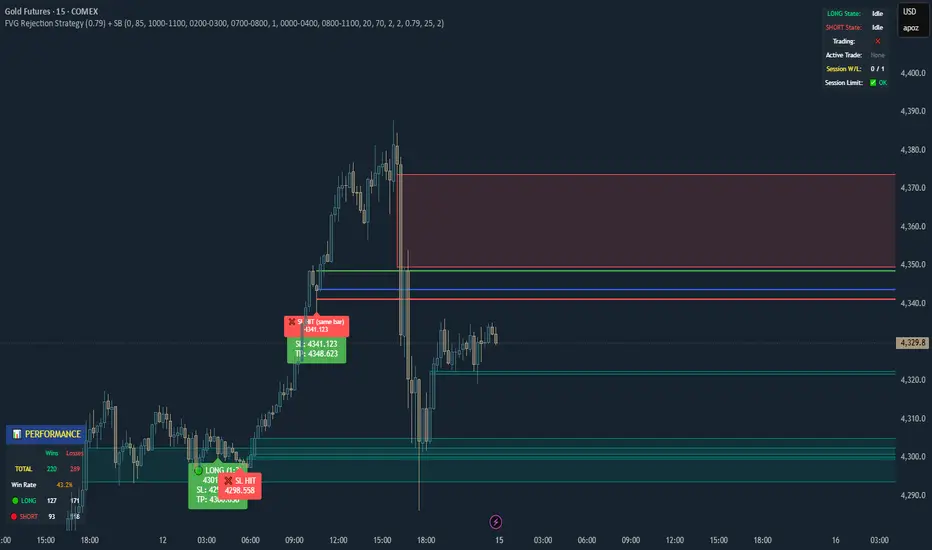
Relative Volume Bollinger Band %
The Relative Volume Bollinger Band % indicator is a powerful tool designed for traders seeking insights into volume, Bollinger band and relative strength dynamics. This indicator assesses the deviation of a security's trading volume relative to the Bollinger band % indicator and the RSI moving average. Together, these shed light on potential zones of interests where market shifts have a high probability of occurring.
Key Features:
Period: Tailor the indicator's sensitivity by adjusting the period of the smooth moving average and/or the period of the Bollinger band.
How it Works:
Moving Average Calculation: The script computes the simple moving average (SMA) of the relative strength over a defined period. When the higher SMA (orange line) is in the top grey zone, the security is in a zone where it has a high probability of becoming bullish. When the higher SMA is in the lower grey zone, the security is in a zone where it has a high probability of becoming bearish.
-Bollinger Band %: The script also computes the BB% which is primarily used to confirm overbought and oversold areas. When overbought, it turns white and remains white until the overbuying pressure is released indicating that the security is about to become bearish. The script indicates a bearish reversal when the BB% and RVOL bars are both red or when there are no more yellow RVOL bars, if present. When the BB% is<0 and rising, it will also appear white with yellow RVOL bars above. This is a good indication that bulls are beginning to enter buying positions. Confirmation here is indicated when the yellow RVOL bars change to green.
Relative Volume: The indicator then also normalizes the difference volume to indicate areas of high and low volatility. This shows where higher than normal volumes are being traded and can be used as a good indication of when to enter or exit a trade when the above criterions are met.
Visual Representation: The result is visually represented on the chart using columns. Bright green columns signify bullish relative volume values that are much greater than normal. Green columns signify bullish relative volume values that are significant. Red columns represent bearish values that are significant. Blue columns on the BB% indicator represent significant bullish buying in overbought areas. Red columns on the BB% indicator that are < 0 represent a bearish trend that is in an oversold area. This is there to prevent early entry into the market.
Enhancements:
Areas of Interest: Optionally, Areas of interest are represented by red, yellow and green circles on the higher SMA line, aiding in the identification of significant deviations.

Smart WhaleOverview The Smart Whale Breakout System is a pure momentum strategy designed for Swing Traders who want to capture high-probability breakouts while managing risk with a mechanical trailing stop.
Unlike indicators that try to guess "bottoms," this system follows the "Smart Money" approach: buying strength when institutional volume enters, and riding the trend until the momentum breaks.
How it Works
1. The Entry (The Hunter) The system identifies a valid BREAKOUT signal only when four specific conditions align:
Trend Filter: Price must be above the 150 SMA. We only trade with the long-term trend.
Momentum: RSI > 50. Ensuring bulls are in control.
Volume Spike (Whale Activity): Current volume must be significantly higher than the average (Default: 1.5x). This filters out weak retail moves.
Price Action: A bullish candle closing higher than it opened.
2. The Exit (The Manager) Once in a trade, the system activates a dynamic Trailing Stop line. You never have to guess when to sell. You can choose between two exit logic modes in the settings:
ATR Trailing (Default): Adapts to volatility. The stop moves up based on a multiple of the Average True Range (ATR). Great for volatile stocks (e.g., TSLA, NVDA).
Percent Trailing: A fixed percentage drop from the highest high. (e.g., "Sell if price drops 10% from peak").
3. The Context (Optional Filter)
Squeeze Filter: Includes a built-in Bollinger/Keltner squeeze detection. If enabled in settings, the system will only signal a buy if the price recently broke out of a consolidation (squeeze). Default is OFF to catch all momentum moves.
Key Features
NO Repainting: Signals are confirmed at candle close.
Visual Risk Management: A Red Trailing Stop line clearly shows where your invalidation point is.
Fully Customizable: Adjust the Volume multiplier, ATR sensitivity, or Percentage drop to fit your asset class (Crypto/Stocks/Forex).
Clean Visuals: Only colors the Breakout and Sell candles to keep your chart clean.
Settings Guide
Trend SMA Length: Define the long-term trend baseline (Default: 150).
Volume Spike (xAvg): How much volume is needed to trigger a buy? (1.5 = 150% of average).
Exit Method: Choose between "ATR Trailing" or "Percent Trailing".
ATR Multiplier: Tighter stop (2.0) vs Looser stop (3.0).
Require Squeeze?: Check this to filter for breakouts that only happen after a consolidation period.
Disclaimer This tool is for educational purposes only. Always use proper risk management.

NeoChartLabs POCOne of our Favorite Indicators - the High Time Frame Point of Control with a Volume Profile.
Shout out to p2pasta for the original script, we updated to v6.
Currently included: Monthly, 3 months and 6 months.
/* DEFINITION */
Point Of Control (= POC) is a price level at which the heaviest volumes were traded.
Value Area High/Low (=VAH/VAL) is a range of prices where the majority of trading volume took place. Naturally, Value Area High being the top price level and Value Area Low being the lowest. POC always is between the two.
/* HOW TO TRADE WITH THIS INDICATOR */
The basis for POC is determining bias on whichever timeframe you choose.
1. Identify a POC on the timeframe of your choosing.
/* If you choose a "low" timeframe (monthly here) then make sure to look at the higher timeframes to see how it is playing against a higher timeframe POC.
2. When the price is moving away from the POC (either to the upside or downside) this will confirm or invalidate the trade.
3. You can now enter the trade on bias or wait for a retest of the same POC.

WOLFGATEWOLFGATE is a clean, session-aware market structure and regime framework designed to help traders contextualize price action using widely accepted institutional references. The indicator focuses on structure, momentum alignment, and mean interaction, without generating trade signals or predictions.
This script is built for clarity and decision support. It provides a consistent way to evaluate market conditions across different environments while remaining flexible to individual trading styles.
What This Indicator Displays
Momentum & Structure Averages
9 EMA — Short-term momentum driver
21 EMA — Structural control and trend confirmation
200 SMA — Primary regime boundary
400 SMA (optional) — Deep regime / macro bias reference
These averages are intended to help assess directional alignment, trend strength, and structural consistency.
Session VWAP (Institutional Mean)
Session-based VWAP with a clean daily reset
Default session: 09:30–16:00 ET
Uses HLC3 as the VWAP source for balanced price input
Rendered in a high-contrast institutional blue for visibility
VWAP can be used to evaluate mean interaction, acceptance, or rejection during the active session.
How to Use WOLFGATE
This framework is designed for context, not signals.
Traders may use WOLFGATE to:
Identify bullish or bearish market regimes
Evaluate momentum alignment across multiple time horizons
Observe price behavior relative to VWAP
Maintain directional bias during trending conditions
Avoid low-quality conditions when structure is misaligned
The indicator does not generate buy or sell signals and does not include alerts or automated execution logic.
Important Notes
Volume must be added separately using TradingView’s built-in Volume indicator
(Volume cannot be embedded directly into this script due to platform limitations.)
This script is intended for educational and analytical purposes only
No financial advice is provided
Users are responsible for their own risk management and trade decisions

Alertes Trading Manuel//@version=6
indicator("Signal simple +0.5% LONG", overlay = true)
// --- Paramètres ---
tpPctInput = input.float(0.5, "TP (%)", step = 0.1) // objectif pour toi : 0.5%
slPctInput = input.float(0.3, "SL (%)", step = 0.1) // SL indicatif : 0.3%
tpPct = tpPctInput / 100.0
slPct = slPctInput / 100.0
emaLenFast = input.int(50, "EMA rapide (intraday)", minval = 1)
emaLenSlow = input.int(200, "EMA lente (intraday)", minval = 1)
volLen = input.int(20, "Période moyenne Volume", minval = 1)
// --- Tendance daily : MA200 jours ---
ma200D = request.security(syminfo.tickerid, "D", ta.sma(close, 200))
above200D = close > ma200D
// --- Tendance intraday ---
emaFast = ta.ema(close, emaLenFast)
emaSlow = ta.ema(close, emaLenSlow)
upTrendIntraday = close > emaFast and emaFast > emaSlow
// --- MACD & RSI ---
= ta.macd(close, 12, 26, 9)
rsi = ta.rsi(close, 14)
macdOK = macdLine > macdSignal
rsiOK = rsi > 49 and rsi < 75
// --- Volume ---
volMa = ta.sma(volume, volLen)
volOK = volume > volume and volume > volMa
// --- Signal LONG simple ---
longSignal = above200D and upTrendIntraday and macdOK and rsiOK and volOK
// --- Affichage du signal ---
plotshape(
longSignal,
title = "Signal LONG",
location = location.belowbar,
style = shape.triangleup,
color = color.lime,
size = size.small,
text = "LONG"
)
// --- Lignes TP / SL indicatives basées sur le dernier signal ---
var float tpLine = na
var float slLine = na
if longSignal
tpLine := close * (1 + tpPct)
slLine := close * (1 - slPct)
// Les lignes restent jusqu'au prochain signal
plot(tpLine, "TP indicatif", color = color.new(color.green, 50), style = plot.style_linebr)
plot(slLine, "SL indicatif", color = color.new(color.red, 50), style = plot.style_linebr)
// --- Affichage des moyennes ---
plot(emaFast, "EMA rapide", color = color.new(color.blue, 40))
plot(emaSlow, "EMA lente", color = color.new(color.orange, 40))
plot(ma200D, "MA200 jours (daily)", color = color.new(color.fuchsia, 0), linewidth = 2)

ChartSignals.AIChartSignals.AI is an overlay indicator designed to simplify chart reading by highlighting potential trade opportunities and providing optional visual context tools.
WHAT YOU’LL SEE
• Buy/Sell signals displayed directly on the chart
• Optional trade level guides (Entry / Take Profit / Stop Loss) to help structure a plan
• Optional trend and zone overlays to help interpret market conditions
• Optional key levels and breakout markers for additional context
• Dynamic candle coloring to help visualize momentum vs. quieter conditions
HOW TO USE (SIMPLE)
• Add ChartSignals.AI to your chart
• Choose a Signal Mode (controls how frequently signals appear)
• Enable/disable the optional overlays you want
• Use signals as chart assistance and confirm with your own analysis and risk management
ALERTS
This script includes alert conditions for:
• Buy, Sell, general signal notifications, and key level break events (when enabled).
DISCLAIMER
For educational and charting purposes only. Not financial advice. Trading involves risk and you are responsible for your own decisions.