volume rsi strategy by pro trader123this strategy includes volume and rsi and plots a buy signal when rsi is below 30 with high average volume and takes profit when the rsi 14 ema crosses rsi
Volume

24H Volume Strategy [Capital Coders]The 24H Volume Strategy measures the 24 Hour Volume of the current Asset. When the Volume Spikes (ATR) the strategy assumes the trend will either continue or reverse and then enter the market on the high volume move to capture the highest volatility of the day. This strategy has options to trade either with the trend, with the reversal, or both.
This strategy also features the new Capital Coders - Custom Strategy Template that features new State of the Art Tools Including:
Robust Time Filter
Built in Money Management
Dynamic Multi-tiered Take Profit
Automation for ANY Platform (Using Webhooks)

Coral Trend Pullback Strategy (TradeIQ)Description:
Strategy is taken from the TradeIQ YouTube video called "I Finally Found 80% Win Rate Trading Strategy For Crypto".
Check out the full video for further details/clarification on strategy entry/exit conditions.
The default settings are exactly as TradeIQ described in his video.
However I found some better results by some tweaking settings, increasing R:R ratio and by turning off confirmation indicators.
This would suggest that perhaps the current confirmation indicators are not the best options. I'm happy to try add some other optional confirmation indicators if they look to be more effective.
Recommended timeframe: 1H
Strategy incorporates the following features:
Risk management:
Configurable X% loss per stop loss
Configurable R:R ratio
Trade entry:
Based on strategy conditions below
Trade exit:
Based on strategy conditions below
Backtesting:
Configurable backtesting range by date
Trade drawings:
Each entry condition indicator can be turned on and off
TP/SL boxes drawn for all trades. Can be turned on and off
Trade exit information labels. Can be turned on and off
NOTE: Trade drawings will only be applicable when using overlay strategies
Alerting:
Alerts on LONG and SHORT trade entries
Debugging:
Includes section with useful debugging techniques
Strategy conditions
Trade entry:
LONG
C1: Coral Trend is bullish
C2: At least 1 candle where low is above Coral Trend since last cross above Coral Trend
C3: Pullback happens and price closes below Coral Trend
C4: Coral Trend colour remains bullish for duration of pullback
C5: After valid pullback, price then closes above Coral Trend
C6: Optional confirmation indicators (choose either C6.1 or C6.2 or NONE):
C6.1: ADX and DI (Single indicator)
C6.1.1: Green line is above red line
C6.1.2: Blue line > 20
C6.1.3: Blue trending up over last 1 candle
C6.2: Absolute Strengeh Histogram + HawkEye Volume Indicator (Two indicators combined)
C6.2.1: Absolute Strengeh Histogram colour is blue
C6.2.2: HawkEye Volume Indicator colour is green
SHORT
C1: Coral Trend is bearish
C2: At least 1 candle where high is below Coral Trend since last cross below Coral Trend
C3: Pullback happens and price closes above Coral Trend
C4: Coral Trend colour remains bearish for duration of pullback
C5: After valid pullback, price then closes below Coral Trend
C6: Optional confirmation indicators (choose either C6.1 or C6.2 or NONE):
C6.1: ADX and DI (Single indicator)
C6.1.1: Red line is above green line
C6.1.2: Blue line > 20
C6.1.3: Blue trending up over last 1 candle
C6.2: Absolute Strengeh Histogram + HawkEye Volume Indicator (Two indicators combined)
C6.2.1: Absolute Strengeh Histogram colour is red
C6.2.2: HawkEye Volume Indicator colour is red
NOTE: All the optional confirmation indicators cannot be overlayed with Coral Trend so feel free to add each separately to the chart for visual purposes
Trade exit:
Stop Loss: Calculated by recent swing low over previous X candles (configurable with "Local High/Low Lookback")
Take Profit: Calculated from R:R multiplier * Stop Loss size
Credits
Strategy origin: TradeIQ's YouTube video called "I Finally Found 80% Win Rate Trading Strategy For Crypto"
It combines the following indicators for trade entry conditions:
Coral Trend Indicator by @LazyBear (Main indicator)
Absolute Strength Histogram | jh by @jiehonglim (Optional confirmation indicator)
Indicator: HawkEye Volume Indicator by @LazyBear (Optional confirmation indicator)
ADX and DI by @BeikabuOyaji (Optional confirmation indicator)

Standardized Chaikin OscillatorThis strategy is mainly designed based on Chaikin Oscillator.
The problems with the Chaikin Oscillator is that it's value varies greatly depending on the symbol.
Even for the same symbol, it will vary greatly depending on the volume changed.
To solve the problem, this strategy keeps the values of the indicators consistent in a standardized way, so that entry and exit signals can be generated.
Since this strategy refers to the trading volume, it is more suitable for exchanges with large trading volume.
The default parameters are recommended to use BTCUSDT on Binance in 1hour timeframe, but you also can try the suitable parameters on your own symbol and timeframe.
Enjoy it!

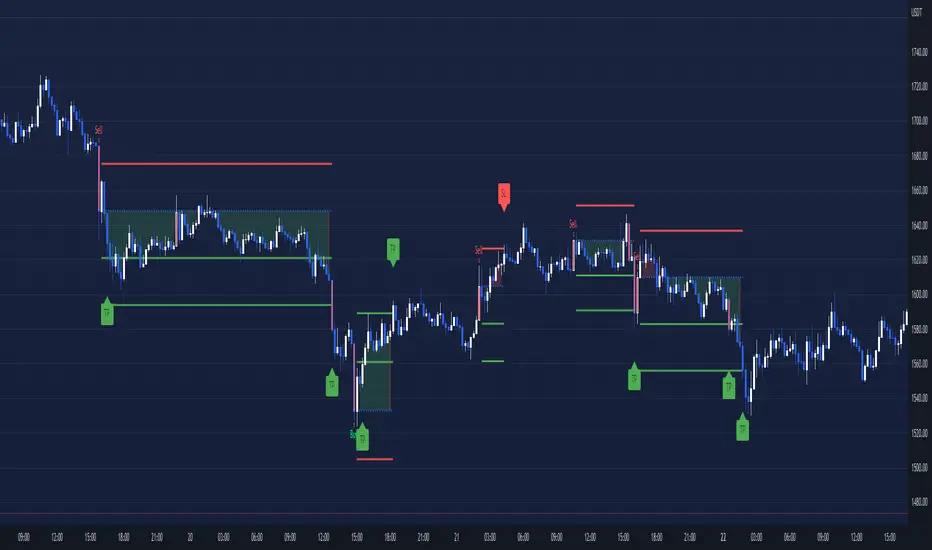
Candles - The WhaleThe strategy is based on candle patterns, with confluence indicators. Note some of the candles are rare, they can be found only a specific timeframe, or within specific stocks.
The added patterns are as follows:
- Bullish Engulfing
It is formed by two candles, the second candlestick engulfing the first candlestick. The first candle is a bearish candle that indicates the continuation of the downtrend.
The second candlestick is a long bullish candle that completely engulfs the first candle and shows that the bulls are back in the market.
- Bullish Harami
It consists of two candlestick charts, the first candlestick being a tall bearish candle, and the second, being a small bullish candle which should be in the range of the first candlestick.
The first bearish candle shows the continuation of the bearish trend and the second candle shows that the bulls are back in the market.
- Piercing Line
Two candles from it, the first candle being a bearish candle which indicates the continuation of the downtrend.
The second candle is a bullish candle that opens the gap down but closes more than 50% of the real body of the previous candle, which shows that the bulls are back in the market and a bullish reversal is going to take place.
- Bullish Belt
A Bullish Belt Hold, known as “yorikiri” in Japanese, is a single Japanese candlestick pattern that suggests a possible reversal of the current downtrend.
- Bullish Kicker
A bullish kicker is a two candlestick pattern that’s usually formed after a significant downtrend, but could also appear after an uptrend.
- Abandoned Baby
The abandoned baby candlestick pattern is a three-bar reversal pattern. It is similar to the morning and evening star formations and is a very reliable reversal signal when it occurs after a sharp rise or drop.
- Homing Pigeon
The bullish homing pigeon is a two-candle bullish reversal pattern that occurs at the end of a bearish trend. Both candles are negative, but the second candle is confined within the range of the previous candle.
- Breakaway
Breakaway patterns are multi-candle formations found on Japanese candlestick charts that suggest a market reversal may be in the offing. An actual breakaway is a five candlestick formation that occurs in either an upward or downward trend.
- Concealing Baby Swallow
The Concealing Baby Swallow candlestick pattern is a four-candlestick pattern that can signal a bullish reversal price movement or a bearish continuation move, depending on where it occurs in the overall market structure. However, the pattern is quite rare, and you may not encounter it in your trading.
- Doji Dragonfly
A dragonfly doji can be an indicator of a reversal in price. When the price of a security has shown a downward trend, it might signal an upcoming price increase.
- Doji Gravestone
The Gravestone Doji forms when the price closes at relatively the same level where it opened, providing that the open coincides with the low or at least the two are very close
- Doji Star
Consists of a long bullish candle, followed by a Doji that gaps up, then a third bearish candle that gaps down and closes well within the body of the first candle. An Evening Doji Star is a three-candle bearish reversal pattern similar to the Evening Star.
- Kicker
A kicker pattern is a two-bar candlestick pattern that predicts a change in the direction of an asset's price trend. This pattern is characterized by a sharp reversal in price over the span of two candlesticks. Traders use it to determine which group of market participants is in control of the direction.
- Ladder Bottom
Is a five-candle bullish reversal pattern that occurs at the end of a bullish trend. The four first candles are bearish and followed by a positive candle that starts with a positive gap.
- MatHold
A bullish pattern begins with a large bullish candle followed by a gap higher and three smaller candles which move lower.
- Matching Low
A matching low is a bullish two-candle reversal pattern that forms in an ongoing downtrend. As to its appearance, a matching low consists of two candlesticks that are negative, but the close at or around the same price.
- Meeting Lines
Bullish meeting lines are a two-candle bullish reversal pattern that occurs in a downtrend and signals a reversal of the trend. The first candle of the bullish meeting lines is bearish, and followed by a positive candle that closes very near the close of the previous candle.
- Morning Doji Star
It is made of 3 candlesticks, the first being a bearish candle, the second, a Doji, and the third being a bullish candle.
The first candle shows the continuation of the downtrend. The second candle being a doji indicates indecision in the market. The third bullish candle shows that the bulls are back in the market and a reversal will take place. The second candle should be completely out of the real bodies of the first and third candles.
- Rising Three Method1
Rising three methods is a bullish continuation pattern that appears in an ongoing uptrend. The Rising three methods pattern consists of five candles. where the first and last candles are long and bullish, with three small bearish candles in between.
- Rising Three Method2
It is the same as "Rising Three Method1" but with a different calculation
- Upside Tasuki Gap1
Is a bullish continuation candlestick pattern that forms in an ongoing uptrend. It consists of three candles, where the two first are bullish with a positive gap in-between, and followed by a negative candle that closes in the gap formed between the first two candles.
- Upside Tasuki Gap2
It is the same as "Upside Tasuki Gap1" but with a different calculation
- Three Line Strike1
Is a four-candle bullish continuation candlestick pattern. It forms a bullish trend and is believed to signal the continuation of the bullish trend.
- Three Line Strike2
It is the same as "Three Line Strike2" but with a different calculation
The confluence indicators:
Movement Averages: multi options checks, you can select what to check to open a position, and the description of each open is in the strategy.
Volume Oscillator: positive signal if the volume is above zero.
EMA: positive signal if the candle source is above EMA.
VWAP: positive signal if the candle source is above VWAP.
BTC Trend: it is an equation to track the BTC price movement
The profit is based on TSL, while the stop loss is based on ATR, or lowest candle.
The recommended time frame is 4 hours.

VWAP Push StrategyThis strategy is unfortunately not finished yet.
A pretty simple strategy. If price broke through VWAP and had three consecutive candles following the breakthroughs trend, the high of the third candle will be drawn. If this happened after a crossover of the vwap and price breaks through the high of the third candle, strategy will go long. Short will be the same after crossing under the vwap. A long or short will be closed after crossing the vwap in the opposite direction, so the vwap is kind of a trailing stop.
Unfortunately, I could not manage to stop the script from entering multiple times into one drawn high or low. Of course, if a high was crossed the script should wait for a new formed high before entering a new long. If someone would find a solution to this, it would be great, because I think it is a nice strategy .
Should work great scalping 5min charts (when scripting, I used the SPX for reference).

Capital Coders - Volume/Volatility StrategyThis strategy utilizes a combination of Volume and volatility to identify highly volatile candles, in periods of high and low volume trading. This allows the strategy to adjust to the market conditions. The Average True Range will highlight High Volatility breakouts, while the 24Hr Volume will determine weather the Trend will continue, or reverse.
Risk Management is an important part of any trading strategy. With this Strategy, you can leave your Risk calculator at home. Simply enter the maximum Risk per trade (% of your account) and let the Strategy determine your lot/position size.
Dynamically exit the market based on a single or multiple take profit levels. With simple configuration, this makes it easier than ever to dynamically exit the market.
Strategy includes the following features
Built in Risk Management
Variable Take Profit Levels
Built in Strategy Alerts
Signal Customization
scalping with market facilitationThis strategy is for scalping low timeframes for 10 pips. I have yet to see a strategy with this unique combo of indicators.
First we have volume indicator market facilitation, where we are looking for volume and mfi to be up, then we want the adx 5 to be above level 30 and above its ema period 3, then if these conditions are good we take shorts when ema 8 is below ema 100 and longs when ema8 is above ema 100 with parabolic sar in its propet place, also to verify trend we have obv over or under its ema of 55 and macd line over its signal line.
I have heikenashi bars on with the regular priceline showing so j see actual price levels, when i get a buy signal i set a buystop above the high of that bar and have a stoploss of 7.5 pips and a take profit of 10 pips, reverse for sells, i have to use metatrader to trade so i use this as my signals to trade.
Note this is not advice trade at your own risk no guarantees in anything in life, but i wanted to share this for it is helping me with my trades to be more strict and semi mechanical. I use it for forex time frames 1 3 5 15 mjn

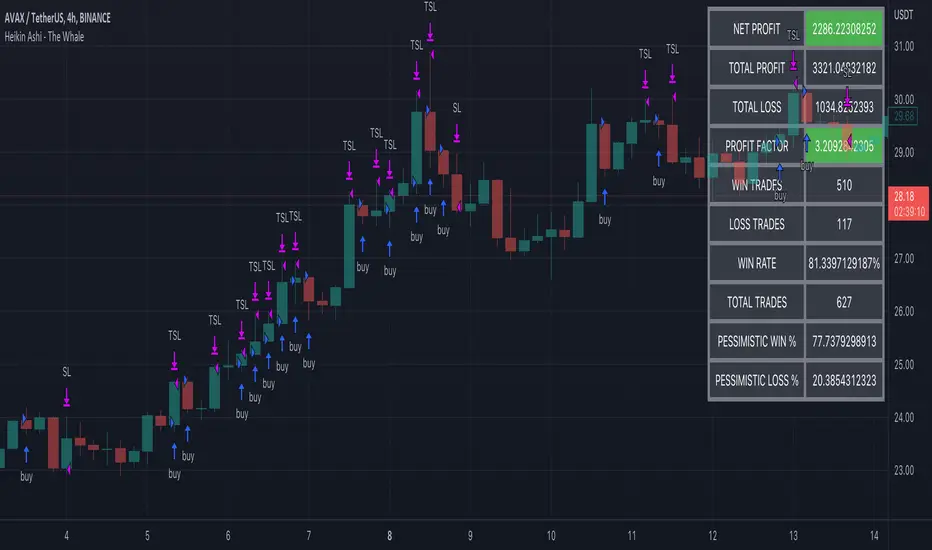
Heikin Ashi - The WhaleThe strategy is based on Heikin Ashi calculation, you do not need to switch the candle to HA.
The HA is used as a base entry, if a candle or two candles are bullish, then is valid to open a position, you can select the validation, one or two candles.
Also, the strategy mainly uses volume indicators as a confluence, you can select VWAP , VWMA , and Volume Oscillator, in addition to ADX which has two ways to validate the entry.
Base entry: One or two bullish HA candles (candles without a lower wick)
Confluence Indicators:
ADX: Will give a positive signal only if ADX is above the threshold, or if +DI is above -DI, or both.
VWAP: will give a positive signal if HA close is above VWAP.
VWMA: composite of 3 MA (20, 25, 50). There are multiple options to set it as confluence, the first option is to check if the short is bigger than the long and long is bigger than the base. The other options are to check the close status, which is bigger than which MA. You can find the description of each option in the strategy box
The sell is based on trailing stop loss (TSL), while the stop loss is based lowest X candle, the strategy will look back to the lowest number of the HA candles and set it as stop loss.
Statistical Correlation Algorithm - The Quant ScienceStatistical Correlation Algorithm - The Quant Science™ is a quantitative trading algorithm.
ALGORITHM DESCRIPTION
This algorithm analyses the correlation ratios between two assets. The main asset (on the chart), and the secondary asset (set by the user). Then apply the long or short trading strategy.
The algorithm divides trading work into three parts:
1. Correlation analysis
2. Long or short entry
3. Closing trades
Inside the strategy: the algorithm analyses the percentage change yields from a previous session, of the secondary asset. If the variation meets the set condition then it will open a long or short position, on the primary asset. The open position is closed after 'x' number of sessions. Stop loss and take profit can be added to the trade exit parameters.
Logic: analyses the correlation between two assets and looks for a statistical advantage within the correlation.
INDICATOR DESCRIPTION
The algorithm includes a quantitative indicator. This indicator is used for correlation analysis and offers a quick reading of the quantitative data. The blue area shows the correlation ratio values. The yellow histograms show the percentage change in the yields of the main asset. Purple histograms show the percentage change in secondary asset yields.
GENERAL FEATURES
Multi time-frame: the user can set any time-frame for the secondary asset.
Multi asset: the user analyses the conditions on a second asset.
Multi-strategy: the algorithm can apply either the long strategy or the short strategy.
Built-in alerts: the algorithm contains alerts that can be customized from the user interface.
Integrated indicator: the quantity indicator is included.
Backtesting included: automatic backtesting of the strategy is generated based on the values set.
Auto-trading compliant: functions for auto trading are included.
USER INTERFACE SETTINGS
Through the intuitive user interface, you can manage all the parameters of this algorithm without any programming experience. The user interface is extremely descriptive and contains all the information needed to understand the logic of the algorithm and to configure it correctly.
1. Date range: through this function you can adjust the analysis and working period of the algorithm.
2. Asset: through this function you can adjust the secondary asset and its time-frame. You can enter any type of asset, even indices and economic indicators.
3. Asset details: this function is used to adjust the percentage change to be analyzed on the secondary asset. The analysis and input conditions are also chosen.
4. Active long or short strategy: this function is used to set the type of strategy to be used, long or short.
5. Setting algo trading alert: with this function, users can manage alerts for their web-hook.
6. Exit&Money management: with this function the user can adjust the exit periods of each trade and activate or deactivate any stop losses and take profits.
7. Data Value Analysis: this function is used to adjust the parameters for the quantity indicator.

Strategy - Trend Chaser - PSeTrend Chaser for Philippine Stock Exchange - LONG ONLY
-Elvin Kennedy Latayan 2022

3LS | 3 Line Strike Strategy [Kintsugi Trading]What is the 3LS | 3 Line Strike Strategy?
Incorporating the 3 Line Strike candlestick pattern into our strategy was inspired by Arty at The Moving Average and the amazing traders at TheTrdFloor .
The Three Line Strike is a trend continuation candlestick pattern consisting of four candles. Depending on their heights and collocation, a bullish or a bearish trend continuation can be predicted.
In a symphony of trend analysis, price action, and volume we can find and place high-probability trades with the 3LS Strategy.
How to use it!
----- First, start by choosing a Stop-Loss Strategy, Stop PIP Size, and Risk/Reward Ratio -----
- Stop-Loss Strategy
Fixed PIP Size – This uses the top/bottom of the indicator candle and places a TP based on the chosen Risk:Reward ratio.
ATR Trail (No set Target Profit, only uses ATR Stop)
ATR Trail-Stop (Has set Target Profit, however, stop is based on ATR inputs)
**If you choose an ATR Stop-Loss Strategy - input the desired ATR period and Multiple you would like the stop to be calculated at**
**ATR Stop-Loss Strategies have a unique alert setup for Auto-Trading. See Auto-Trading Section**
- Risk/Reward Ratio = If you have a .5 risk/reward, it means you are risking $100 to make $50.
- Additional Stop PIP Size = Number of PIPs over the default stop location of the top or bottom of the indicator candle.
----- Next, we set the Session Filter -----
Set the Timezone and Trade Session you desire. If no specific session is desired, simply set the Trade Session to 00:00 - 00:00.
----- Next, we set the Moving Average Cloud Fill -----
Enter the Fast and Slow Moving Average Length used to calculate trend direction:
MA Period Fast
MA Period Slow
These inputs will determine whether the strategy looks for Long or Short positions.
----- Next, we set the VSA – Volume Spread Analysis Settings -----
Check the box to show the indicator at the bottom of the chart if desired.
This is just a different visual output of the VSA | Volume Spread Analysis indicator available for free under the community indicators tab. You can add that indicator to your chart and see the same output in candle format.
In combination with the Moving Average Cloud, the Volume Spread Analysis will help us determine when to take a trade and in what direction.
The strategy is essentially looking for small reversals going against the overall trend and placing a trade once that reversal ends and the price moves back in the direction of the overall trend.
The 3LS Strategy utilizes confirmation between trend, volume, and price action to place high probability trades.
The VSA is completely customizable by:
Moving Average Length
MA-1 Multiplier
MA-2 Multiplier
MA-3 Multiplier
Check out the VSA | Volume Spread Analysis indicator in the community scripts section under the indicators tab to use this awesome resource on other strategies.
----- Next, we have the option to view the automated KT Bull/Bear Signals -----
Check the boxes to show the buy-sell signal on the chart if desired.
----- Next, we set the risk we want to use if Auto Trading the strategy -----
I always suggest using no more than 1-3% of your total account balance per trade. Remember, if you have multiple strategies triggering per day with each using 1%, the total percent at risk will be much larger.
For Example – if you have 10 strategies each risking 1% your total risk is 10% of your account, not 1%! Be mindful to only use 1-3% of your total account balance across all strategies, not just each individual one.
----- Finally, we backtest our ideas -----
After using the 'Strategy Tester' tab on TradingView to thoroughly backtest your predictions you are ready to take it to the next level - Automated Trading!
This was my whole reason for creating the script. If you work a full-time job, live in a time zone that is hard to trade, or just don't have the patience, this will be a game-changer for you as it was for me.
Auto-Trading
When it comes to auto-trading this strategy I have included two options in the script that utilize the alert messages generated by TradingView.
*Note: Please trade on a demo account until you feel comfortable enough to use real money, and then please stick to 1%-2% of your total account value in risk per trade.*
AutoView
PineConnector
**ATR Auto-Trading Alert Setup**
How to create alerts on 3 Line Strike Strategy
For Trailing Stops:
1) Adjust autoview/pineconnector settings
2) Click "add alert"
3) Select "Condition" = Strategy Name
4) Select "Order Fills Only" from the drop-down
3) Remove template message text from "message" box and place the exact text. '{{strategy.order.alert_message}}'
4) Click "create"
For Fixed Pip Stop:
1) Adjust autoview/pineconnector settings
2) Click "add alert"
3) Select "Condition" = Strategy Name
4) Select "alert() function calls only"
5) I like to title my Alert Name the same thing I named it as an Indicator Template to keep track
Good luck with your trading!

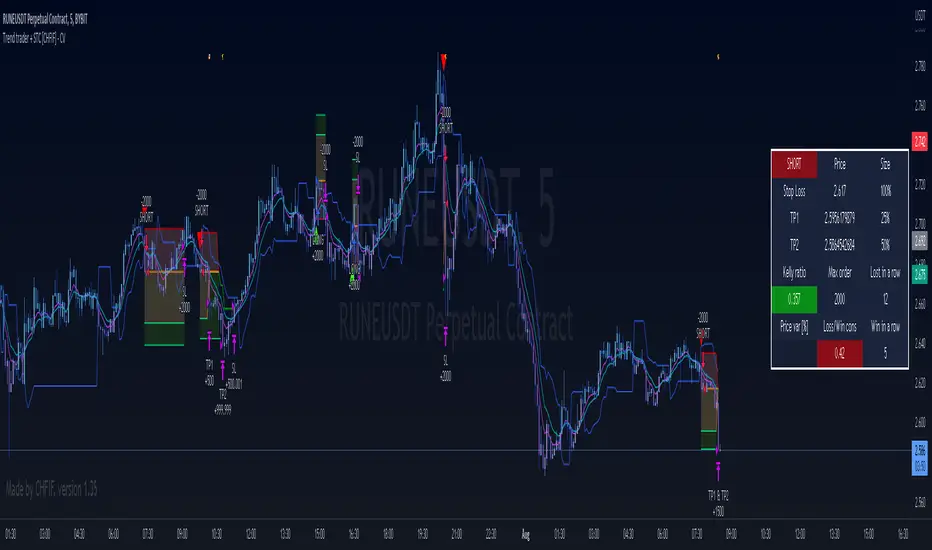
Trend trader + STC [CHFIF] - CV This script is my first strategy script coupling the Trend trader (indicator developed by Andrew Abraham in the Trading the Trend article of TASC September 1998.) and Schaff Trend Cycle . The STC indicator is widely used to identify trends and their directions. It is sometimes used by traders to predict trend reversals as well. Based on the movement of the Schaff Trend Cycle , buy or sell signals are generated, which are then used by traders to initiate either long or short positions.
Around I built a user interface to help you in creating a customized strategy to your need.
My idea behind doing this was to make customizable parameters and back testing easier than manually with a lot of flexibility and options. More possibility we have, more solutions we find right? So I started this script few weeks ago to be my first script (second in reality, but first to be published.)
Strategy it self is made out of 2 simple step:
1→ STC gives a Buy/Sell signal.
2→Price is closing above the TT (Buy) or below (Sell) and the signal is the same as given by the STC .
To complete your strategy in order to reach the best result, I added few options:
→ Money management: Define the type of risk you want to take (entry risk will always risk the same percentage of your portfolio disregarding the size of the SL, Fix amount of money, fix amount of the capital (portfolio). NOTE: Margin is not coded yet, target is to show liquidation price. Please keep an eye on the releases to know when it is released.
→ Stop loss and Take profit management: Define the type of target you want to use (ATR, fixed percentage, pivots points) and even customise different take profit level or activate the trailing. Each type of target is customizable via the menu
→ Moving average: You can also complete the strategy using different moving average. To draw it tick the box on the left, to use it in the calculation of the result, tick the box "Price>MA" in front of the needed EMA . You can select different type of MA ( SMA , EMA , DEMA , TEMA , RMA, HMA , WMA , VWAP , VWMA , etc...)
→ RSI: 4 possible approach to use the RSI to complement the strategy:
• OB/OS => short position will be taken only if RSI goes under the lower limit. Long if the RSI goes above the limit. Ticking confirmation will wait to cross back the limit to validate the condition
• Rev OB/OS => Short will be taken if RSI is below lower limit and stays below. Long will be taken if RSI is above upper limit and stays above.
• MA dominance => RSI has to be above MA for long, below for short. Confirmation box ticked requires 2 bars with the RSI on a side to validate signal.
• MA Dominance + limit => It is a combination of the requirement of the provious option and also Rev. OB/OS
→ Volume confirmation => This will consider the volume MA for entry confirmation. The volume will have to be above the MA define by the value entered in the field.
→ Waddah Attar explosion indicator can also be used as a filter for entries in this way:
• Explosion line > dead zone to validate entries
• Trend > dead zone to validate entry
• Both > dead zone is a compound of both rules above to get entry confirmation
→ ADX can also be used as a filter. I added 2 Threshold in order to have a minimum level of acceptance for valid entry but also a maximum level.
When your strategy is setup, you can setup alerts and I would recommend to setup the date range before doing the alerts. Why? Simply because the script do not cover pyramiding and will give a signal only if a trade is not ongoing.
In setting up the sessions at which you would want to trade, no signal within those range can be missed. You can setup 2 sessions, the days and also the global range of backtesting.
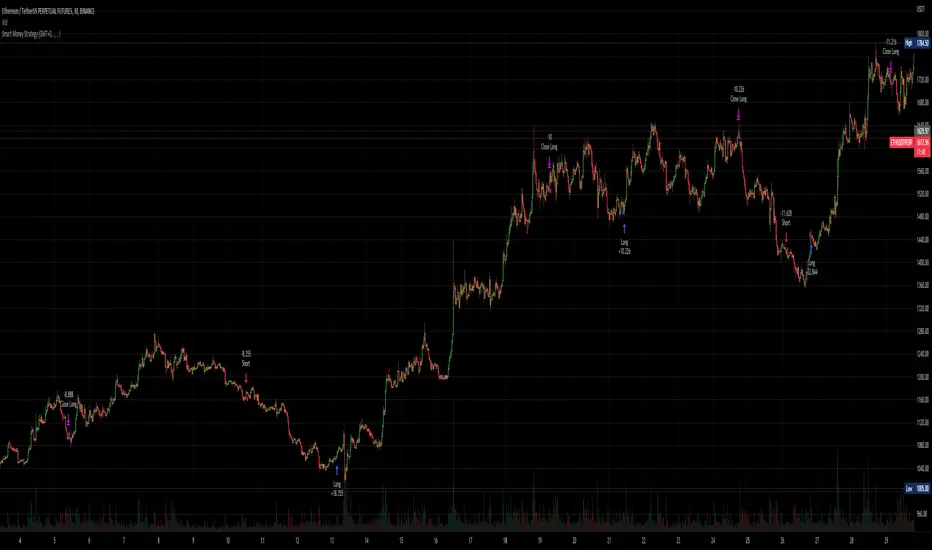
Smart Money - Oscillator and Volume StrategyOverview
This is a no-repaint strategy that is highly optimized for BINANCE:ETHUSDTPERP 30m, normal candles. It is a long/short strategy that is based on CMF, ADX/DMI, Keltner Channels, and other oscillators to identify smart money.
The overall idea of the strategy is to effectively capture the beginnings and ends of trends in price action, and go long/short accordingly. To achieve this, potential entry points are identified with various oscillators and these are then filtered using a variety of moving averages and strength/momentum indicators.
Short and sell inflections are found when ADX, DMI, and/or CMF oscillate below a specified threshold, and Keltner Channels are also used to indicate potential trades.
The indicator will continue to be updated and optimized for current and future market conditions.
If purchased, access to the indicator will be available within 24 hours.
Backtest Results
Parameters:
- 2021-01-01 to present (19 months)
- 100% equity order size
- 0.04% commission fees
- No leverage
17,089% net profit through 296 trades with 60.47% of trades being profitable.
Profit factor of 2.862, Sharpe Ratio of 1.158
Parameters:
- 2021-01-01 to present (19 months)
- $1,000 initial capital
- $1,000 order size
- 0.04% commission fees
- No leverage
584% net profit through 296 trades with 60.47% of trades being profitable.
Parameters:
- 2021-01-01 to present (19 months)
- 500% equity order size
- 0.04% commission fees
- 5x leverage
8,587,557% net profit through 299 trades with 59.87% of trades being profitable.
Miyagi (10 in 1) + DCA StrategyMiyagi: The attempt at mastering something for the best results.
Miyagi indicators combine multiple trigger conditions and place them in one toolbox for traders to easily use, produce alerts, backtest, reduce risk and increase profitability.
Miyagi (10 in 1) + DCA Strategy built for the Miyagi (10 in 1) + Alerts found here:
The DCA Strategy was designed to help visualize, backtest and improve users' DCA strategies and overall profitability.
Users can backtest different trading timeframes using the start and end date inputs.
Users can backtest different take profit and stoploss percents, both long and short.
Users can choose whether or not to use DCA on the backtester via a selectable input.
Input the DCA as you would normally using the Wick Hunter bot.
Happy trading!

Miyagi (4 in 1) + DCA StrategyMiyagi: The attempt at mastering something for the best results.
Miyagi indicators combine multiple trigger conditions and place them in one toolbox for traders to easily use, produce alerts, backtest, reduce risk and increase profitability.
Miyagi (4 in 1) + DCA Strategy built for the Miyagi (4 in 1) + Alerts found here:
The DCA Strategy was designed to help visualize, backtest and improve users' DCA strategies and overall profitability.
Users can backtest different trading timeframes using the start and end date inputs.
Users can backtest different take profit and stoploss percents, both long and short.
Users can choose whether or not to use DCA on the backtester via a selectable input.
Input the DCA as you would normally using the Wick Hunter bot.
Happy trading!

[BUBBLENUKE] BOB The Reversal Trader=============================================================: BOB The Reversal Trader :=============================================================
COMPONENTS:
- VWAP Anchored at Friday CME close
- Bitcoin CME close
- Volume bars
SETTINGS:
- Asset: BTCUSDTPERP
- Time frame: 30M
- Hard TP %: 1.5
- Hard SL %: 40
- Trading Session Start (UTC): 4
- Trading Session End (UTC): 17
DESCRIPTION:
BOB is a mean-reversion trading system focused in BTCUSDT asset in the 30M time frame. The system is divided into 2 types of entries:
WEEKENDS:
BOB will trigger his entry when the price of Bitcoin is at one of the two deviations from the VWAP anchored at Friday CME close and BOB will take your profits when the price returns to the VWAP. When BOB hits Sunday and the CME reopens, BOB will close all your open positions.
INTRA-WEEK:
BOB will trigger its entry when the price of Bitcoin is at one of the two deviations from the VWAP anchored at the Friday CME close or when a volume candle indicates a reversal. BOB will take your profits when the price returns to the VWAP or when the HARD TP % is reached (1.5% by default). When BOB hits Friday and the CME closes, BOB will close all your open positions.

Crypto_Troll_Turtle_StrategyTurtle Strategy for high marketcap cryptocurrencies
I'm glad to launch my strategy which is based on
moving averages / bollinger bands / RSI and volume
It's basically made for scalping with an interesting return over the last two years and a perspectively low drawdown
if you're interested in the strategy and you want to use it for futures trading you can contact me for a money & risk management rules that you can use and prevent you from a huge loss !! it's for free don't worry xD you can find my contact in the author's instructions' label
The optimal timeframe to use is 1H
I'll be trying to launch telegram signals for this strategy as soon as possible for the following pairs: BTCUSDT ETHUSDT BNBUSDT timeframe: 1H
I'm open to all reviews ! thanks !

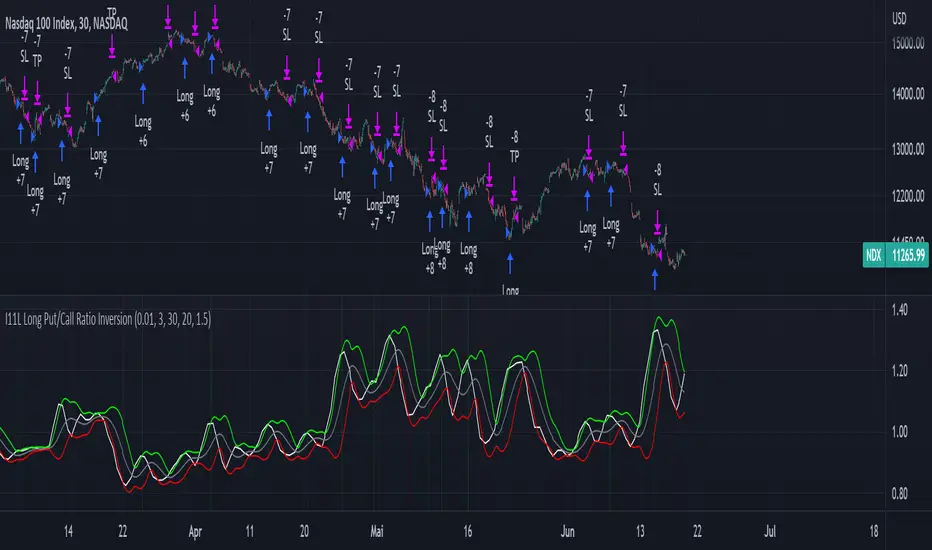
I11L Long Put/Call Ratio InversionThe Strategy uses the Put/Call Options Ratio Inversaion as a Signal and Implements simple Money Management rules.
It is adjusted for the NDX and for the SPX in the 30min Range.
The Oscilation has to be finetuned to reflect the correct Reversal point.
A good indicator of the correct Reversal Point is a solid range of good backtesting results..
Miyagi (VWAP) + DCA BacktestVWAP has been the main condition for entry for our trading community when using the Wick Hunter bot for quite some time now; however using VWAP alone can lead to poor entries and bags.
Miyagi adds filtering conditions which can then be used to improve entries as opposed to simply using VWAP alone.
Miyagi: The attempt at mastering something for the best results.
Miyagi indicators combine multiple trigger conditions and place them in one toolbox for traders to easily use, produce alerts, backtest, reduce risk and increase profitability.
Miyagi (VWAP) + DCA Backtest allows you to backtest your VWAP settings across each pair.
VWAP + Backtest starts with the user selectable take profit and stoploss, both in percent.
Backtesting can be done in any trend direction: Long, Short, or both.
First we start with the VWAP Settings for entry.
The VWAP Settings are based off the original VWAP Indicator found here:
VWAP Timeframe can be adjusted to chart timeframe, or to another timeframe of choice.
VWAP Period is adjustable and should be set to your current period setting.
VWAP Lower Line (Long) is the Percentage Below VWAP = Long Entry.
VWAP Upper Line (Short) is the Percentage Above VWAP = Short Entry.
Once your VWAP Settings are now configured for your current trading settings, you can move onto the DCA and Backtest Settings.
Select DCA to allow and backtest DCA.
Equity %: allows you to select what percent of Equity you will use.
Leverage: Set the leverage you will trade at, from 1-100X.
DCA Start %: This is the percent that your DCA Starts at, in % away from initial entry.
Entry Order Size %: This is the entry order size, in percent of your account, that is used for entry.
DCA Order Size %: This is the DCA order size, in percent of your account, that is used for the first DCA.
DCA Order Size Scale %: This is the DCA size scaling, in %, that is applied to all DCA's after the first.
DCA % from Avg: This is the % away from Average DCA setting.
Step Size Scale %: This is the step size scale setting in percent, that is placed away from your first DCA.
DCA Buy Count: How many DCAs in total that can be used.
Properties Tab includes generic backtest settings including capital amount, base currency, order size, commission, slippage and margin.
Happy Trading!

Customizable Non-Repainting HTF MACD MFI Scalper Bot Strategy v2Customizable Non-Repainting HTF MACD MFI Scalper Bot Strategy v2
This script was originally shared by Wunderbit as a free open source script for the community to work with. This is my second published iteration of this idea.
WHAT THIS SCRIPT DOES:
It is intended for use on an algorithmic bot trading platform but can be used for scalping and manual trading.
This strategy is based on the trend-following momentum indicator . It includes the Money Flow index as an additional point for entry.
This is a new and improved version geared for lower timeframes (15-5 minutes), but can be run on larger ones as well. I am testing it live as my high frequency trader.
HOW IT DOES IT:
It uses a combination of MACD and MFI indicators to create entry signals. Parameters for each indicator have been surfaced for user configurability.
Take profits are now trailing profits, and the stop loss is now fixed. Why? I found that the trailing stop loss with ATR in the previous version yields very good results for back tests but becomes very difficult to deploy live due to transaction fees. As you can see the average trade is a higher profit percentage than the previous version.
HOW IS MY VERSION ORIGINAL:
Now instead of using ATR stop loss, we have a fixed stop loss - counter intuitively to what some may believe this performs better in live trading scenarios since it gives the strategy room to move. I noticed that the ATR trailing stop was stopping out too fast and was eating away balance due to transaction fees.
The take profit on the other hand is now a trailing profit with a customizable deviation. This ensures that you can have a minimum profit you want to take in order to exit.
I have depracated the old ATR trailing stop as it became too confusing to have those as different options. I kept the old version for others that want to experiment with it. The source code still requires some cleanup, but its fully functional.
I added in a way to show RSI values and ATR values with a checkbox so that you can use the new an improved ATR Filter (and grab the right RSI values for the RSI filter). This will help to filter out times of very low volatility where we are unlikely to find a profitable trade. Use the "Show Data" checkbox to see what the values are on the indicator pane, then use those values to gauge what you want to filter out.
Both versions
Delayed Signals : The script has been refactored to use a time frame drop down. The higher time frame can be run on a faster chart (recommended on one minute chart for fastest signal confirmation and relay to algotrading platform.)
Repainting Issues : All indicators have been recoded to use the security function that checks to see if the current calculation is in realtime, if it is, then it uses the previous bar for calculation. If you are still experiencing repainting issues based on intended (or non intended use), please provide a report with screenshot and explanation so I can try to address.
Filtering : I have added to additional filters an ABOVE EMA Filter and a BELOW RSI Filter (both can be turned on and off)
Customizable Long and Close Messages : This allows someone to use the script for algorithmic trading without having to alter code. It also means you can use one indicator for all of your different alterts required for your bots.
HOW TO USE IT:
It is intended to be used in the 5-30 minute time frames, but you might be able to get a good configuration for higher time frames. I welcome feedback from other users on what they have found.
Find a pair with high volatility (example KUCOIN:ETH3LUSDT ) - I have found it works particularly well with 3L and 3S tokens for crypto. although it the limitation is that confrigurations I have found to work typically have low R/R ratio, but very high win rate and profit factor.
Ideally set one minute chart for bots, but you can use other charts for manual trading. The signal will be delayed by one bar but I have found configurations that still test well.
Select a time frame in configuration for your indicator calculations.
Select the strategy config for time frame (resolution). I like to use 5 and 15 minutes for scalping scenarios, but I am interested in hearing back from other community memebers.
Optimize your indicator without filters : customize your settings for MACD and MFI that are profitable with your chart and selected time frame calculation. Try different Take Profits (try about 2-5%) and stop loss (try about 5-8%). See if your back test is profitable and continue to optimize.
Use the Trend, RSI, ATR Filter to further refine your signals for entry. You will get less entries but you can increase your win ratio.
You can use the open and close messages for a platform integration, but I choose to set mine up on the destination platform and let the platform close it. With certain platforms you cannot be sure what your entry point actually was compared to Trading View due to slippage and timing, so I let the platform decide when it is actually profitable.
Limitations: this works rather well for short term, and does some good forward testing but back testing large data sets is a problem when switching from very small time frame to large time frame. For instance, finding a configuration that works on a one minute chart but then changing to a 1 hour chart means you lose some of your intra bar calclulations. There are some new features in pine script which might be able to address, this, but I have not had a chance to work on that issue.

SuperTrend Trapping Candle StrategyHello traders!
How this indicator works?
The main functionality of this indicator is to find entry based upon SuperTrend indicator. This indicator helps us to find trapping candle to enter into the market.
What is a trapping candle?
A trapping candle is a candle that shows strength in opposite direction to SuperTrend. This helps us to enter in a trade before the move start in the current trend's direction. There are two types of trapping candles signals I have added currently:
1. Volume is high than previous candle in the opposite direction.
2. 3 candles of opposite direction with decreasing volume .
How to enter in a trade in uptrend market?
SuperTrend shows a green signal
A green triangle formed below red candle
Enter into the trade when price is above red candle high
SL could be place below red candle or swing low if it is near
How to enter in a trade in downtrend market?
SuperTrend shows a red signal
A red triangle formed above green candle
Enter into the trade when price is below green candle low
SL could be place above green candle high or swing high if it is near
How to avoid to enter in a trade in sideways market?
You can follow price action strategies
Or you can follow some indicator to find sideways market
Indicator settings and how to change?
ATR Length - For SuperTrend, this is default value.
Factor - For SuperTrend, changed to 2 to provide fast signals.
Candle Height - For trapping candle price, default set to 0.003% of the current price.

Customizable Non-Repainting HTF MACD MFI Scalper Bot StrategyThis script was originally shared by Wunderbit as a free open source script for the community to work with.
WHAT THIS SCRIPT DOES:
It is intended for use on an algorithmic bot trading platform but can be used for scalping and manual trading.
This strategy is based on the trend-following momentum indicator . It includes the Money Flow index as an additional point for entry.
HOW IT DOES IT:
It uses a combination of MACD and MFI indicators to create entry signals. Parameters for each indicator have been surfaced for user configurability.
Take profits are fixed, but stop loss uses ATR configuration to minimize losses and close profitably.
HOW IS MY VERSION ORIGINAL:
I started trying to deploy this script myself in my algorithmic trading but ran into some issues which I have tried to address in this version.
Delayed Signals : The script has been refactored to use a time frame drop down. The higher time frame can be run on a faster chart (recommended on one minute chart for fastest signal confirmation and relay to algotrading platform.)
Repainting Issues : All indicators have been recoded to use the security function that checks to see if the current calculation is in realtime, if it is, then it uses the previous bar for calculation. If you are still experiencing repainting issues based on intended (or non intended use), please provide a report with screenshot and explanation so I can try to address.
Filtering : I have added to additional filters an ABOVE EMA Filter and a BELOW RSI Filter (both can be turned on and off)
Customizable Long and Close Messages : This allows someone to use the script for algorithmic trading without having to alter code. It also means you can use one indicator for all of your different alterts required for your bots.
HOW TO USE IT:
It is intended to be used in the 5-30 minute time frames, but you might be able to get a good configuration for higher time frames. I welcome feedback from other users on what they have found.
Find a pair with high volatility (example KUCOIN:ETH3LUSDT ) - I have found it works particularly well with 3L and 3S tokens for crypto. although it the limitation is that confrigurations I have found to work typically have low R/R ratio, but very high win rate and profit factor.
Ideally set one minute chart for bots, but you can use other charts for manual trading. The signal will be delayed by one bar but I have found configurations that still test well.
Select a time frame in configuration for your indicator calculations.
Select the strategy config for time frame. I like to use 5 and 15 minutes for scalping scenarios, but I am interested in hearing back from other community memebers.
Optimize your indicator without filters (trendFilter and RSI Filter)
Use the TrendFilter and RSI Filter to further refine your signals for entry. You will get less entries but you can increase your win ratio.
I will add screenshots and possibly a video provided that it passes community standards.
Limitations: this works rather well for short term, and does some good forward testing but back testing large data sets is a problem when switching from very small time frame to large time frame. For instance, finding a configuration that works on a one minute chart but then changing to a 1 hour chart means you lose some of your intra bar calclulations. There are some new features in pine script which might be able to address, this, but I have not had a chance to work on that issue.
