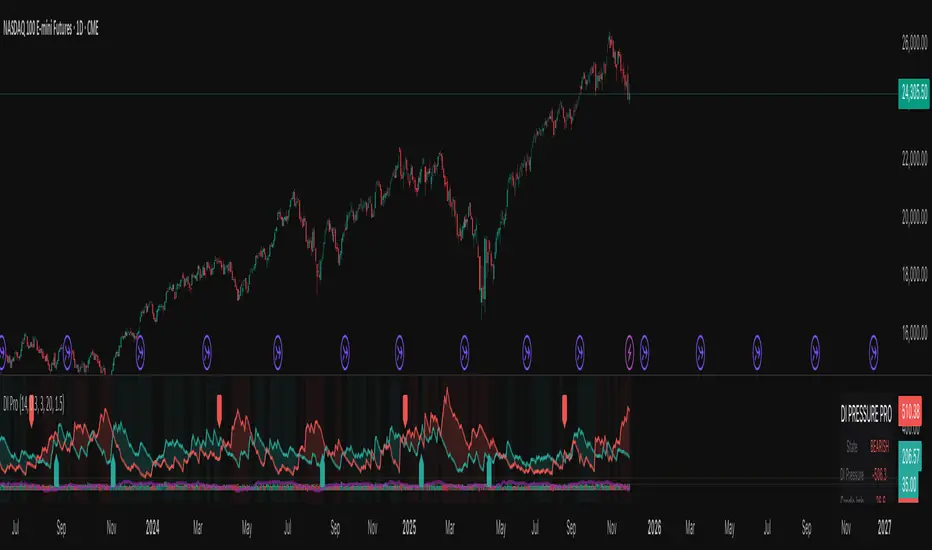
Nexural DI Pressure ImbalanceNexural DI Pressure Imbalance
Overview
This indicator combines traditional Directional Index (DI) analysis with modern order flow concepts to help you identify buying and selling pressure in the market. I built this because I wanted something that goes beyond basic DI calculations and actually shows what's happening inside each candle.
What Makes This Different
Instead of just looking at directional movement, this indicator analyzes:
Candle-by-candle pressure - Where did the price actually close within the candle's range? This tells us who won the battle between buyers and sellers.
Volume-weighted calculations - Low volume moves get less weight, because they're less reliable.
Order flow approximation - Estimates buying versus selling volume based on price action and where the close ended up.
Cumulative delta - Tracks the running total of buy/sell imbalance over your chosen period.
How to Read It
The main display shows two lines:
DI+ (green) - Buying pressure
DI- (red) - Selling pressure
When DI+ is above DI-, buyers are in control. When DI- is on top, sellers have the edge.
The volume bars at the bottom change color based on whether the candle was bought or sold, with brighter colors indicating stronger order flow.
The candle imbalance histogram (middle section) shows you the internal pressure within each candle. Positive values mean the close was near the high, negative means it closed near the low.
The purple cumulative delta line tracks the overall buying/selling imbalance over time. When it's rising, there's more buying volume. When falling, more selling.
Info Table
The table in the top-right gives you a quick summary:
State - Current market condition (Strong Buy, Bullish, Bearish, Strong Sell)
DI Pressure - Net directional pressure
Candle Imb - Current candle imbalance score
Delta - Cumulative volume delta
Composite - Combined score from all components
Volume - Current volume level (Low, Normal, High, Extreme, Strong)
Flow - Order flow strength (Weak, Moderate, Strong)
Settings You Can Adjust
Core Settings:
DI Length - How many periods to use for DI calculation (default 14)
Volume Weighting - Whether to reduce the impact of low volume bars
ATR Normalization - Scales the indicator to match current volatility
Low Volume Threshold - What counts as "low volume" (default 0.3 = 30% of average)
Candle Analysis:
Imbalance Smoothing - How much to smooth the candle imbalance line
Delta Lookback Period - How far back to track cumulative delta
Order Flow:
Flow Sensitivity - Higher values = stricter requirements for "strong flow" signals
Visual:
Toggle various display elements on/off to clean up your chart
Alerts
The indicator includes several alert conditions:
Strong buy/sell signals (DI crossovers with strong volume)
Candle imbalance flips (pressure shifts)
Extreme pressure conditions (composite score above 70 or below -70)
Divergences between price and indicator
Strong order flow detection
Best Use Cases
This works well for:
Confirming trend strength
Identifying potential reversals when price and pressure diverge
Spotting low-conviction moves (weak volume plus conflicting signals)
Finding high-probability entries when all components align
A Few Notes
Low volume periods get a gray background warning - be careful with signals during these times
The indicator combines multiple analysis methods, so you're getting a more complete picture than any single metric alone
Extreme readings (bright green/red backgrounds) often precede reversals or consolidation
Works on any timeframe, though I find it most useful on 5-minute charts and up
This is not a magic bullet, but it does help you see what's actually happening beneath price action. Use it alongside your other analysis tools and always manage your risk.
Volume
Buy, Sell and Trend Signal by ToluThis indicator is a simple guidance for the trend. Best works in index charts to show general market trend. Use it in daily graphs. In lower periods there may be more fake signals due to daily noise. Also intraday signals may be fake so better use , is more meaningful when close to trading session. I do not accept any responsiblity from the use of this indicator.
Risk Disclaimer
It is important to understand that this indicator is purely for educational purposes, and the information presented must be considered only general in nature.
The information or the signals provided does not take your specific needs or circumstances into consideration, and you must look at your own personal situation and requirements before making any financial decisions, and seek independent financial advice if necessary.

VWAP ±2σ Entry Signals (volume Weighted)This indicator builds a session based VWAP and plots the upper and lower 2nd standard deviation bands around it. These bands act as dynamic volatility edges for the session. When price reaches these outer bands, it often represents an extreme stretch away from fair value a place where mean reversion or exhaustion can occur.
The indicator generates trade signals only when price approaches the band from the correct direction, which filters out a lot of noise and reduces false touches.
How It Works
VWAP is calculated from the start of each session.
Standard deviation is computed using volume weighted prices, so the bands expand and contract with real market activity.
The upper and lower 2σ bands form natural "overextended" zones around VWAP.
Most VWAP band strategies fire signals every time price touches a band which produces a lot of junk signals.
This version avoids that by requiring direction based touches, meaning:
If price is already above the band, no sell signal appears.
If price is already below the band, no buy signal appears.

Time-Decay Liquidity Zones [BackQuant]Time-Decay Liquidity Zones
A dynamic liquidity map that turns single-bar exhaustion events into fading, color-graded zones, so you can see where trapped traders and unfinished business still matter, and when those areas have finally stopped pulling price.
What this is
This indicator detects unusually strong impulsive moves into wicks, converts them into supply or demand “zones,” then lets those zones decay over time. Each zone carries a strength score that fades bar by bar. Zones that stop attracting or rejecting price are gradually de-emphasized and eventually removed, while the most relevant areas stay bright and obvious.
Instead of static rectangles that live forever, you get a living liquidity map where:
Zones are born from objective criteria: volatility, wick size, and optional volume spikes.
Zones “age” using a configurable decay factor and maximum lifetime.
Zone color and opacity reflect current relative strength on a unified clear → green → red gradient.
Zones freeze when broken, so you can distinguish “active reaction areas” from “historical levels that have already given way”.
Conceptual idea
Large wicks with strong volatility often mark areas where aggressive orders met hidden liquidity and got absorbed. Price may revisit these areas to test leftover interest or to relieve trapped positions. However, not every wick matters for long. As time passes and more bars print, the market “forgets” some areas.
Time-Decay Liquidity Zones turns that idea into a rule-based system:
Find bars that likely reflect strong aggressive flows into liquidity.
Mark a zone around the wick using ATR-based thickness.
Assign a strength score of 1.0 at birth.
Each bar, reduce that score by a decay factor and remove zones that fall below a threshold or live too long.
Color all surviving zones from weak to strong using a single gradient scale and a visual legend.
How events are detected
Detection lives in the Event Detection group. The script combines range, wick size, and optional volume filters into simple rules.
Volatility filter
ATR Length — computes a rolling ATR over your chosen window. This is the volatility baseline.
Min range in ATRs — bar range (High–Low) must exceed this multiple of ATR for an event to be considered. This avoids tiny bars triggering zones.
Wick filters
For each bar, the script splits the candle into body and wicks:
Upper wick = High minus the max(Open, Close).
Lower wick = min(Open, Close) minus Low.
Then it tests:
Upper wick condition — upper wick must be larger than Min wick size in ATRs × ATR.
Lower wick condition — lower wick must be larger than Min wick size in ATRs × ATR.
Only bars with a sufficiently long wick relative to volatility qualify as candidate “liquidity events”.
Volume filter
Optionally, the script requires a volume spike:
Use volume filter — if enabled, volume must exceed a rolling volume SMA by a configurable multiplier.
Volume SMA length — period for the volume average.
Volume spike multiplier — how many times above the SMA current volume needs to be.
This lets you focus only on “heavy” tests of liquidity and ignore quiet bars.
Event types
Putting it together:
Upper event (potential supply / long liquidation, etc.)
Occurs when:
Upper wick is large in ATR terms.
Full bar range is large in ATR terms.
Volume is above the spike threshold (if enabled).
Lower event (potential demand / short liquidation, etc.)
Symmetric conditions using the lower wick.
How zones are constructed
Zone geometry lives in Zone Geometry .
When an event is detected, the script builds a rectangular box that anchors to the wick and extends in the appropriate direction by an ATR-based thickness.
For upper (supply-type) zones
Bottom of the zone = event bar high.
Top of the zone = event bar high + Zone thickness in ATRs × ATR.
The zone initially spans only the event bar on the x-axis, but is extended to the right as new bars appear while the zone is active.
For lower (demand-type) zones
Top of the zone = event bar low.
Bottom of the zone = event bar low − Zone thickness in ATRs × ATR.
Same extension logic: box starts on the event bar and grows rightward while alive.
The result is a band around the wick that scales with volatility. On high-ATR charts, zones are thicker. On calm charts, they are narrower and more precise.
Zone lifecycle, decay, and removal
All lifecycle logic is controlled by the Decay & Lifetime group.
Each zone carries:
Score — a floating-point “importance” measure, starting at 1.0 when created.
Direction — +1 for upper zones, −1 for lower zones.
Birth index — bar index at creation time.
Active flag — whether the zone is still considered unbroken and extendable.
1) Active vs broken
Each confirmed bar, the script checks:
For an upper zone , the zone is counted as “broken” when the close moves above the top of the zone.
For a lower zone , the zone is counted as “broken” when the close moves below the bottom of the zone.
When a zone breaks:
Its right edge is frozen at the previous bar (no further extension).
The zone remains on the chart, but is no longer updated by price interaction. It still decays in score until removal.
This lets you see where a major level was overrun, while naturally fading its influence over time.
2) Time decay
At each confirmed bar:
Score := Score × Score decay per bar .
A decay value close to 1.0 means very slow decay and long-lived zones.
Lower values (closer to 0.9) mean faster forgetting and more current-focused zones.
You are controlling how quickly the market “forgets” past events.
3) Age and score-based removal
Zones are removed when either:
Age in bars exceeds Max bars a zone can live .
This is a hard lifetime cap.
Score falls below Minimum score before removal .
This trims zones that have decayed into irrelevance even if their age is still within bounds.
When a zone is removed, its box is deleted and all associated state is freed to keep performance and visuals clean.
Unified gradient and color logic
Color control lives in Gradient & Color . The indicator uses a single continuous gradient for all zones, above and below price, so you can read strength at a glance without guessing what palette means what.
Base colors
You set:
Mid strength color (green) — used for mid-level strength zones and as the “anchor” in the gradient.
High strength color (red) — used for the strongest zones.
Max opacity — the maximum visual opacity for the solid part of the gradient. Lower values here mean more solid; higher values mean more transparent.
The script then defines three internal points:
Clear end — same as mid color, but with a high alpha (close to transparent).
Mid end — mid color at the strongest allowed opacity.
High end — high color at the strongest allowed opacity.
Strength normalization
Within each update:
The script finds the maximum score among all existing zones.
Each zone’s strength is computed as its score divided by this maximum.
Strength is clamped into .
This means a zone with strength 1.0 is currently the strongest zone on the chart. Other zones are colored relative to that.
Piecewise gradient
Color is assigned in two stages:
For strength between 0.0 and 0.5: interpolate from “clear” green to solid green.
Weak zones are barely visible, mid-strength zones appear as solid green.
For strength between 0.5 and 1.0: interpolate from solid green to solid red.
The strongest zones shift toward the red anchor, clearly separating them from everything else.
Strength scale legend
To make the gradient readable, the indicator draws a vertical legend on the right side of the chart:
About 15 cells from top (Strong) to bottom (Weak).
Each cell uses the same gradient function as the zones themselves.
Top cell is labeled “Strong”; bottom cell is labeled “Weak”.
This legend acts as a fixed reference so you can instantly map a zone’s color to its approximate strength rank.
What it plots
At a glance, the indicator produces:
Upper liquidity zones above price, built from large upper wick events.
Lower liquidity zones below price, built from large lower wick events.
All zones colored by relative strength using the same gradient.
Zones that freeze when price breaks them, then fade out via decay and removal.
A strength scale legend on the right to interpret the gradient.
There are no extra lines, labels, or clutter. The focus is the evolving structure of liquidity zones and their visual strength.
How to read the zones
Bright red / bright green zones
These are your current “major” liquidity areas. They have high scores relative to other zones and have not yet decayed. Expect meaningful reactions, absorption attempts, or spillover moves when price interacts with them.
Faded zones
Pale, nearly transparent zones are either old, decayed, or minor. They can still matter, but priority is lower. If these are in the middle of a long consolidation, they often become background noise.
Broken but still visible zones
Zones whose extension has stopped have been overrun by closing price. They show where a key level gave way. You can use them as context for regime shifts or failed attempts.
Absence of zones
A chart with few or no zones means that, under your current thresholds, there have not been strong enough liquidity events recently. Either tighten the filters or accept that recent price action has been relatively balanced.
Use cases
1) Intraday liquidity hunting
Run the indicator on lower timeframes (e.g., 1–15 minute) with moderately fast decay.
Use the upper zones as potential sell reaction areas, the lower zones as potential buy reaction areas.
Combine with order flow, CVD, or footprint tools to see whether price is absorbing or rejecting at each zone.
2) Swing trading context
Increase ATR length and range/wick multipliers to focus only on major spikes.
Set slower decay and higher max lifetime so zones persist across multiple sessions.
Use these zones as swing inflection areas for larger setups, for example anticipating re-tests after breakouts.
3) Stop placement and invalidation
For longs, place invalidation beyond a decaying lower zone rather than in the middle of noise.
For shorts, place invalidation beyond strong upper zones.
If price closes through a strong zone and it freezes, treat that as additional evidence your prior bias may be wrong.
4) Identifying trapped flows
Upper zones formed after violent spikes up that quickly fail can mark trapped longs.
Lower zones formed after violent spikes down that quickly reverse can mark trapped shorts.
Watching how price behaves on the next touch of those zones can hint at whether those participants are being rescued or squeezed.
Settings overview
Event Detection
Use volume filter — enable or disable the volume spike requirement.
Volume SMA length — rolling window for average volume.
Volume spike multiplier — how aggressive the volume spike filter is.
ATR length — period for ATR, used in all size comparisons.
Min wick size in ATRs — minimum wick size threshold.
Min range in ATRs — minimum bar range threshold.
Zone Geometry
Zone thickness in ATRs — vertical size of each liquidity zone, scaled by ATR.
Decay & Lifetime
Score decay per bar — multiplicative decay factor for each zone score per bar.
Max bars a zone can live — hard cap on lifetime.
Minimum score before removal — score cut-off at which zones are deleted.
Gradient & Color
Mid strength color (green) — base color for mid-level zones and the lower half of the gradient.
High strength color (red) — target color for the strongest zones.
Max opacity — controls the most solid end of the gradient (0 = fully solid, 100 = fully invisible).
Tuning guidance
Fast, session-only liquidity
Shorter ATR length (e.g., 20–50).
Higher wick and range multipliers to focus only on extreme events.
Decay per bar closer to 0.95–0.98 and moderate max lifetime.
Volume filter enabled with a decent multiplier (e.g., 1.5–2.0).
Slow, structural zones
Longer ATR length (e.g., 100+).
Moderate wick and range thresholds.
Decay per bar very close to 1.0 for slow fading.
Higher max lifetime and slightly higher min score threshold so only very weak zones disappear.
Noisy, high-volatility instruments
Increase wick and range ATR multipliers to avoid over-triggering.
Consider enabling the volume filter with stronger settings.
Keep decay moderate to avoid the chart getting overloaded with old zones.
Notes
This is a structural and contextual tool, not a complete trading system. It does not account for transaction costs, execution slippage, or your specific strategy rules. Use it to:
Highlight where liquidity has recently been tested hard.
Rank these areas by decaying strength.
Guide your attention when layering in separate entry signals, risk management, and higher-timeframe context.
Time-Decay Liquidity Zones is designed to keep your chart focused on where the market has most recently “cared” about price, and to gradually forget what no longer matters. Adjust the detection, geometry, decay, and gradient to fit your product and timeframe, and let the zones show you which parts of the tape still have unfinished business.

Advanced Triple Strategy ScalperHere are the three scalping strategies presented in the video "3 Scalping Strategies That Work Every Day (Backtested & Proven)" by Asia Forex Mentor – Ezekiel Chew:
### Scalper’s Trend Filter (Triple EMA)
This strategy uses three EMAs (25, 50, 100) on the 5-minute chart to filter high-probability trades aligned with momentum .
- Only trade when all three EMAs are angled in the same direction and clearly separated (no crossing or tangling) .
- Enter when price pulls back toward the 25 or 50 EMA and then bounces back toward the 25 EMA, but do not enter if price closes below the 100 EMA .
- Set stop-loss just below the 50 EMA or swing low and aim for a risk-to-reward ratio of 1:1.5 .
### Flip Zone Trap (Reversal Catching)
This method identifies precise reversal moments where market structure shifts from weakness to strength .
- Use the 15-min chart to locate key support or resistance zones where price previously reacted .
- Wait for price to stop making lower lows and begin making higher highs (or vice versa for shorts); confirm with a trendline break AND follow-through (higher lows & highs within 5-7 candles) .
- Use confirmation candles (bullish engulfing, pin bar rejection) at the zone before entry .
### Liquidity Shift Trigger (Smart Money Trap)
This system leverages institutional stop hunts and liquidity sweeps at key zones for sniper entries .
- Start with a 15-min chart to identify structure breaks and points of interest (order blocks, flip zones, demand zones) .
- Drop to 1-min chart and wait for price to enter the refined zone and sweep liquidity (sharp wick/spike below/above key level) .
- Once liquidity is swept, wait for a clean structure shift (break of most recent internal high or low) within 5–6 candles—if confirmed, refine entry to the candle that caused the break and enter when price returns to that candle with a strong reaction .
***
### Practical Application
- These strategies are systematic, rule-based, and designed to cut out fake moves, avoid early stop-outs, and align entries with momentum and institutional activity .
- Perfect for short timeframes and volatile pairs like XAUUSD, especially if paired with additional confirmation from other technical analysis tools .
All three strategies emphasize filtering noise, waiting for momentum/trend confirmation, and avoiding impulsive entries—key principles for consistent scalping success

NeuraEdge ORB Professional Opening Range Breakout Indicator-15m🚀 NeuraEdge ORB - Professional Opening Range Breakout Indicator
We're excited to release this clean, effective Opening Range Breakout (ORB) indicator for the trading community. The 15-minute ORB is one of the most time-tested intraday strategies, and we've built this tool to make it simple and actionable.
━━━━━━━━━━━━━━━━━━━━━━━━━━━━━━━━━━━━━━━━━━━━━━━━━━━━
📖 WHAT IS THE 15-MINUTE ORB STRATEGY?
The Opening Range Breakout strategy captures the initial price range established in the first 15 minutes of market open (9:30-9:45 AM ET). This range often sets the tone for the trading day, as institutional order flow and overnight gap reactions play out during this window.
The concept is simple:
- Mark the HIGH and LOW of the first 15 minutes
- Trade the breakout when price breaks above or below this range
- Use the opposite side of the range as your stop loss
━━━━━━━━━━━━━━━━━━━━━━━━━━━━━━━━━━━━━━━━━━━━━━━━━━━━
⚙️ HOW TO USE THIS INDICATOR
1️⃣ SETUP
• Apply to SPY, QQQ, IWM, or any liquid stock/ETF
• Recommended timeframes: 1-minute or 5-minute charts
• The indicator automatically detects the 9:30-9:45 AM ET session
2️⃣ WAIT FOR THE RANGE
• A blue box will form showing the Opening Range
• Wait for the 15-minute period to complete (marked "✅ COMPLETE" in dashboard)
• Note the range size - larger ranges often mean stronger moves
3️⃣ TRADE THE BREAKOUT
• 🟢 LONG: When price closes above the Opening Range High
• 🔴 SHORT: When price closes below the Opening Range Low
• Signals appear automatically with entry, stop loss (SL), and take profit (TP) levels
4️⃣ MANAGE YOUR TRADE
• Stop Loss: Placed at opposite side of range (default) or midpoint
• Take Profit: Based on your selected Risk:Reward ratio
• The indicator tracks win rate automatically
━━━━━━━━━━━━━━━━━━━━━━━━━━━━━━━━━━━━━━━━━━━━━━━━━━━━
🎯 ENTRY TYPES
BREAKOUT MODE (Default)
- Enters immediately when price breaks the range
- More signals, catches the initial move
- Best for: Trending days, high momentum
RETEST MODE
- Waits for price to break out, then pull back to the range
- Fewer signals, better entry price
- Best for: Choppy days, tighter stops
━━━━━━━━━━━━━━━━━━━━━━━━━━━━━━━━━━━━━━━━━━━━━━━━━━━━
📊 SETTINGS EXPLAINED
Display Settings:
- Show Signals - Toggle buy/sell signals
- Show Opening Range Box - Visual box around the 15-min range
- Show Dashboard - Information panel with status and stats
Opening Range Settings:
- Opening Range Minutes - Default 15, adjustable 5-60
- Stop Trading After - Prevents late-day trades (default 3PM ET)
Entry Settings:
- Entry Type - Breakout or Retest
- Require Volume Confirmation - Only signals on above-average volume
- Require FVG Confluence - Adds Fair Value Gap filter for extra confirmation
Risk Management:
- Stop Loss Placement - Opposite Side / Midpoint / ATR Based
- Risk:Reward Ratio - Set your target (1.5 recommended)
━━━━━━━━━━━━━━━━━━━━━━━━━━━━━━━━━━━━━━━━━━━━━━━━━━━━
💡 TIPS FOR BEST RESULTS
✅ DO:
- Trade liquid instruments (SPY, QQQ, major stocks)
- Use 1-5 minute charts for better entry precision
- Respect the stop loss - the range defines your risk
- Pay attention to range size (0.5-1.5x ATR is ideal)
- Be patient - only 1-2 setups per day
❌ AVOID:
- Trading both directions on the same day
- Taking trades after 2-3 PM ET
- Very small ranges (likely to get chopped out)
- Low volume breakouts (often fail)
━━━━━━━━━━━━━━━━━━━━━━━━━━━━━━━━━━━━━━━━━━━━━━━━━━━━
📈 DASHBOARD INFORMATION
The dashboard shows:
- OR Status - Forming / Complete / Waiting
- OR High/Low - The range levels
- Range Size - In points and ATR multiples
- Breakout Direction - Long / Short / None
- Volume Status - High or Normal
- Win Rate - Tracked automatically
- W/L Record - Wins and losses count
━━━━━━━━━━━━━━━━━━━━━━━━━━━━━━━━━━━━━━━━━━━━━━━━━━━━
🔔 ALERTS INCLUDED
- Opening Range Complete - Notifies when the 15-min range is set
- ORB Long Signal - Buy signal triggered
- ORB Short Signal - Sell signal triggered
- Breakout Up/Down - Range broken (even without signal)
━━━━━━━━━━━━━━━━━━━━━━━━━━━━━━━━━━━━━━━━━━━━━━━━━━━━
⚠️ DISCLAIMER
This indicator is for educational and informational purposes only. Past performance does not guarantee future results. Always use proper risk management and never risk more than you can afford to lose. This is not financial advice.
━━━━━━━━━━━━━━━━━━━━━━━━━━━━━━━━━━━━━━━━━━━━━━━━━━━━
━━━━━━━━━━━━━━━━━━━━━━━━━━━━━━━━━━━━━━━━━━━━━━━━━━━━
We hope you find this indicator valuable in your trading journey!
💬 Questions or feedback? Leave a comment below.
🌐 Check out our full Indicator Suite: www.neura-edge.com
📧 Support: support@neura-edge.com
Happy Trading!

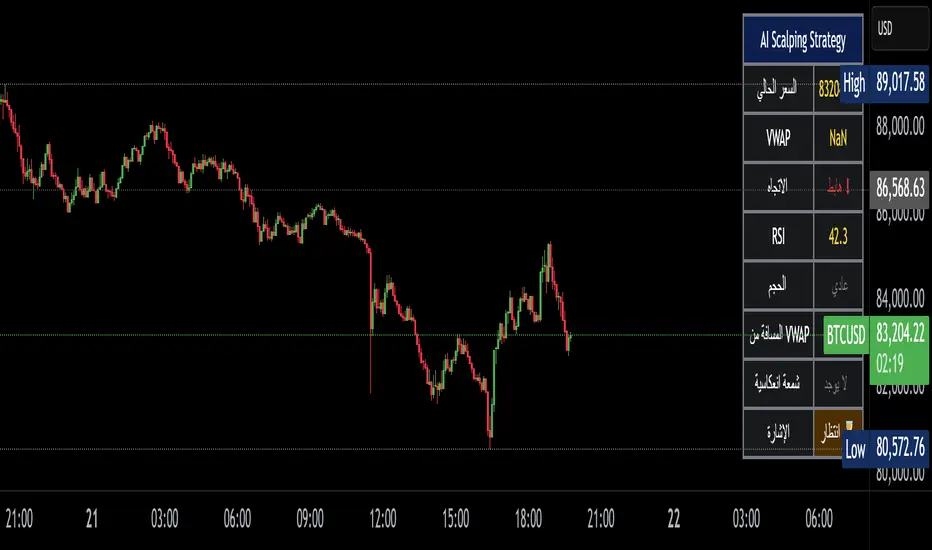
Institution Radar Institution Radar
Institution Radar compares Price RSI with Volume-Delta RSI to show when price moves are real (backed by volume) or fake (moving without volume).
This helps reveal two powerful concepts:
Absorption (Bullish or Bearish)
Absorption happens when a large limit order is sitting in the order book.
Market orders hit it over and over, but the level doesn't break.
This usually means:
Strong players are absorbing the aggressive orders
Price is likely to move in the opposite direction
The next candle often reacts immediately
Can lead to a full reversal or just a short 1–2 candle move
Exhaustion (Bullish or Bearish)
Exhaustion happens when institutions pull their limit orders away.
There is no real volume behind the move, so price drifts up or down easily.
This usually means:
The current move is weak
A slowdown, pullback, or reversal is likely
Often shows up right before a flip in direction
📌 What the Signals Mean
Green signal → next candles often push upward
Red signal → next candles often push downward
These can mark trend reversals or temporary 1–2 candle reactions
🎚️ Sensitivity Setting
You can adjust how strict the signals are:
Lower sensitivity = more signals, more noise
Higher sensitivity = fewer signals, but more accurate and stronger
A higher sensitivity is recommended if you only want the cleanest institutional moments.

Better Volume PRO v2.0 (Enhanced + Stats)Better Volume PRO v2.0 is an advanced volume analysis indicator for TradingView that estimates buying versus selling pressure on each candle, assigns a Confidence Score to each signal, and filters out market noise to display only high-quality trading opportunities.

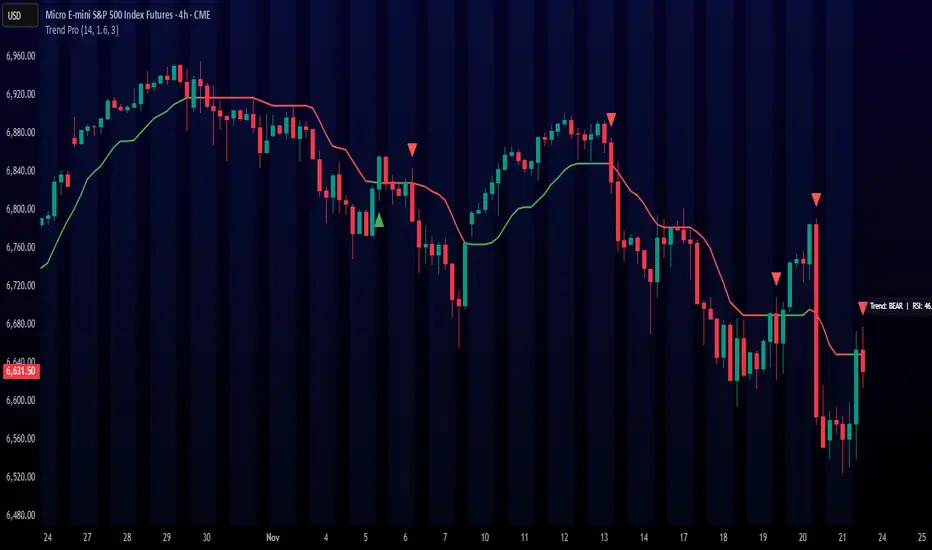
Trend ProTrend Pro is a volatility-adaptive trend and momentum system designed for scalping, day trading, and short-term swing trading.
It uses an ATR-based dynamic trend line (Alpha-Trend style) to identify momentum shifts and confirm directional strength.
Unlike traditional moving averages, Trend Pro adapts to volatility and reacts faster during expansions while filtering noise during chop.
🔍 How Trend Pro Works
Trend Pro builds a dynamic volatility channel using ATR and tracks whether price stays above or below this adaptive line.
When price crosses and closes on the opposite side, it suggests a shift in market control.
When price closes above the line → the trend turns BULLISH (green)
When price closes below the line → the trend turns BEARISH (red)
This gives a clear, visual trend state without repainting.
Tips for Best Performance:
✔ Avoid signals directly inside major ranges or sideways chop
✔ Strongest entries come after small pullbacks into the line
✔ Combine signals with:
Market structure
Key swing highs/lows
Liquidity sweeps
Session timing (NYSE open, power hour)
✔ Trend Pro works best when used with the trend, not counter-trend
Enjoy!
SimpleAlgo.io V4.1SimpleAlgo V4.1 — Multi-Layer Trend & Market Structure Framework
SimpleAlgo V4.1 is an advanced all-in-one market framework designed to help traders visually interpret trend direction, volatility conditions, potential reversal areas, and trade planning levels — all without relying on traditional lagging indicators.
This version introduces improved trend mapping, refined reversal zones, adaptive take-profit logic, and expanded risk-management visualization.
🔹 Core Concept
V4.1 analyzes price movement, volatility behavior, and momentum shifts to outline trend bias, market context, and potential turning points.
The goal is not to predict price, but to organize the chart into clear, actionable regions:
- Trending vs ranged environments
- Extended vs balanced price conditions
- Momentum shifts and transitions
- Areas where reactions or reversals are more likely
The indicator is designed to complement your own strategy — not produce mechanical buy/sell rules.
🔹 Trend Identification
The internal trend engine evaluates both directional movement and volatility compression/expansion to determine whether conditions favor a bullish or bearish environment.
You can optionally display:
- A trend tracker line
- A trend cloud
- Gradient-based bar coloring for momentum shifts
- A smoothing-based signal line for visual confirmation
These tools help quickly identify the dominant directional context.
🔹 Signals (Optional)
V4.1 can highlight potential long/short opportunities when price transitions through key internal levels while aligned with the active trend environment.
These are points of interest, not trade instructions.
They work best when combined with structure, trend context, and independent analysis.
🔹 Reversal Zones
Volatility-influenced bands outline areas where price may become stretched relative to recent conditions.
These zones can help identify:
- Potential exhaustion
- Pullback regions in trends
- Profit-taking areas
- High-risk chase zones
- Reversal bands do not predict tops or bottoms — they simply highlight areas where reactions become more probable.
🔹 Support & Resistance
Optional pivot-based S/R levels automatically mark key structural areas.
These are anchored on recent swing points and help contextualize:
- Breakouts
- Failed breakouts
- Retests
- Range boundaries
🔹 Risk Management Tools
V4.1 includes a complete visual framework for trade planning:
- Dynamic Take-Profit Markers
- Adaptive targets based on evolving momentum conditions.
- Can help identify when a move starts losing strength.
- Static Multi-R TP/SL Levels
- ATR-based levels that outline:
- Stop distance
- 1:1 Take Profit
- 2:1 Take Profit
- 3:1 Take Profit
- An adaptive trailing stop that responds to trend strength and volatility shifts.
(Useful for riding strong moves while locking in unrealized gains.)
🔹 Trend Cloud
A multi-layer directional zone that provides a higher-level view of trend health and momentum alignment.
Useful for identifying:
- Expanding / contracting momentum
- Trend continuations
- Transitional phases
- Trend exhaustion
🔹 Customization
Nearly every component can be toggled on/off:
- Trend tracking
- Cloud
- Signals
- Bands
- Bar coloring
- S/R
- Dynamic TP
- Static TP/SL layers
- Trailing stops
- You can also switch sensitivity modes for scalping, day trading, or swing trading.
⚠️ Disclaimer
This tool is for chart analysis and educational use only.
It does not predict future price movement or guarantee results.
All trading involves risk, and no indicator should be used in isolation.

ADX HUD LabelStatic ADX Strength Label
Drops a fixed label in the top-right corner of your chart that only tells you one thing: is the trend worth trading or not.
The label constantly updates the current ADX value and changes color: red below 20 (dead / choppy), yellow between 20–25 (warming up), and green above 25 (strong trend, go hunting).
Use it as a quick trend-filter so you’re not forcing trades when the market is caca chop.

Cumulative Volume Delta (HA Option)# **📘 Ultimate Guide to Trading With CVD Heikin Ashi (CVD+)**
## **🔍 What This Indicator Shows**
This tool plots **Cumulative Volume Delta (CVD)** as candlesticks—optionally transformed into **Heikin Ashi CVD candles**.
Instead of price, each candle represents the *battle between buyers and sellers* within your chosen timeframe.
**Volume Delta = Buying Volume – Selling Volume**
CVD takes all deltas and stacks them cumulatively, showing who is controlling the auction *over time*.
With Heikin Ashi smoothing layered on top, trend detection becomes cleaner, letting you see the “true pressure” behind price moves.
---
# **💡 Why CVD Is a Game Changer**
Most traders only see price.
Serious traders watch **pressure**.
CVD exposes what price hides:
* Absorption
* Hidden accumulation
* Seller exhaustion
* Fake breakouts
* True reversals
* Momentum strength / weakness
* Smart money footprint
When combined with Heikin-Ashi smoothing, you get delta trends with way less noise and fewer fake flips.
---
# **📈 How to Actually Use It (The Edge)**
## **1. Spot True Trend vs. Fake Trend**
If **price goes up** but **CVD goes down**, that’s:
* Passive sellers absorbing
* A weak rally
* High probability of reversal
If **price pulls back** but **CVD keeps rising**, that’s:
* Secret accumulation
* A continuation setup
* Great dip-buy opportunity
**Rule of thumb:**
🔹 *Follow the CVD trend, not the price noise.*
---
## **2. Catch Reversals Early**
Watch for:
### **🔻 Bearish Reversal Signals**
* CVD makes a **lower high**
* Heikin Ashi CVD prints **red bodies with rising upper shadows**
* Price makes one final push up on low delta
This is classic distribution → the drop usually follows fast.
### **🔹 Bullish Reversal Signals**
* CVD forms a **higher low**
* HA CVD flips from red to green with full bodies
* Price still looks weak = bottom forming
This is exactly how pros catch bottoms early.
---
## **3. Identify Absorption Levels**
If price hits a level multiple times but CVD keeps climbing (or falling), that level is being defended.
Example:
* Price stalls at support
* CVD keeps rising
= **Buyers absorbing sells → high-probability bounce**
Opposite works for resistance.
---
## **4. Validate Breakouts**
A breakout with *weak or negative CVD* is usually a trap.
A breakout with **strong, rising HA CVD** is real.
If CVD diverges from the breakout direction → fade it.
If CVD confirms → ride it.
---
## **5. Use Heikin Ashi to Stay in Trends**
HA smoothing removes the nasty chop of raw delta data.
Look for:
* Consecutive **full-body teal candles = strong buying wave**
* Consecutive **full-body red candles = strong selling wave**
* Small-bodied candles after a trend = momentum dying
This keeps you in winners longer and cuts losers faster.
---
# **🎯 Practical Trading Playbook**
### **A) Long Setup**
1. Price pullback into support
2. CVD stays bullish or makes a higher low
3. HA CVD flips green or prints a strong body
4. Enter long
5. Stop under CVD structural low
### **B) Short Setup**
1. Price pushes into resistance
2. CVD forms bearish divergence
3. HA CVD prints red bodies
4. Enter short
5. Stop above CVD swing high
### **C) Chop Filter**
No clear HA CVD trend = avoid trading → stop donating money to the market.
---
# **🧠 Tips for Mastery**
* Use lower timeframe delta (1m–5m) for scalping entries
* Use a higher anchor timeframe (1D) to define direction
* When price trends but CVD is flat → expect a fakeout
* When CVD trends but price is flat → expect a breakout
* Trade WITH delta, fade AGAINST delta
---
# **⚠️ Important Notes**
* Crypto = full tick-by-tick volume → CVD is extremely accurate
* Stocks = depends on your broker/data vendor
* Futures = best signal-to-noise ratio
* If your symbol has no volume → indicator will warn you
---
# **📥 Recommended Settings**
* **Anchor timeframe**: 1D or 4H
* **Lower timeframe**: 1m, 3m, or 5m
* **Heikin Ashi**: ON for trend filtering, OFF for raw delta
---
# **🔥 Final Word**
Price can lie.
Delta usually doesn’t.
CVD + Heikin Ashi gives you the closest thing to reading the market’s heartbeat in real time.
Use it to confirm breakouts, detect reversals early, identify real trend strength, and avoid getting caught in manipulation.
If you learn to read CVD well…
you stop trading price, and start trading the **intent** behind the price.

Automatic Swing AVWAPsUnique VWAP anchoring technique
The VWAP indicator is one of the most popular tools in trading, used by millions of traders daily, including institutional traders. KV's Anchored VWAP system is specifically designed to deliver more precise entry points. This toolkit also includes traditional anchored VWAPs, such as the Daily VWAP, Previous Day VWAP, and more.
Automated key levels
Support and resistance levels are a must in every trader's toolbox, including KV's. However, only the most critical levels are effective, and this toolkit is built on KV's years of experience to include only the most relevant ones for accurate trading zones.

SimpleAlgo V2.1SimpleAlgo V2.1 – Momentum and Volatility Framework
Overview
SimpleAlgo V2.1 combines momentum waves, volatility envelopes, key price levels, and optional entry markers to provide a structured view of market behavior. The tool is designed to help traders interpret trend conditions, momentum shifts, and volatility expansion or compression through a clean set of visual components.
Momentum Waves
The indicator calculates multiple smoothed momentum waves using adaptive EMA logic. These waves highlight short and medium-term momentum behavior.
Color fills between waves help visualize momentum changes and transitions in trend strength.
Entry Signals (Optional)
Potential long or short markers can appear when a momentum shift aligns with a wave crossover. These are visual aids intended to highlight moments of interest on the chart. They are not standalone trade signals and should be confirmed with additional analysis.
Volatility Envelope (Optional)
A multi-band volatility envelope constructed from smoothed true range helps identify overextension zones and expansion phases. This framework can be useful when evaluating price deviations and potential exhaustion areas.
Key Price Levels (Optional)
Pivot-based levels identify potential support and resistance areas. These levels are projected forward to help visualize structure points without repainting.
Momentum Cloud and Bar Shading
The script includes cloud shading and bar coloring to help illustrate the strength and direction of momentum. These visuals help clarify trend conditions at a glance.
Position Management Tools (Optional)
When enabled, V2.1 can display hypothetical entry, stop, and target levels based on ATR-derived risk measurements. These elements provide a visual framework for trade planning only and do not execute or manage trades.
Alerts
Alert conditions are available for potential long and short entries based on the internal wave-cross and momentum logic.
Customization
Users can adjust responsiveness, volatility settings, level lookback, cloud visibility, shading, bar coloring, and all position-management parameters. Every layer can be enabled or disabled depending on preference and trading style.
Recommended Use
This tool is most effective when combined with a broader analysis approach that incorporates higher timeframe context, structure, and risk management principles. It should not be used as a standalone trading system.
Disclaimer
This indicator is for technical analysis and educational purposes only. It does not predict future price movement or guarantee results. All trading involves risk.

SimpleAlgo V1.1SimpleAlgo V1.1 – Market Structure & Trend Framework
Overview
SimpleAlgo V1.1 is designed to simplify chart analysis by combining trend direction, volatility channels, dynamic support and resistance, and optional breakout logic. The script provides a structured view of market behavior through visual layers built for clarity.
Features
– Adaptive ATR-based trend engine with selectable sensitivity (Conservative, Balanced, Aggressive)
– EMA cloud for short and mid-term momentum structure
– Multi-layer volatility channels based on smoothed Keltner calculations
– Automatic support and resistance levels using pivot logic
– Optional breakout markers for structural highs and lows
– Optional linear regression trend lines with deviation bands
– Long and short markers when price interacts with the trend engine
– Alert conditions for long, short, support break, resistance break, and general signals
– Fully configurable inputs to enable or disable any component
How to Use
– Start by selecting the preferred trend sensitivity.
– Observe price relative to the trend engine to determine directional bias.
– Enable the EMA cloud and volatility channels to assess momentum and volatility conditions.
– Turn on support/resistance and breakout markers to identify structural levels and break conditions.
– Use long/short markers only as visual cues and confirm with additional analysis.
Combine with higher timeframe context and proper risk management.
Disclaimer
This tool is intended for technical analysis and educational purposes only. It does not provide financial advice or guarantee performance. All trading involves risk.

Day Trading Kombinator (COINCAVE)Day Trading Kombinator v6 (1min)
A multi-factor day trading indicator that combines moving averages, MACD, RSI, automatic daily pivot levels, dynamic support/resistance based on swing highs/lows, volume spike detection, and ATR volatility.
Ideal for: Intraday and swing traders who want clear, robust trend and momentum confirmation with clean, chart-friendly signals.
I mostly used this settings on the 1min chart!
Let me know if you want a one-sentence version or adjustments for a different focus!

IDX - 7UP v6 ENHANCED alertsIDX-7UP v6 ENHANCED — Short Public Description
IDX-7UP v6 ENHANCED is a multi-confirmation trend system built for FX, indices, commodities, and metals.
It combines Supertrend, multi-asset strike levels, volume momentum, standard-deviation zones, support/resistance, RSI, ADX, and session behavior to generate high-probability BUY/SELL signals.
The indicator includes four signal types:
REV (reversal), CONT (trend continuation), STRK (strike-momentum break), and SESS (session re-entry).
Each signal is scored using an 8-point confirmation model to ensure quality.
Features include:
• Auto-strike detection for 10 symbols
• Optional simple or detailed chart labels
• Daily SD levels, S/R, ADX-colored trend MA
• Volume spike detection
• Full dashboard with trend, RSI, ADX, volume, and last signal info
• Buy/Sell alerts included
Designed for traders who want structured, strike-based trend detection with strong filtering and clean visual signals.
Alerts
The script includes three alert types:
Buy Signal, Sell Signal, Any Signal Detected
Alerts fire immediately when confirmation thresholds are met.
Confirmation Scoring (0-8 Points)
Every signal passes through an 8-point confirmation system including:
Strike proximity or strike alignment
Daily Standard-Deviation levels (+1, +0.3, -0.3, -1)
Support/Resistance breaks or bounces
Volume filter or high-volume continuation
RSI momentum (OB/OS or rising/falling sequences)
ADX trend-strength filter
SMA-based trend alignment (SMA8 & SMA21)
Signals must meet your minimum confirmation threshold before triggering.

Hidden Zone Detector AI - Crypto/Forex/StockHidden Zone Detector AI - Crypto Forex Stock
Hidden Zone Detector AI is a professional TradingView indicator designed to find hidden supply and demand zones across markets — crypto, forex and stocks — and surface high-probability areas earlier than classical pivot-only methods. It combines price structure analysis, volatility/ATR sizing, volume profiling and multi-mode AI heuristics (Fast / Balanced / Accurate) to generate prediction zones, highlight tested areas, and visually mark zone breakouts. Built with practical trader workflow in mind: configurable anti-repaint options, adaptable Light/Dark UI, clear labels, and candle-coloring for immediate visual context.
How it works
• Detects hidden zones by scanning pivot formations and finding internal “hidden” bars that represent real institutional activity (not just visible swing points).
• Scores zones by size (ATR-relative), volume, and touch characteristics to produce a strength percentage (Weak/Medium/Strong).
• AI heuristics aggregate price, momentum, moving averages, RSI/MACD signals and volume patterns to propose prediction zones — adjustable for speed vs. accuracy.
• Zones are drawn as persistent boxes with optional midlines, labels, and tailored styling when broken or tested.
Main advantages
• Early edge: finds hidden zones that often act before obvious pivots.
• Actionable visuals: labeled zones, color-coded candles, and breakout styling speed decision-making.
• Flexible AI modes: choose Fast for responsiveness, Balanced for day-to-day use, or Accurate for stricter signals.
• Anti-repaint controls: require confirmed bars for predictions to improve signal reliability.
• Multi-market ready: tuned for crypto, forex and stock chart behavior.
• Light/Dark friendly: UI color handling ensures labels remain readable on any chart background.
• Open & reusable: released under Mozilla Public License 2.0 (MPL-2.0) — use and adapt freely with attribution.
Best practices & tips
• Start with Balanced mode and sensitivity ~5; increase sensitivity for earlier but noisier predictions.
• Use prediction confirmation (Require AI Prediction Confirmation) for lower repaint risk.
• Combine zone reads with higher-timeframe context and orderflow/volume tools for stronger entries.
• Adjust max active zones and opacity to keep charts clean on lower timeframes.
License & author
Mozilla Public License 2.0 (MPL-2.0).
Author: a_jabbaroff — created with care for the TradingView community and fellow traders.

Smart Money Volume Matrix [Ata]Smart Money Volume Matrix
The Smart Money Volume Matrix (SMV Matrix) is an advanced volume-spread analysis (VSA) dashboard and charting tool designed to identify significant market anomalies by analyzing the relationship between price extremes and volume flow.
Unlike traditional indicators that rely solely on moving averages or oscillators, this tool performs a "Snapshot Analysis" of a defined lookback period (default: 100 bars) to rank price action based on Order Flow Dominance. It isolates the Top 10 Highest and Lowest Close prices and scrutinizes the volume behind them to categorize market sentiment into four distinct phases: Distribution, No Demand, Absorption, and Exhaustion.
Core Logic & Methodology
The script operates on a Zero-Lag Snapshot Engine. It does not print historical signals bar-by-bar; instead, it evaluates the current market structure relative to the recent history (Lookback Period).
1. Ranking Engine: The script scans the lookback period to find the Top 10 Highest Closes and Top 10 Lowest Closes.
2. Volume Classification: For each ranked bar, it calculates the "Intrabar Buy/Sell Volume" (or approximates it using candle geometry if Intrabar data is unavailable).
3. Dominance Detection: It compares Buying Volume vs. Selling Volume to determine who is in control at critical price levels.
Signal Classifications (VSA Logic)
The indicator generates labels on the chart and updates the dashboard table based on the following logic:
1. At Price Tops (Resistance Areas):
- Distribution (Supply): High Price + High Total Volume + Sellers Dominant.
Interpretation: Indicates heavy institutional selling into rising prices. Often precedes a reversal.
- Buy Climax: High Price + High Total Volume + Buyers Dominant.
Interpretation: Extreme buying frenzy. While bullish, it often marks a "trap" or temporary top due to exhaustion.
- No Demand: High Price + Low Volume.
Interpretation: Prices drifted higher but lack institutional participation. A sign of weakness.
2. At Price Bottoms (Support Areas):
- Absorption: Low Price + High Total Volume + Buyers Dominant.
Interpretation: Institutional money is absorbing selling pressure (passive buying). A strong sign of accumulation.
- Panic Sell: Low Price + High Total Volume + Sellers Dominant.
Interpretation: Extreme fear. High volume at lows typically indicates capitulation and potential hands-changing.
- Exhaustion: Low Price + Low Volume.
Interpretation: Selling pressure has dried up. The market may float upward due to lack of sellers.
Key Features
- Dashboard Matrix Table:
Displays the exact Close Price, Buy/Sell Volume, and Market State (Group) for the Top 10 ranking bars.
Smart Footer: Automatically detects the active "Resistance Zone" (derived from G1 Distribution levels) and "Support Zone" (derived from G3 Absorption levels) and reports the current price status relative to these zones (e.g., "Testing Resistance", "Breakout", "At Support").
- Smart Zones (Auto S/R):
Automatically draws Support and Resistance boxes extending into the future based on the most significant volume clusters found in the rankings. Includes logic to detect "Flips" (e.g., when Support breaks, it is labeled as a flip to Resistance).
- Average Trend Channels:
Calculates a Linear Regression trend line based specifically on the coordinates of the Top 10 Highs and Top 10 Lows, providing a "Best Fit" channel for the current market structure.
- Visual Clarity:
Labels utilize a "Smart Stacking" algorithm to prevent overlap on the chart. Guide lines connect labels to their respective candles for precise identification.
Settings & Configuration
- Matrix Settings: Lookback Period (default 100 bars) and Top Rank Count.
- Volume Engine: Choose between "Intrabar (Precise)" for accurate order flow or "Geometry (Approx)" for standard volume estimation.
- Visuals: Toggle Table, Labels, Lines, Zones, and Trend Lines. Adjust transparency and font sizes.
IMPORTANT NOTE ON SNAPSHOT LOGIC
This indicator is designed as a Real-Time Dashboard. It continuously updates the "Top 10" list as new candles form. Therefore, a label that appears on a candle may disappear if that candle falls out of the Top 10 ranking or leaves the lookback window. This is intended behavior to ensure the chart always reflects the current most critical levels, rather than a historical record of past signals. It is best used for live market analysis rather than historical back testing.
Disclaimer: This tool is for educational and analytical purposes only. Volume analysis is subjective and should be used in conjunction with other methods of technical analysis.

LGZ – Liquidity Gravity Zones v1 📌 LGZ – Liquidity Gravity Zones (SVI + Net CVD + Volume)
Original Liquidity-Driven Price Magnet Model by Thomas Aaroon
📘 Concept Overview
LGZ (Liquidity Gravity Zones) is a new, original liquidity-based price-attraction model built using three core components:
SVI (Shock Volume Index) – measures abnormal volume spikes at each strike
Net CVD (NCP = CE_CVD − PE_CVD) – the real directional order-flow imbalance
Total Volume (CE + PE) – true liquidity density at each strike
Using these three elements, the indicator calculates Liquidity Gravity Weight (LGW) for every strike and identifies the strongest zones that attract price during the session.
🧠 Why This Indicator?
Traditional OI-based methods (long build-up, short build-up, OI change etc.) often lag.
LGZ focuses only on:
Real traded volume
Actual buy/sell aggression (CVD)
Shock events
Dealer hedging pressure
Strike-level liquidity clusters
This makes it far more responsive for intraday traders.
⭐ Core Formula
Liquidity Gravity Weight (LGW)
LGW = |SVI| × |Net CVD| × Total Volume
Where:
SVI = Shock Volume Index (Z-score based)
Net CVD (NCP) = CE_CVD − PE_CVD
Total Volume = CE_volume + PE_volume
LGW indicates how strongly a strike is pulling price toward it.
🎯 What the Indicator Shows
✔ Top Liquidity Gravity Zones (LGZ-1, LGZ-2, LGZ-3)
These are the strongest price magnets for the day.
✔ Gravity Lines on Chart
Each LGZ is plotted as a horizontal magnet line extending to the right.
✔ Strike-Level Liquidity Table
Shows:
Strike
SVI (Shock intensity)
LGW (Gravity strength)
This table gives a complete picture of the intraday liquidity landscape.
📈 How to Use (Intraday Trading Strategy)
🔵 1. Price gravitates toward LGZ-1
If price is below LGZ-1 → upward pull
If price is above LGZ-1 → downward pull
🔵 2. LGZ Flips = Trend Change
If LGZ-1 suddenly jumps to a different strike:
→ strong trend acceleration
🔵 3. LGZ Cluster = Reversal / Consolidation Zone
Multiple LGZ levels around the same strike indicate
→ liquidity saturation → reversal or slowdown.
🔵 4. Combine with Price Action
Best clarity on 5-minute timeframe
Use 1-minute only for entry.
🔬 Why LGZ Works
The indicator models the same reality driving option markets:
Where option volume + orderflow (CVD) + shock liquidity concentrate,
market makers hedge, and price moves toward that strike.
This is the foundation of dealer hedging mechanics and liquidity-based price movement.
🔧 Inputs
Symbol prefix (e.g., NIFTY)
Expiry (YYMMDD)
Center strike & range
Number of gravity zones
Color customization

920 Order Flow SATY ATR//@version=6
indicator("Order-Flow / Volume Signals (No L2)", overlay=true)
//======================
// Inputs
//======================
rvolLen = input.int(20, "Relative Volume Lookback", minval=5)
rvolMin = input.float(1.1, "Min Relative Volume (× avg)", step=0.1)
wrbLen = input.int(20, "Wide-Range Lookback", minval=5)
wrbMult = input.float(1, "Wide-Range Multiplier", step=0.1)
upperCloseQ = input.float(0.60, "Close near High (0-1)", minval=0.0, maxval=1.0)
lowerCloseQ = input.float(0.40, "Close near Low (0-1)", minval=0.0, maxval=1.0)
cdLen = input.int(25, "Rolling CumDelta Window", minval=5)
useVWAP = input.bool(true, "Use VWAP Bias Filter")
showSignals = input.bool(true, "Show Long/Short OF Triangles")
//======================
// Core helpers
//======================
rng = high - low
tr = ta.tr(true)
avgTR = ta.sma(tr, wrbLen)
wrb = rng > wrbMult * avgTR
// Relative Volume
volAvg = ta.sma(volume, rvolLen)
rvol = volAvg > 0 ? volume / volAvg : 0.0
// Close location in bar (0..1)
clo = rng > 0 ? (close - low) / rng : 0.5
// VWAP (session) + SMAs
vwap = ta.vwap(close)
sma9 = ta.sma(close, 9)
sma20 = ta.sma(close, 20)
sma200= ta.sma(close, 200)
// CumDelta proxy (uptick/downtick signed volume)
tickSign = close > close ? 1.0 : close < close ? -1.0 : 0.0
delta = volume * tickSign
cumDelta = ta.cum(delta)
rollCD = cumDelta - cumDelta
//======================
// Signal conditions
//======================
volActive = rvol >= rvolMin
effortBuy = wrb and clo >= upperCloseQ
effortSell = wrb and clo <= lowerCloseQ
cdUp = ta.crossover(rollCD, 0)
cdDown = ta.crossunder(rollCD, 0)
biasBuy = not useVWAP or close > vwap
biasSell = not useVWAP or close < vwap
longOF = barstate.isconfirmed and volActive and effortBuy and cdUp and biasBuy
shortOF = barstate.isconfirmed and volActive and effortSell and cdDown and biasSell
//======================
// Plot ONLY on price chart
//======================
// SMAs & VWAP
plot(sma9, title="9 SMA", color=color.orange, linewidth=3)
plot(sma20, title="20 SMA", color=color.white, linewidth=3)
plot(sma200, title="200 SMA", color=color.black, linewidth=3)
plot(vwap, title="VWAP", color=color.new(color.aqua, 0), linewidth=3)
// Triangles with const text (no extra pane)
plotshape(showSignals and longOF, title="LONG OF",
style=shape.triangleup, location=location.belowbar, size=size.tiny,
color=color.new(color.green, 0), text="LONG OF")
plotshape(showSignals and shortOF, title="SHORT OF",
style=shape.triangledown, location=location.abovebar, size=size.tiny,
color=color.new(color.red, 0), text="SHORT OF")
// Alerts
alertcondition(longOF, title="LONG OF confirmed", message="LONG OF confirmed")
alertcondition(shortOF, title="SHORT OF confirmed", message="SHORT OF confirmed")
//────────────────────────────
// End-of-line labels (offset to the right)
//────────────────────────────
var label label9 = na
var label label20 = na
var label label200 = na
var label labelVW = na
if barstate.islast
// delete old labels before drawing new ones
label.delete(label9)
label.delete(label20)
label.delete(label200)
label.delete(labelVW)
// how far to move the labels rightward (increase if needed)
offsetBars = input.int(3)
label9 := label.new(bar_index + offsetBars, sma9, "9 SMA", style=label.style_label_left, textcolor=color.white, color=color.new(color.orange, 0))
label20 := label.new(bar_index + offsetBars, sma20, "20 SMA", style=label.style_label_left, textcolor=color.black, color=color.new(color.white, 0))
label200 := label.new(bar_index + offsetBars, sma200, "200 SMA", style=label.style_label_left, textcolor=color.white, color=color.new(color.black, 0))
labelVW := label.new(bar_index + offsetBars, vwap, "VWAP", style=label.style_label_left, textcolor=color.black, color=color.new(color.aqua, 0))
//────────────────────────────────────────────────────────────────────
//────────────────────────────────────────────
// Overnight High/Low + HOD/LOD (no POC)
//────────────────────────────────────────────
sessionRTH = input.session("0930-1600", "RTH Session (exchange tz)")
levelWidth = input.int(2, "HL line width", minval=1, maxval=5)
labelOffsetH = input.int(10, "HL label offset (bars to right)", minval=0)
isRTH = not na(time(timeframe.period, sessionRTH))
rthOpen = isRTH and not isRTH
// --- Track Overnight High/Low during NON-RTH; freeze at RTH open
// --- Track Overnight High/Low during NON-RTH; freeze at RTH open
var float onHigh = na
var float onLow = na
var int onHighBar = na
var int onLowBar = na
var float onHighFix = na
var float onLowFix = na
var int onHighFixBar = na
var int onLowFixBar = na
if not isRTH
if na(onHigh) or high > onHigh
onHigh := high
onHighBar := bar_index
if na(onLow) or low < onLow
onLow := low
onLowBar := bar_index
if rthOpen
onHighFix := onHigh
onLowFix := onLow
onHighFixBar := onHighBar
onLowFixBar := onLowBar
onHigh := na, onLow := na
onHighBar := na, onLowBar := na
// ──────────────────────────────────────────
// Candle coloring + labels for 9/20/VWAP crosses
// ──────────────────────────────────────────
showCrossLabels = input.bool(true, "Show cross labels")
// Helpers
minAll = math.min(math.min(sma9, sma20), vwap)
maxAll = math.max(math.max(sma9, sma20), vwap)
// All three lines
goldenAll = open <= minAll and close >= maxAll
deathAll = open >= maxAll and close <= minAll
// 9/20 only (exclude cases that also crossed VWAP)
dcUpOnly = open <= math.min(sma9, sma20) and close >= math.max(sma9, sma20) and not goldenAll
dcDownOnly = open >= math.max(sma9, sma20) and close <= math.min(sma9, sma20) and not deathAll
// Candle colors (priority: all three > 9/20 only)
var color cCol = na
cCol := goldenAll ? color.yellow : deathAll ? color.black :dcUpOnly ? color.lime :dcDownOnly ? color.red : na
barcolor(cCol)
// Labels
plotshape(showCrossLabels and barstate.isconfirmed and goldenAll, title="GOLDEN CROSS",
style=shape.labelup, location=location.belowbar, text="GOLDEN CROSS",
color=color.new(color.yellow, 0), textcolor=color.black, size=size.tiny)
plotshape(showCrossLabels and barstate.isconfirmed and deathAll, title="DEATH CROSS",
style=shape.labeldown, location=location.abovebar, text="DEATH CROSS",
color=color.new(color.black, 0), textcolor=color.white, size=size.tiny)
plotshape(showCrossLabels and barstate.isconfirmed and dcUpOnly, title="DC UP",
style=shape.labelup, location=location.belowbar, text="DC UP",
color=color.new(color.lime, 0), textcolor=color.black, size=size.tiny)
plotshape(showCrossLabels and barstate.isconfirmed and dcDownOnly, title="DC DOWN",
style=shape.labeldown, location=location.abovebar, text="DC DOWN",
color=color.new(color.red, 0), textcolor=color.white, size=size.tiny)
// ──────────────────────────────────────────
// Audible + alert conditions
// ──────────────────────────────────────────
alertcondition(goldenAll, title="GOLDEN CROSS", message="GOLDEN CROSS detected")
alertcondition(deathAll, title="DEATH CROSS", message="DEATH CROSS detected")
alertcondition(dcUpOnly, title="DC UP", message="Dual Cross UP detected")
alertcondition(dcDownOnly,title="DC DOWN", message="Dual Cross DOWN detected")

Weighted RSI DivergenceWeighted RSI Divergence
A powerful divergence engine that grades every RSI divergence by strength, context, and confluence — helping you filter noise and focus only on the highest-probability reversal setups.
This script combines RSI divergences with five confirmation layers to produce confidence-weighted signals, clearer trade decisions, and alert-ready setups for both bullish and bearish reversals.
What This Indicator Detects
Bullish Divergence → Price makes a lower low while RSI makes a higher low
Bearish Divergence → Price makes a higher high while RSI makes a lower high
Confirmation Factors (Each Adds +1 to the Score)
Volume Spike: Above-average volume on the divergence bar
Trend Alignment: Divergence occurs in harmony with higher-timeframe trend dynamics
Key Level Proximity: Price tests significant support or resistance
Momentum Extremes: RSI reaches oversold/overbought thresholds
Candle Reversal Pattern: Engulfing, pin bar, or similar reversal structure
Confidence Scoring
1–2 → Low Confidence (gray)
3 → Medium Confidence (yellow)
4–5 → High Confidence (green/red)
Higher scores = higher-probability setups.
Visual Components
RSI plot with dynamic gradient coloring
Divergence lines mapped to RSI pivots
Signal labels showing confidence + factors
Background highlighting for high-confidence events
Real-time confidence meter for active bar conditions
Optional data table for factor-by-factor breakdown
Alerts Included
High-confidence bullish & bearish divergences
Medium-confidence signals
Any divergence meeting your minimum threshold
Best Practices
Prioritize setups with 4 or 5 confirmations
Use higher timeframes (4H, 1D, 1W) for more reliable signals
Combine with market structure and price action (S/R, HTF trend, liquidity zones)
Counter-trend divergences require stronger scores to validate
Final Notes
This script focuses on clarity, risk reduction, and selective trade timing. The confidence system helps distinguish weak divergences from high-probability reversal conditions — giving traders a structured, repeatable edge.

Alzeerr Scalping StrategyAlzeerr Scalping Strategy
A high-precision intraday scalping strategy that combines VWAP, support/resistance levels, volume confirmation, RSI momentum shifts, and reversal candlestick patterns to identify low-risk, high-accuracy trade entries. The strategy only trades in the direction of the trend relative to VWAP, focuses on high-probability pullback entries, and uses tight stop-losses with small, consistent profit targets. Designed to maximize accuracy and minimize drawdown during high-liquidity market sessions.