CNagda-MomentumX - Institutional FlowMomentumX is designed to empower traders with a deeper understanding of market movements by focusing on Institutional Flow and advanced market structure analytics. The core goal is to identify and visualize where major market participants are operating, and to translate these complex footprints into clear, actionable trading signals — all in real time.
Real-time institutional activity mapping
Actionable entry and exit signals based on live market structure
Intuitive dashboard and dynamic chart visuals
Fully customizable modules for trend, liquidity, and order blocks
Core Logic Design
At the heart of MomentumX lies a robust algorithmic engine built to capture and surface institutional trading behavior. By leveraging advanced mathematical models, the indicator calculates institutional volume ratios and price momentum to pinpoint aggressive moves from large participants.
Institutional Volume & Price Momentum:
Utilizes custom volume indicators and price change analysis to detect strong buying or selling pressure, filtering out retail noise.
Liquidity Grab Detection & Activity Zones:
The script identifies liquidity grabs by monitoring abrupt price sweeps at major support/resistance levels—often where institutions trigger stop hunts or reversals. All critical activity zones are automatically color-coded on the chart for instant recognition.
Dashboard Visualization:
A fully dynamic dashboard table overlays live scores for accumulation, distribution, strength, and weakness—giving traders a real-time scan of market health.
Trendline & Order Block Architecture:
The logic auto-detects pivot highs/lows to draw smart trendlines, while the order block system highlights key reversal areas and breaker zones—making market structure clear and actionable.
MomentumX is packed with high-performance modules, each engineered to simplify complex market behavior and enhance decision-making for traders:
Institutional Flow Signals:
Instantly identifies spots where institutional players drive momentum, using unique volume and price activity analytics.
Bullish/Bearish Liquidity Grab Detection:
Marks abrupt price moves that signal stop hunts or reversals, letting traders anticipate snap-backs or trend shifts.
Trendline Auto-Detection:
Smartly draws trendlines based on significant swing highs and lows, automatically adjusting as price evolves.
Order Block System (Rejection/Breaker):
Spots and highlights key reversal zones with order block rectangles, confirming rejections or breakouts at strategic levels.
Dashboard and Bar Coloring:
A clean dashboard overlay presents live market scores, while dynamic bar coloring makes trend, strength, and high-activity periods instantly visible.
User Input Toggles for Each Module:
Every major feature is fully customizable—enable or disable modules to match individual trading setups or preferences.
Scripting/Development
MomentumX’s scripting process is modular, enabling clarity, scalability, and fast optimization throughout development:
Initialization & Inputs:
Start by defining all user input options, module toggles, color settings, and calculation parameters—ensuring maximum flexibility early on.
Core Calculation Functions:
Script advanced institutional volume and price momentum algorithms. Build out swing length logic, market state filters, and activity scoring methods.
Detection Engines:
Develop and integrate engines for liquidity grabs, automated trendline detection, and order block identification—each with dedicated functions for speed and precision.
Visual Overlays & Plotting:
Implement powerful plotting logic for colored bars, score dashboards, trendlines, reversal zones, and liquidity markers—making every data point clear and actionable on the chart.
Testing Handlers:
Add diagnostic panels and debug outputs to refine calculations and assure accuracy in every market environment.
Sample Trade Setups (Usage)
Cnagda MomentumX delivers clarity for multiple trading styles by providing timely, actionable setups grounded in institutional behavior and market structure. Here’s how traders can leverage the indicator for confident decision-making:
Liquidity Grab Reversal
Enter trades around detected liquidity grabs when price sweeps major support/resistance and the dashboard signals a momentum shift.
Example: Wait for a bullish/Bearish grab near market lows/high, with institutional flow turning positive/negative—enter long/short for potential mean reversion.
Order Block Breakout
Trade breakouts when price cleanly rejects or flips key order block zones highlighted on the chart.
Example: Short at a marked breaker block after a rejection signal, confirmed by a downward institutional activity spike.
Trendline Continuation
Ride established market moves by entering on trendline confirmations plotted by the auto-detect system.
Example: Go long after a trendline retest, confirmed by a green bar color and dashboard strength score.
Dashboard Confirmation
Combine dashboard metrics (strength, accumulation, distribution) with bar color overlays for multi-factor entries.
Example: Enter trades only when all market signals align in real time for maximum probability.
For Short Entry check -- Weakness : For Long Entry Check - Strength With Other Indications
MomentumX is not just another indicator – it’s your edge for reading the market like an insider. By transparently mapping institutional flow, uncovering hidden liquidity zones, and color-coding every major structure shift, MomentumX transforms complexity into actionable clarity. Whether you’re scalping, swing trading, or investing, you’ll gain a decisive, real-time advantage on every chart.
Embrace smarter decisions, adapt to changing market conditions instantly, and join a new generation of technically empowered traders.
Customize, observe, and let the market reveal opportunities in a way you’ve never experienced before.
Happy Trading
Volume

ATR ProThe indicator was created for traders who are taking ATR seriously in their trading strategy and at the same time want a tool which will omit paranormal movements when showing a true average range of the asset as well os providing details on how the price moves in terms of volatility.
The Table:
ATR % Passed - Shows the current passed ATR as of average of last 10 days without taking into account biggest 2 and smallest 2 bars taking into account also the gap. The number after “/“ sign shows the true range in dollars.
Curr. D1 vs ATR % - Shows the size of current D1 bar as % of ATR above.
D1 Closure % - Shows % of closure of current D1 bar in relation to its own high or low. 100% means that the close price is the same of today’s high or low.
Volume 7d % - Shows the volume done as % of 7-day average.
5m bar - shows the size of current 5m bars in dollars and in the parentheses shows the 5m ATR in the same logic as the one above.
1m bar - shows the size of current 1m bars in dollars and in the parentheses shows the 1m ATR in the same logic as the one above.
Lines on the Chart:
The lines show the price lines where a specific % of ATR will already be passed. The indicator has 4 selections as %: 30, 50, 80 and 100 %.
Settings:
Table data position on the window
Text size
Text color
Colors of the ATR lines based on percentages.
Show/Hide the ATR lines individually
Use the Close of the current daily bar as the basis for calculating the ATR
Check this box when the market is closed – when doing homework.
Uncheck this box when the market opens, so that the ATR lines are drawn correctly on the chart.
Move the ATR line X bars to the right to keep it away from bars.

Dynamic Volume Trace Profile [ChartPrime]⯁ OVERVIEW
Dynamic Volume Trace Profile is a reimagined take on volume profile analysis. Instead of plotting a static horizontal histogram on the side of your chart, this indicator projects dynamic volume trace lines directly onto the price action. Each bin is color-graded according to its relative strength, creating a living “volume skeleton” of the market. The orange trace highlights the current Point of Control (POC)—the price level with maximum historical traded volume within the lookback window. On the right side, the tool builds a mini profile, showing absolute volume per bin alongside its percentage share, where the POC always represents 100% strength .
⯁ KEY FEATURES
Dynamic On-Chart Bins:
The range between highest high and lowest low is split into 25 bins. Each bin is drawn as a horizontal trace line across the lookback chart period.
Gradient Color Encoding:
Trace lines fade from transparent to teal depending on relative volume size. The more intense the teal, the stronger the historical traded activity at that level.
Automatic POC Highlight:
The bin with the highest aggregated volume is flagged with an orange line . This POC adapts bar-by-bar as volume distribution shifts.
Right-Side Volume Profile:
At the chart’s right edge, the script prints a box-style profile. Each bin shows:
• Total volume (absolute units).
• Percentage of max volume, in parentheses (POC bin = 100%).
This gives both raw and normalized context at a glance.
Adjustable Lookback Window:
The lookback defines how many bars feed the profile. Increase for stable HTF zones or decrease for responsive intraday distributions.
POC Toggle & Styling:
Optionally toggle POC highlighting on/off, adjust colors, and set line thickness for better integration with your chart theme.
⯁ HOW IT WORKS (UNDER THE HOOD)
Step Sizing:
over last 100 bars is divided by to calculate bin height.
Volume Aggregation:
For each bar in the , the script checks which bin the close falls into, then adds that bar’s volume to the bin’s counter.
Gradient Mapping:
Bin volume is normalized against the max volume across all bins. That value is mapped onto a gradient from transparent → teal.
POC Logic:
The bin with highest volume is colored orange both on the dynamic trace and in the right-side profile.
Right-Hand Profile:
Boxes are drawn for each bin proportional to volume / maxVolume × 50 units, with text labels showing both absolute volume and normalized %.
⯁ USAGE
Use the orange trace as the dominant “magnet” level—price often gravitates to the POC.
Watch for clusters of strong teal traces as areas of high acceptance; thin or faint zones mark low-liquidity gaps prone to fast moves.
On intraday charts, tighten lookback to reveal session-based distributions . For swing or position trading, expand lookback to surface more durable volume shelves.
Compare the right-side profile % to judge how “top-heavy” or “bottom-heavy” the current distribution is.
Use bright, intense color traces as context for confluence with structure, OBs, or liquidity hunts.
⯁ CONCLUSION
Dynamic Volume Trace Profile takes the traditional volume profile and fuses it into the body of price itself. Instead of a fixed sidebar, you see gradient traces layered directly on the chart, giving real-time context of where volume concentrated and where price may be drawn. With built-in POC highlighting, normalized % readouts, and an adaptive right-side profile, it offers both precision levels and market structure awareness in a cleaner, more intuitive form.

Volume Percentile Supertrend [BackQuant]Volume Percentile Supertrend
A volatility and participation aware Supertrend that automatically widens or tightens its bands based on where current volume sits inside its recent distribution. The goal is simple: fewer whipsaws when activity surges, faster reaction when the tape is quiet.
What it does
Calculates a standard Supertrend framework from an ATR on a volume weighted price source.
Measures current volume against its recent percentile and converts that context into a dynamic ATR multiplier.
Widens bands when volume is unusually high to reduce chop. Tightens bands when volume is unusually low to catch turns earlier.
Paints candles, draws the active Supertrend line and optional bands, and prints clear Long and Short signal markers.
Why volume percentile
Fixed ATR multipliers assume all bars are equal. They are not. When participation spikes, price swings expand and a static band gets sliced.
Percentiles place the current bar inside a recent distribution. If volume is in the top slice, the Supertrend allows more room. If volume is in the bottom slice, it expects smaller noise and tightens.
This keeps the same playbook usable across busy sessions and sleepy ones without constant manual retuning.
How it works
Volume distribution - A rolling window computes the Pth percentile of volume. Above that is flagged as high volume. A lower reference percentile marks quiet bars.
Dynamic multiplier - Start from a Base Multiplier. If bar is high volume, scale it up by a function of volume-to-average and a Sensitivity knob. If bar is low volume, scale it down. Smooth the result with an EMA to avoid jitter.
VWMA source - The price input for bands is a short volume weighted moving average of close. Heavy prints matter more.
ATR envelope - Compute ATR on your length. UpperBasic = VWMA + Multiplier x ATR. LowerBasic = VWMA - Multiplier x ATR.
Trailing logic - The final lines trail price so they only move in a direction that preserves Supertrend behavior. This prevents sudden flips from transient pokes.
Direction and signals - Direction flips when price crosses through the relevant trailing line. SupertrendLong and SupertrendShort mark those flips. The plotted Supertrend is the active trailing side.
Inputs and what they change
Volume Lookback - Window for percentile and average. Larger window = stabler percentile, smaller = snappier.
Volume Percentile Level - Threshold that defines high volume. Example 70 means top 30 percent of recent bars are treated as high activity.
Volume Sensitivity - Gain from volume ratio to the dynamic multiplier. Higher = bands expand more when volume spikes.
VWMA Source Length - Smoothing of the volume weighted price source for the bands.
ATR Length - Standard ATR window. Larger = slower, smaller = quicker.
Base Multiplier - Core band width before volume adjustment. Think of this as your neutral volatility setting.
Multiplier Smoothing - EMA on the dynamic multiplier. Reduces back and forth changes when volume oscillates around the threshold.
Show Supertrend on chart - Toggles the active line.
Show Upper Lower Bands - Draws both sides even when inactive. Good for context.
Paint candles according to Trend - Colors bars by trend direction.
Show Long and Short Signals - Prints 𝕃 and 𝕊 markers at flips.
Colors - Choose your long and short palette.
Reading the plot
Supertrend line - Thick line that hugs price from above in downtrends and from below in uptrends. Its distance breathes with volume.
Bands - Optional upper and lower rails. Useful to see the inactive side and judge how wide the envelope is right now.
Signals - 𝕃 prints when the trend flips long. 𝕊 prints when the trend flips short.
Candle colors - Quick bias read at a glance when painting is enabled.
Typical workflows
Trend following - Use 𝕃 flips to initiate longs and ride while bars remain colored long and price respects the lower trailing line. Mirror for shorts with 𝕊 and the upper trailing line. During high volume phases the line will give more room, which helps stay in the move.
Pullback adds - In an established trend, shallow tags toward the active line after a high volume expansion can be add points. The dynamic envelope adjusts to the session so your add distance is not fixed to a stale volatility regime.
Mean reversion filter - In quiet tape the multiplier contracts and flips come earlier. If you prefer fading, watch for quick toggles around the bands when volume percentile remains low. In high volume, avoid fading into the widened line unless you have other strong reasons.
Notes on behavior
High volume bar: the percentile gate opens, volRatio > 1 powers up the multiplier through the Sensitivity lever, bands widen, fewer false flips.
Low volume bar: multiplier contracts, bands tighten, flips can happen earlier which is useful when you want to catch regime changes in quiet conditions.
Smoothing matters: both the price source (VWMA) and the multiplier are smoothed to keep structure readable while still adapting.
Quick checklist
If you see frequent chop and today feels busy: check that volume is above your percentile. Wider bands are expected. Consider letting the trend prove itself against the expanded line before acting.
If everything feels slow and you want earlier entries: percentile likely marks low volume, so bands tighten and 𝕃 or 𝕊 can appear sooner.
If you want more or fewer flips overall: adjust Base Multiplier first. If you want more reaction specifically tied to volume surges: raise Volume Sensitivity. If the envelope breathes too fast: raise Multiplier Smoothing.
What the signals mean
SupertrendLong - Direction changed from non-long to long. 𝕃 marker prints. The active line switches to support below price.
SupertrendShort - Direction changed from non-short to short. 𝕊 marker prints. The active line switches to resistance above price.
Trend color - Bars painted long or short help validate context for entries and management.
Summary
Volume Percentile Supertrend adapts the classic Supertrend to the day you are trading. Volume percentile sets the mood, sensitivity translates it into dynamic band width, and smoothing keeps it clean. The result is a single plot that aims to stay conservative when the tape is loud and act decisively when it is quiet, without you having to constantly retune settings.

Volume Profile 3D (Zeiierman)█ Overview
Volume Profile 3D (Zeiierman) is a next-generation volume profile that renders market participation as a 3D-style profile directly on your chart. Instead of flat histograms, you get a depth-aware profile with parallax, gradient transparency, and bull/bear separation, so you can see where liquidity stacked up and how it shifted during the move.
Highlights:
3D visual effect with perspective and depth shading for clarity.
Bull/Bear separation to see whether up bars or down bars created the volume.
Flexible colors and gradients that highlight where the most significant trading activity took place.
This is a state-of-the-art volume profile — visually powerful, highly flexible, and unlike anything else available.
█ How It Works
⚪ Profile Construction
The price range (from highest to lowest) is divided into a number of levels (buckets). Each bar’s volume is added to the correct level, based on its average price. This builds a map of where trading volume was concentrated.
You can choose to:
Aggregate all volume at each level, or
Split bullish vs. bearish volume , slightly offset for clarity.
This creates a clear view of which price zones matter most to the market.
⚪ 3D Effect Creation
The unique part of this indicator is how the 3D projection is built. Each volume block’s width is scaled to its relative size, then tilted with a slope factor to create a depth effect.
maxVol = bins.bu.max() + bins.be.max()
width = math.max(1, math.floor(bucketVol / maxVol * ((bar_index - start) * mult)))
slope = -(step * dev) / ((bar_index - start) * (mult/2))
factor = math.pow(math.min(1.0, math.abs(slope) / step), .5)
width → determines how far the volume extends, based on relative strength.
slope → creates the angled projection for the 3D look.
factor → adjusts perspective to make deeper areas shrink naturally.
The result is a 3D-style volume profile where large areas pop forward and smaller areas fade back, giving you immediate visual context.
█ How to Use
⚪ Support & Resistance Zones (HVNs and Value Area)
Regions where a lot of volume traded tend to act like walls:
If price approaches a high-volume area from above, it may act as support.
From below, it may act as resistance.
Traders often enter or exit near these zones because they represent strong agreement among market participants.
⚪ POC Rejections & Mean Reversions
The Point of Control (POC) is the single price level with the highest volume in the profile.
When price returns to the POC and rejects it, that’s often a signal for reversal trades.
In ranging markets, price may bounce between edges of the Value Area and revert to POC.
⚪ Breakouts via Low-Volume Zones (LVNs)
Low volume areas (gaps in the profile) offer path of least resistance:
Price often moves quickly through these thin zones when momentum builds.
Use them to spot breakouts or continuation trades.
⚪ Directional Insight
Use the bull/bear separation to see whether buyers or sellers dominated at key levels.
█ Settings
Use Active Chart – Profile updates with visible candles.
Custom Period – Fixed number of bars.
Up/Down – Adjust tilt for the 3D angle.
Left/Right – Scale width of the profile.
Aggregated – Merge bull/bear volume.
Bull/Bear Shift – Separate bullish and bearish volume.
Buckets – Number of price levels.
Choose from templates or set custom colors.
POC Gradient option makes high volume bolder, low volume lighter.
-----------------
Disclaimer
The content provided in my scripts, indicators, ideas, algorithms, and systems is for educational and informational purposes only. It does not constitute financial advice, investment recommendations, or a solicitation to buy or sell any financial instruments. I will not accept liability for any loss or damage, including without limitation any loss of profit, which may arise directly or indirectly from the use of or reliance on such information.
All investments involve risk, and the past performance of a security, industry, sector, market, financial product, trading strategy, backtest, or individual's trading does not guarantee future results or returns. Investors are fully responsible for any investment decisions they make. Such decisions should be based solely on an evaluation of their financial circumstances, investment objectives, risk tolerance, and liquidity needs.

Intraday Rising & Reversal ScannerPine Script Description: Intraday Rising & Reversal ScannerThis Pine Script is a TradingView indicator designed to identify stocks with intraday (1-hour timeframe) potential for bullish (rising) or bearish (reversal) movements. It scans for stocks based on user-defined technical criteria, including price change, relative volume, RSI, EMA, ATR, and VWAP. The script plots signals on the chart, displays a summary table, and triggers alerts when conditions are met.FeaturesBullish Signal (Rising Stocks):1H Price Change: > 1% (configurable, e.g., >2% for volatile markets).
Relative Volume: > 2.0 (volume is at least twice the 20-period average).
RSI (14): Between 50 and 70 (strong but not overbought momentum).
Price vs EMA 13: Price above the 13-period EMA (confirms short-term uptrend).
ATR (14): Current ATR above its 20-period average (indicates volatility).
VWAP: Price above VWAP (optional, shown on chart for manual confirmation).
Bearish Signal (Reversal Stocks):1H Price Change: < -1% (configurable, e.g., <-2% for stronger reversals).
Relative Volume: > 2.0 (high volume confirms selling pressure).
RSI (14): > 70 (overbought, increasing reversal likelihood).
Price vs EMA 13: Price below the 13-period EMA (confirms short-term downtrend).
ATR (14): Current ATR above its 20-period average (indicates volatility).
VWAP: Price below VWAP (optional, shown on chart for manual confirmation).
Visualization:Bullish Signal: Green triangle below the bar.
Bearish Signal: Red triangle above the bar.
VWAP: Plotted as a blue line for manual verification.
Table: Displays real-time metrics (Change %, Relative Volume, RSI, Price vs EMA, ATR, VWAP) in the top-right corner, color-coded (green for bullish, red for bearish).
Alerts:Separate alerts for bullish ("Intraday Bullish Signal") and bearish ("Intraday Bearish Signal") conditions.
Customizable alert messages include parameter values for easy tracking.
How It WorksThe script runs on the 1-hour (1H) timeframe, ensuring all calculations are based on hourly data.
Indicators are computed:Change %: Percentage price change over the last hour.
Relative Volume: Current volume divided by the 20-period SMA of volume.
RSI: 14-period Relative Strength Index.
EMA 13: 13-period Exponential Moving Average.
ATR: 14-period Average True Range, compared to its 20-period SMA.
VWAP: Volume Weighted Average Price, plotted for visual confirmation.
Signals are generated when all conditions for either bullish or bearish criteria are met.
A table summarizes key metrics, and alerts can be set up for real-time notifications.
Usage InstructionsApply the Script:Open TradingView’s Pine Editor.
Copy and paste the script.
Click "Add to Chart" and set the chart to the 1-hour (1H) timeframe.
Set Up Alerts:Right-click on the chart > "Add Alert".
Select "Intraday Bullish Signal" or "Intraday Bearish Signal" as the condition.
Configure notifications (e.g., SMS, email, or TradingView alerts).
Manual VWAP Check:VWAP is plotted as a blue line. Verify that the price is above VWAP for bullish signals or below for bearish signals using the table or chart.
To make VWAP a mandatory filter, uncomment the VWAP conditions in the bull_signal and bear_signal definitions.

MACD-V (Volume Weighted) by Arjan BakkerMACD-V (Volume-Weighted)
Uses price × volume.
Gives more weight to moves with high participation.
Filters out "noise" from low-volume bars.
Sometimes lags slightly compared to normal MACD (since volume weighting smooths the data).
Better at highlighting real shifts in momentum, because it discounts fake spikes on low volume.

DEVEL Volume Intention 0.0.2Indicator that detects the price intention based on the volume of the last 20 candles. Highlighting a candle if the volume is significantly greater than the average and plotting a rectangle if so.

Flat Breakout Detector🔹 English Description
Flat Breakout Detector is an indicator designed to highlight when the market shifts from flat, sideways trading into active movement.
Originality: Unlike standard trend or volatility tools, this script focuses on detecting abnormal volatility expansions compared to previous candles. Since around 80% of the time the market stays in flat ranges, the real opportunities often appear when price leaves consolidation. The indicator identifies these volatility anomalies, which may signal the start of a trend or a breakout.
What it does: The script measures the relative distance of price extremes from a moving average and applies a Z-score transformation. This helps traders spot volatility spikes that stand out from the prior market behavior. In simple terms: when volatility expands unusually, the indicator highlights it as a potential breakout moment.
How to use:
Ideal for traders working with consolidation/breakout patterns.
Works best as a scanner/alert system: when a signal appears, open the chart, analyze the setup, and decide whether it fits your trading strategy.
Not every signal means entry — sometimes volatility expansion happens inside the flat.
If the setup matches your strategy, place limit orders or enter at market; if not, ignore the signal and wait for the next one.
⚠️ Disclaimer: This is not a buy/sell signal generator. It only highlights moments of volatility expansion and possible breakouts. Always combine it with your own technical and volume analysis before making trading decisions.

HTF Candle Highs and Lows with Labels + High Probability Signals█ OVERVIEW
This indicator overlays Weekly, Daily, and H4 High/Low levels directly onto your chart, allowing traders to visualize key support and resistance zones from higher timeframes. It also includes high probability breakout signals that appear one candle after a confirmed breakout above or below these levels, filtered by volume and candle strength.
Use this tool to identify breakout opportunities with greater confidence and clarity.
█ FEATURES
• Plots Weekly, Daily, and H4 High and Low levels using request.security. • Customizable line colors, widths, and label sizes. • Toggle visibility for each timeframe independently. • Signals appear one candle after a confirmed breakout: • Bullish: Close above HTF High, strong candle, high volume. • Bearish: Close below HTF Low, strong candle, high volume. • Signal shapes match the color of the broken level for visual clarity.
█ HOW TO USE
1 — Enable the timeframes you want to track using the input toggles. 2 — Watch for triangle-shaped signals: • Upward triangle = Bullish breakout. • Downward triangle = Bearish breakout. 3 — Confirm the breakout: • Candle closes beyond the HTF level by at least 0.1%. • Candle body shows momentum (close > open for bullish, close < open for bearish). • Volume exceeds 20-period average. 4 — Enter trade on the candle after the signal. 5 — Use the HTF level as a reference for stop-loss placement. 6 — Combine with other indicators (e.g., RSI, EMA) for confluence.
█ LIMITATIONS
• Signals may lag by one candle due to confirmation logic. • Not optimized for low-volume assets or illiquid markets. • Best used in trending environments; avoid during consolidation. • Does not include automatic alerts (can be added manually).
█ BEST PRACTICES
• Use on H1 or higher timeframes for cleaner signals. • Avoid trading during news events or low volatility. • Backtest thoroughly before live trading. • Adjust breakout percentage and volume filter based on asset volatility. • Maintain a trading journal to track performance.

ICT SMC — OB & FVG (Enhanced v6)This indicator is a comprehensive implementation of ICT Smart Money Concepts (SMC), focusing on Order Blocks (OB) and Fair Value Gaps (FVG) with enhanced detection logic and session-based filtering.
🔍 Key Features
Impulse-Based OB Detection: Identifies bullish and bearish order blocks using configurable impulse bar logic and ATR-based movement thresholds.
Fair Value Gap Detection: Highlights FVGs based on price displacement logic, helping traders spot potential inefficiencies in price action.
Session Filtering: Allows users to filter signals based on major trading sessions (Sydney, Tokyo, London, New York).
Trend & Volume Confirmation: Integrates EMA slope, market structure breaks, and volume analysis to score trade signals.
Visual Zones: Displays OB and FVG zones using colored boxes with customizable transparency and color settings.
Signal Alerts: Generates long/short trade signals based on a scoring system and session validation, with built-in alert conditions.
⚙️ Customization
Adjustable EMA and ATR lengths
Configurable impulse bar count and movement thresholds
Toggleable session filters
Custom colors for OB and FVG zones
📈 Use Cases
This tool is ideal for traders who follow ICT concepts and want a visual, automated way to identify high-probability zones and trade setups based on smart money principles.

smc-vol ••• ahihiif bullish_pattern and showBreak
label_y = low - (high - low) * label_distance / 100
label.new(bar_index, label_y, "BULLISH↑", color=color.new(color.green, 20), textcolor=color.white, style=label.style_label_up, size=size.normal)
if bearish_pattern and showBreak
label_y = high + (high - low) * label_distance / 100
label.new(bar_index, label_y, "BEARISH↓", color=color.new(color.red, 20), textcolor=color.white, style=label.style_label_down, size=size.normal)
// Background highlight
bgcolor(bullish_pattern ? color.new(color.green, 95) : na)
bgcolor(bearish_pattern ? color.new(color.red, 95) : na)

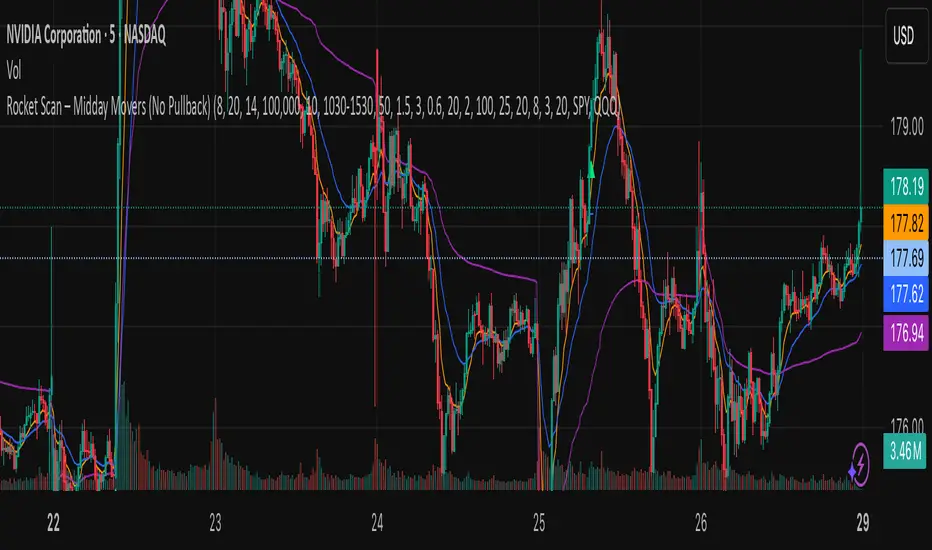
Rocket Scan – Midday Movers (No Pullback)This indicator is designed to spot intraday breakout movers that often appear after the market open — the ones that rip out of nowhere and cause FOMO if you’re late.
🔑 Core Logic
• Momentum Burst: Detects sudden price pops (ROC) with confirming relative volume.
• Squeeze → Breakout: Finds low-volatility compressions (tight Bollinger bandwidth) and flags the first breakout move.
• VWAP Reclaims: Highlights strong reversals when price reclaims VWAP on volume.
• Relative Volume (RVOL): Filters for unusual activity vs. recent averages.
• Gap Filter: Skips large overnight gappers, focuses on fresh intraday movers.
• Relative Strength: Optional filter requiring the symbol to outperform SPY (and sector ETF if chosen).
• Session Window: Default 10:30–15:30 ET to ignore noisy open action and catch true midday moves.
🎯 Use Case
• Built for traders who want early alerts on midday runners without waiting for pullbacks.
• Helps identify potential entry points before FOMO kicks in.
• Works best on liquid tickers (stocks, ETFs, crypto) with reliable intraday volume.
📊 Visuals
• Plots fast EMA, slow EMA, and VWAP for trend context.
• Paints green ▲ for long signals and red ▼ for short signals on the chart.
• Info label shows RVOL, ROC, RS filter status, and gap conditions.
🚨 Alerts
Two alert conditions included:
• Rocket: Midday LONG → Fires when bullish conditions align.
• Rocket: Midday SHORT → Fires when bearish conditions align.
⸻
⚠️ Disclaimer:
This tool is for educational and research purposes only. It is not financial advice. Trading involves risk; always do your own research or consult a licensed professional.
Effort vs Result TRFxThe Effort vs Result (EVR) indicator is designed to identify high-probability reversal signals based on volume and price action dynamics. It highlights points where the market “effort” (high volume) does not correspond to an immediate “result” (price continuation), providing actionable trade setups for both bullish and bearish scenarios.
Features:
Detects bullish EVR signals when a previous high-volume sell candle is followed by a strong bullish candle that sweeps the previous low.
Detects bearish EVR signals when a previous high-volume buy candle is followed by a strong bearish candle that sweeps the previous high.
Sticky arrows plot automatically above or below the candle, ensuring the signal moves with the price bar.
Considers inside bars, wick size, and relative volume to filter low-quality setups.
Fully compatible with multiple timeframes.
Inputs:
Volume Multiplier: Sets how much higher the current candle’s volume should be compared to the previous candle to count as high volume.
Min Wick % of Candle: Minimum wick size relative to the candle body to filter insignificant bars.
Max Inside Bars to Ignore: Number of inside bars between the previous candle and the EVR candle to ignore minor consolidations.
Usage:
(Green Arrow): Enter long when a green arrow appears below the candle. Place stop-loss slightly below the previous swing low.
(Red Arrow): Enter short when a red arrow appears above the candle. Place stop-loss slightly above the previous swing high.
Can be combined with support/resistance levels, trendlines, or other technical indicators for higher accuracy.
Benefits:
Simple and clean visual signals with tiny arrows that move with candles.
Helps traders identify high-probability reversal points based on volume and price action.
Ideal for intraday and swing trading strategies.


Breakout Volume
指标名称:Breakout Volume (BrkVol)
功能:本指标用于识别成交量异常放大,同时结合价格新高,帮助交易者发现潜在突破机会。
主要特性:
可调成交量均线周期(MA Length)
可调放量倍数(Volume Multiplier)
可调价格新高周期(Lookback High Length)
成交量柱颜色区分:绿色=阳线放量,红色=阴线放量,灰色=无信号
蓝色均量阈值线,可直观比较放量情况
出现成交量突破 + 新高时,图表上显示绿色三角形标记
支持提醒功能,可在条件触发时收到通知
使用建议:
调整参数以适应不同品种和时间周期
可结合趋势、支撑阻力位使用,避免假信号
适合快速发现短线或中长线突破机会
English Description
Name: Breakout Volume (BrkVol)
Function: This indicator detects unusual volume spikes combined with new highs in price, helping traders identify potential breakout opportunities.
Key Features:
Adjustable moving average period (MA Length) for volume
Adjustable volume multiplier (Volume Multiplier)
Adjustable lookback period for price highs (Lookback High Length)
Color-coded volume bars: Green = bullish candle with volume breakout, Red = bearish candle with volume breakout, Gray = normal volume
Blue threshold line (volume MA × multiplier) for easy comparison
Green triangle marker appears when both volume breakout and new high conditions are met
Supports alerts for real-time notifications
Usage Tips:
Adjust parameters to suit different symbols and timeframes
Combine with trend or support/resistance levels to reduce false signals
Useful for spotting short-term or medium/long-term breakout opportunities

CVD Divergences (cdikici71 x tncylyv)CVD Divergence
Summary
This indicator brings the powerful and creative divergence detection logic from @cdikici71's popular "cd_RSI_Divergence_Cx" script to the world of volume analysis.
While RSI is a fantastic momentum tool, I personally choose to rely on volume as a primary source of truth. This script was born from the desire to see how true buying and selling pressure—measured by Cumulative Volume Delta (CVD)—diverges from price action. It takes the brilliant engine built by @cdikici71 and applies it to CVD, offering a unique look into market conviction.
What is Cumulative Volume Delta (CVD)?
CVD is a running total of volume that transacted at the ask price (buying) minus volume that transacted at the bid price (selling). In simple terms, it shows whether buyers or sellers have been more aggressive over a period. A rising CVD suggests net buying pressure, while a falling CVD suggests net selling pressure.
Core Features
• Divergence Engine by @cdikici71: The script uses the exact same two powerful methods for finding divergences as the original RSI version:
o Alignment with HTF Sweep: The default, cleaner method for finding high-probability divergences.
o All: A more sensitive method that finds all possible divergences.
• Anchored CVD Periods: You can choose to reset the CVD calculation on a Daily, Weekly, or Monthly basis to analyze buying and selling pressure within specific periods. Or, you can leave it on Continuous to see the all-time flow.
• Automatic Higher Timeframe (HTF) Alignment: To remove the guesswork, the "Auto-Align HTF" option will automatically select a logical higher timeframe for divergence analysis based on your current chart (e.g., 15m chart uses 4H for divergence, 1H chart uses 1D, etc.). You can also turn this off for full manual control.
• Fully Customizable Information Table: An on-screen table keeps you updated on the divergence status. You can easily adjust its Position and Size in the settings to fit your chart layout.
• Built-in Alerts: Alerts are configured for both Bullish and Bearish divergences to notify you as soon as they occur.
How to Use This Indicator
The principle is the same as any divergence strategy, but with the conviction of volume behind it.
• 🔴 Bearish Divergence: Price makes a Higher High, but the CVD makes a Lower High or an equal high. This suggests that the buying pressure is weakening and may not be strong enough to support the new price high.
• 🟢 Bullish Divergence: Price makes a Lower Low, but the CVD makes a Higher Low or an equal low. This suggests that selling pressure is exhausting and the market may be ready for a reversal.
Always use divergence signals as a confluence with your own analysis, support/resistance levels, and market structure.
Huge Thanks and Credit
This script would not exist without the brilliant and creative work of @cdikici71. The entire divergence detection engine, the visualization style, and the core logic are based on his original masterpiece, "cd_RSI_Divergence_Cx". I have simply adapted his framework to a different data source.
If you find this indicator useful, please go and show your support for his original work!
________________________________________
Disclaimer: This is a tool for analysis, not a financial advice signal service. Please use it responsibly as part of a complete trading strategy.

BAB VWAP V2 Daily, Weekly & Monthly (Optimized)Overview
BAB VWAP V2 displays 3 automatically anchored VWAPs (Daily, Weekly, Monthly) plus 2 customizable intraday VWAPs (anchored at user-defined HH:MM). Optional ±σ bands (volume-weighted) for D/W/M. Includes dynamic labels and an optional summary table.
Main Features
Daily/Weekly/Monthly VWAPs with automatic reset per period.
2 Intraday anchored VWAPs (default 09:00 & 15:30, configurable).
Volume-weighted standard deviation bands (σ) for D/W/M with optional fill.
Alerts on VWAP D/W/M crossovers.
Labels dynamically updated (no stacking) + optional table (2×4) with key values.
Parameters
Display: toggle D/W/M VWAPs, labels, table.
Colors & Style: line colors, thickness, style.
Bands (σ): enable per period, set multiplier, toggle fill.
Intraday (Anchored): enable VWAP 1 & 2, choose hour/minute, set colors & thickness.
How to Use
Add the indicator to a clean chart.
Enable desired VWAPs (D/W/M and/or intraday).
Optionally enable σ bands to contextualize price deviation from VWAP.
Configure intraday VWAP anchors to match your market session (e.g., RTH, EU open, etc.).
Alerts
Price crossing over/under Daily, Weekly, Monthly VWAPs.
Configure alerts from the Alerts panel.
Best Practices
Publish chart screenshots without other indicators for clarity.
Adjust intraday anchor times according to your instrument’s trading session (pre-/post-market handling may vary).
Limitations
Intraday VWAPs are calculated in 1-minute resolution via request.security to remain consistent across all timeframes.
Intraday σ bands are not included by default (can be added in a later version).
Changelog
V2: Performance refactor, non-mutable labels, fixed fill() usage, added 2 intraday VWAPs with time selectors, stabilized table.
V1: Basic D/W/M VWAPs + alerts.
Disclaimer
This script is for educational and informational purposes only. It does not constitute financial advice. You are solely responsible for your trading decisions.
Credits & License
© BAB Trading. Pine Script® — TradingView.
Open-source under the Mozilla Public License (MPL 2.0) by default (or specify your own license in the script header if different).

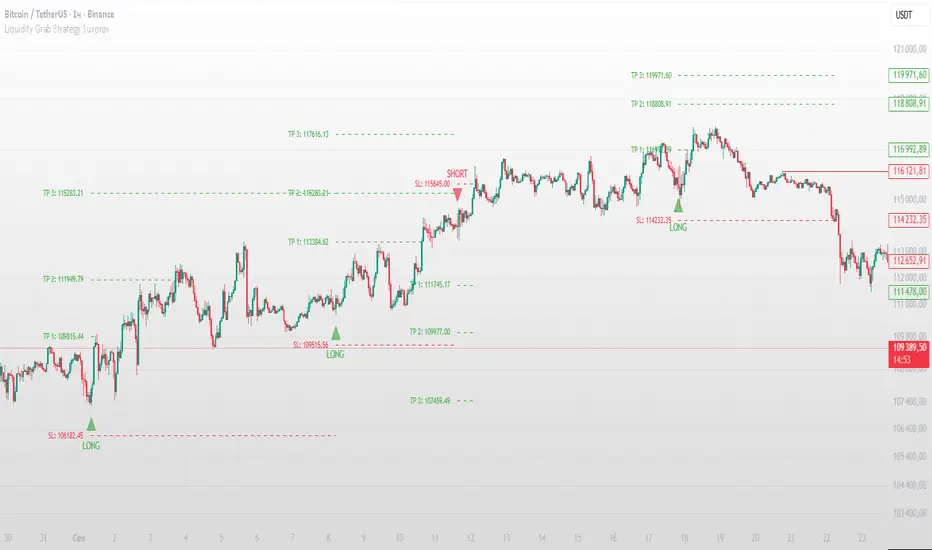
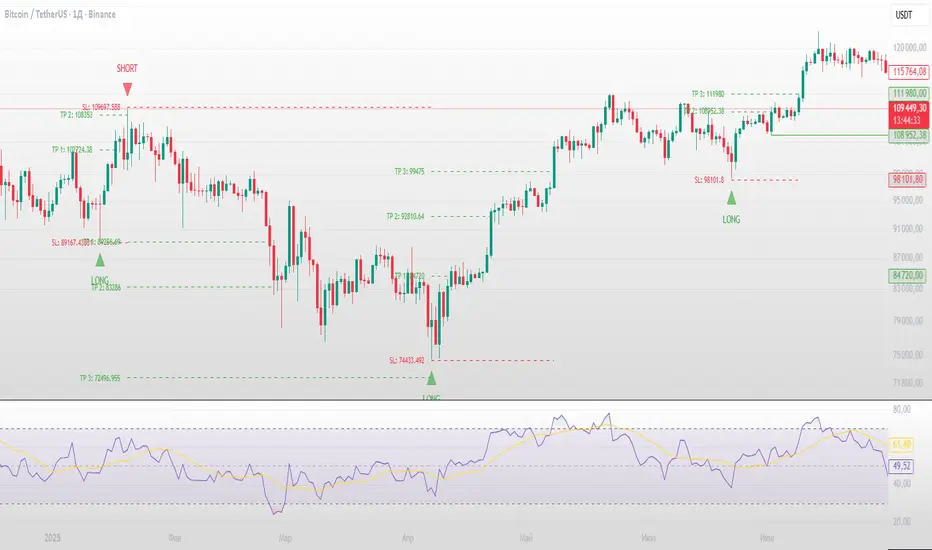
Liquidity Grab Strategy SuvorovLiquidity grab strategy
Description:
This indicator is built around the Liquidity Grab Strategy, which identifies and reacts to stop hunts and false breakouts at key swing highs and lows. It detects where liquidity is likely to be resting (e.g., above highs or below lows) and provides trade signals when that liquidity is taken and price begins to reverse.
Core Features:
Liquidity Detection: Automatically identifies and marks key swing highs and lows where stop-losses are likely to accumulate.
Entry Signals: Generates BUY/SELL signals after a liquidity sweep and a confirmed reversal — based on price action, volume, or structure shifts.
Stop Loss & Take Profit Zones: Visualizes stop-loss just beyond the liquidity wick and take-profit near the next major structure point, with configurable Risk/Reward ratios.
False Signal Filters: Optional filters based on volume spikes, RSI divergence, or market structure confirmation.
Multi-Timeframe Logic: Supports separate timeframes for structure detection and signal confirmation (e.g., structure on 1H, entry on 5m).
Swing Failure Pattern SuvorovIndicator: Logic-based Swing Failure Pattern (SFP)
What is the logic of my indicator based on and what makes it unique:
1. The indicator can calculate extreme candles that close with huge shadows and a small body and it works on any timeframe.
2. The indicator analyzes the volumes on which the desired bar was closed. This function is customizable. That is, you can build a search for signals according to your trading strategy, based on the number of volumes. What does this mean - you select the number of previous bars where the indicator calculates the average value and based on these numbers, you can set up: how many times the desired candle should be larger than the previous average volume.
3. Since SFP is based on the removal of important liquidity, the search for such situations occurs from swing structures (swing high/low). When these parameters are found on the chart (on history), the indicator draws the situation and shows where important liquidity was removed and why the trading situation appeared right now.
4. The indicator gives recommendations on possible takes and stops.
The structure of takes has a built-in logic for searching for previous swings to remove liquidity, as well as searching for imbalances to cover them (50 and 100%).
5. For TP (Take Profit): there are 3 TPthat can be adjusted to your trading strategy (Risk/Profit). For example: you always trade from 2 to 1 on the 1st Take, 3 to 1 on the second, 5 to 1 on the third: you can set all this in the indicator and all your targets will be detected by the indicator, taking into account the logic of searching for important ranges. If, for example, in your 3 to 1 range there are no important zones for TP, then the indicator writes that NaN (not found).
6. The indicator works on any timeframe.
7. The indicator has a built-in RSI logic, which comes as an additional function to the indicator. If this function is enabled, then trading situations are detected only when there is a divergence (from the swing point to the extreme bar that has formed).
KSM CVDThis Indicator displays Divergences between Price chart candles and delta strength candles. Visually changes the candle colour to show the Exhaustion & Absorption that occurs.

VMS Momentum Trend Matrix Indicator [09.15 to 15.30]VMS Momentum Trend Matrix Indicator - Detailed Explanation
🎯 Overview & Core Philosophy
This is a multi-dimensional trading and a multi-confirmation system that combines 4 independent analytical approaches into one unified framework. The indicator operates on the principle of "consensus trading" - where signals are only considered reliable when multiple systems confirm each other. The system is designed for 9:15 AM to 3:30 PM trading sessions (Indian Market) with dynamic support/resistance levels.
Five Pillars of Analysis:
1. Trend Matrix – Multiple indicator voting system
2. Momentum Suite – Multiple Hybrid oscillator
3. Volume Analysis - Buy/sell pressure quantification
4. Key Level Identification - Dynamic support/resistance
5. EMA Trend: Indicates the overall long-term direction.
📊 DASHBOARD INTERPRETATION - ROW BY ROW
ROW 1: Indicator Name and Cell background colour changes with Trend Matrix
ROW 2: EMA ANALYSIS (It analyses independently and does not combine this analysis with the Combined Analysis and Trading View. Background Colour on price chart is based on this)
Purpose: Long-term trend identification using Exponential Moving Averages
What to Watch:
• Major Trend: Overall market direction (Bullish/Bearish/Neutral)
• Bullish Condition: All EMAs aligned upward
• Bearish Condition: All EMAs aligned downward
• Neutral: Mixed alignment
Trading Significance:
• Trading Condition: Current bias based on EMA alignment
• Bullish Market: Focus on LONG positions only
• Bearish Market: Focus on SHORT positions only
• Neutral Market: Wait for clearer direction
ROW 3-4: KEY LEVELS
Purpose: Dynamic support and resistance identification
Levels to Monitor:
• VMS Line-1 (Support): Dynamic Support for long positions
• VMS Line-2 (Resistance): Dynamic Resistance for short positions
• Up/Down: Daily base levels from opening price calculations
• Up: Daily support level based on opening price
• Down: Daily resistance level based on opening price
How Levels Work:
• Wait for Line-1 and 2 Crossing
• In the Upward movement, Line-1 will move with the price, and Line-2 will be moved as a straight line
• In the Downward movement, Line-2 will move with the price, and Line-2 will be moved as a straight line
• Provide clear entry/exit points
• If the price is between these levels, it is mostly a sideways market. After the Upward movement, if the price crosses Line-1 and other bearish conditions are supported, a short position can be taken. And in the Downward movement, it is the reverse condition.
• If the price is above the up level, it can be considered as bullish and below as bearish
ROW 5-6: VOLUME ANALYSIS
Purpose: Measure buying vs selling pressure
Key Metrics:
• Total Buy Volume: Cumulative buying pressure
• Total Sell Volume: Cumulative selling pressure
• Bullish Candles: Number of up-candles in session
• Bearish Candles: Number of down-candles in session
Interpretation:
• Buy Volume > Sell Volume: Bullish sentiment
• Sell Volume > Buy Volume: Bearish sentiment
• Bullish Candles Dominating: Upward momentum
• Bearish Candles Dominating: Downward momentum
ROW 7-8: MOMENTUM SUITE (Background colour of Oscillator is based on this)
Purpose: Short-term momentum strength and direction
Critical Components:
• Direction: Current momentum (BULLISH/BEARISH)
• Strength: 0-100% strength measurement
• Bullish Height: Positive momentum magnitude
• Bearish Height: Negative momentum magnitude
Strength Classification:
• 80-100%: Very Strong - High conviction trades
• 60-80%: Strong - Good trading opportunities
• 40-60%: Moderate - Caution advised
• 20-40%: Weak - Avoid trading
• 0-20%: Very Weak - No trade zone
ROW 9-11: TREND MATRIX
Purpose: Consensus from Multiple technical indicators
Matrix Scoring:
• Bullish Signals: Number voting UP
• Bearish Signals: Number voting DOWN
• Neutral Signals: Non-committed indicators
• Net Score: Bullish - Bearish signals
Trend Classification:
• Strong Uptrend: Net Score ≥ +5
• Uptrend: Net Score +1 to +4
• Neutral: Net Score = 0
• Downtrend: Net Score -1 to -4
• Strong Downtrend: Net Score ≤ -5
ROW 12: COMBINED ANALYSIS
Purpose: Final integrated signal from all systems
Bias Levels:
• STRONG BULLISH: All systems aligned upward
• BULLISH: Majority systems upward
• NEUTRAL: Mixed or weak signals
• BEARISH: Majority systems downward
• STRONG BEARISH: All systems aligned downward
Confidence Score: 0-100% reliability measurement
ROW 13: TRADING VIEW
Purpose: Clear action recommendations
Possible Actions:
• STRONG LONG: High conviction buy signal
• MODERATE LONG: Medium conviction buy signal
• WAIT FOR CONFIRMATION: No clear signal
• MODERATE SHORT: Medium conviction sell signal
• STRONG SHORT: High conviction sell signal
🎯 COMPLETE TRADING RULES
BUY ENTRY CONDITIONS (All Must Be True)
Primary Conditions:
1. Combined Bias: BULLISH or STRONG BULLISH
2. Trading Action: MODERATE LONG or STRONG LONG
3. Momentum Strength: ≥ 40% (≥60% for STRONG LONG)
4. Trend Matrix: Net Score ≥ +3
5. 6-EMA Trend: Bullish or Neutral
Confirmation Conditions:
6. Price Position: Above VMS Line-1 AND Base Up
7. Volume Confirmation: Buy Volume > Sell Volume
8. Bullish Candles: More bullish than bearish candles
Risk Management:
9. Stop Loss: Below VMS Line-1 OR Base Down (whichever is lower)
10. Position Size: Based on confidence score (higher score = larger position)
11. Take Profit: When Combined Bias turns "NEUTRAL" or momentum strength drops below 20%
12. Exit Signal: Trading Action shows "WAIT FOR CONFIRMATION"
SELL/SHORT ENTRY CONDITIONS (All Must Be True)
Primary Conditions:
1. Combined Bias: BEARISH or STRONG BEARISH
2. Trading Action: MODERATE SHORT or STRONG SHORT
3. Momentum Strength: ≥ 40% (≥60% for STRONG SHORT)
4. Bearish Signals: ≥ 12 in Trend Matrix
5. Trend Matrix: Net Score ≤ -3
6. EMA Trend: Bearish or Neutral
Confirmation Conditions:
6. Price Position: Below VMS Line-2 AND Base Down
7. Volume Confirmation: Sell Volume > Buy Volume
8. Bearish Candles: More bearish than bullish candles
Risk Management:
9. Stop Loss: Above VMS Line-2 OR Base Up (whichever is higher)
10. Position Size: Based on confidence score
11. Take Profit: When Combined Bias turns "NEUTRAL" or momentum strength drops below 20%
12. Exit Signal: Trading Action shows "WAIT FOR CONFIRMATION"
⏰ ENTRY/EXIT TIMING
Best Entry Times:
• 9:30-10:00 AM: Early session momentum established
• 11:00-11:30 AM: Mid-session confirmation
• 1:30-2:00 PM: Afternoon momentum shifts
Avoid Trading:
• First 15 minutes: Excessive volatility
• 12:00-1:00 PM: Low liquidity period
• After 3:00 PM: Session closing volatility
Exit Triggers:
Profit Taking:
• Target 1: 1:1 Risk-Reward (exit 50% position)
• Target 2: 1.5:1 Risk-Reward (exit remaining 50%)
• Trailing Stop: Move stop to breakeven after Target 1
Stop Loss Triggers:
• Price crosses opposite VMS line
• Combined Bias changes to NEUTRAL
• Momentum Strength drops below 20%
• Volume confirmation reverses
•
Emergency Exit:
• Trend Matrix Net Score reverses direction
• 6-EMA trend changes direction
• Key support/resistance breaks against position
📈 TRADING SCENARIOS
Scenario 1: STRONG BULLISH SETUP
- Combined Bias: STRONG BULLISH
- Trading Action: STRONG LONG
- Momentum Strength: 75%
- Trend Matrix: Net Score +8
- Price: Above VMS Line-1 and Base Up
- Volume: Strong buy volume dominance
ACTION: Enter LONG with full position size
STOP LOSS: Below VMS Line-1
TARGET: 1.5:1 Risk-Reward ratio
Scenario 2: MODERATE BEARISH SETUP
- Combined Bias: BEARISH
- Trading Action: MODERATE SHORT
- Momentum Strength: 55%
- Trend Matrix: Net Score -4
- Price: Below VMS Line-2 but above Base Down
- Volume: Moderate sell volume dominance
ACTION: Enter SHORT with half position size
STOP LOSS: Above VMS Line-2
TARGET: 1:1 Risk-Reward ratio
Scenario 3: NEUTRAL/WAIT SETUP
- Combined Bias: NEUTRAL
- Trading Action: WAIT FOR CONFIRMATION
- Momentum Strength: 35%
- Trend Matrix: Net Score 0
- Mixed volume signals
ACTION: NO TRADE - Wait for clearer signals
________________________________________
⚠️ RISK MANAGEMENT RULES
Position Sizing:
• STRONG Signals (80-100% confidence): 100% normal position
• MODERATE Signals (60-79% confidence): 50-75% position
• WEAK Signals (40-59% confidence): 25% position or avoid
• VERY WEAK (<40% confidence): NO TRADE
Daily Loss Limits:
• Maximum 2% capital loss per day
• Maximum 3 consecutive losing trades
• Stop trading after the daily limit is reached
Trade Management:
• Never move the stop loss against a position
• Take partial profits at predetermined levels
• Never average down losing positions
• Respect all exit signals immediately
________________________________________
🔄 SIGNAL CONFIRMATION PROCESS
Step 1: Trend Direction
Check EMA alignment and Combined Bias
Step 2: Momentum Strength
Verify Momentum Strength ≥ 40% and direction matches trend
Step 3: Volume Confirmation
Confirm volume supports the direction
Step 4: Matrix Consensus
Ensure Trend Matrix agrees (Net Score ≥ |3|)
Step 5: Price Position
Verify price is on the correct side of key levels
Step 6: Entry Execution
Enter on a pullback to support/resistance with a stop loss
________________________________________
This system works best when you wait for all conditions to align. Patience is key - only trade when all systems confirm the same direction with adequate strength. The multiple confirmation layers significantly increase the probability of success but reduce trading frequency.

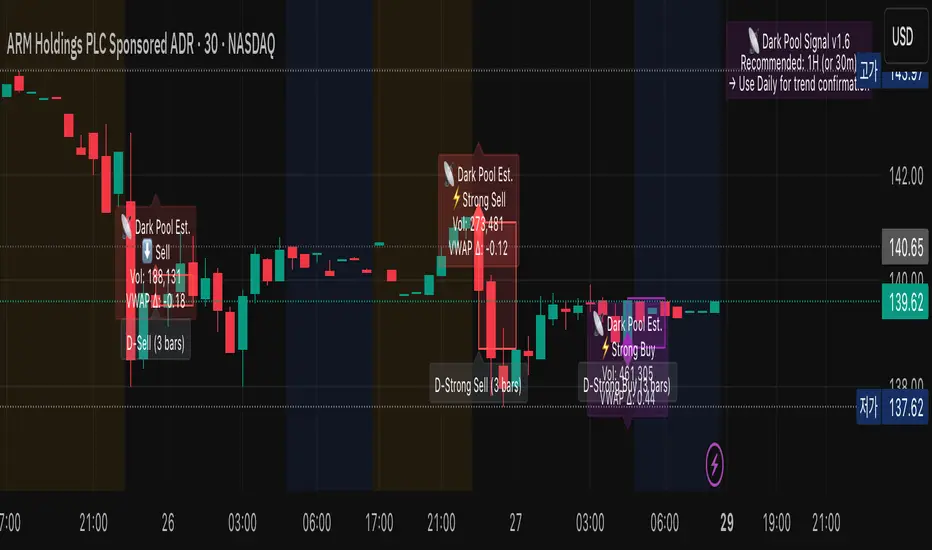
Dark Pool Estimate Signal TrackerDark Pool Estimate Signal — Detect Potential Institutional Activity
Overview
The Dark Pool Signal v1.6 indicator is designed to detect unusual trading activity near VWAP zones, which can be associated with institutional dark pool transactions. By combining volume spikes, VWAP proximity, and optional trend filters, it provides clear visual cues of potential hidden accumulation or distribution zones.
Disclaimer: This script is for informational and educational purposes only. It does not constitute financial advice. All trading involves risk. Past performance is not indicative of future results.
🔍 Core Logic
This indicator identifies potential off-exchange activity by analyzing three key factors:
Unusual Volume Spikes: Highlights bars where the current volume significantly exceeds its moving average by a user-defined multiplier.
VWAP Proximity: Triggers when the price stays within a volatility-adjusted range (ATR-based) of the VWAP, a common characteristic of algorithmic execution.
Trend Confirmation: An optional EMA filter helps align signals with the broader market direction.
Accumulation Detection: Counts repeated signals within a lookback period to identify persistent institutional buying or selling pressure.
The result is a set of visual and alert signals indicating possible institutional footprints.
🧩 Features
Dynamic VWAP Range (ATR-based): Automatically adjusts VWAP proximity sensitivity based on current market volatility.
Multi-tiered Signal Strength: Differentiates between Normal, Strong, and Accumulated signals to visualize the intensity of activity.
Non-Repainting Confirmation: Signals are confirmed only on bar close to ensure they do not repaint.
Language Support: Dual-language display (English / Korean).
Customizable Visualization: Easily adjust label size, color transparency, offset, and the duration of highlighted zones.
Smart Alert System (v1.6): Provides comprehensive alert() and alertcondition() calls for real-time push notifications.
Recommended Timeframe Notice (v1.6): Displays a small on-chart note suggesting optimal timeframes for analysis.
🕒 Recommended Timeframes
Type Recommended Use Description
1-Hour (default) Primary Analysis Offers a good balance between signal clarity and noise reduction. Ideal for most equities and ETFs.
30-Minute Short-term Confirmation Useful for intraday analysis and refining entry/exit points.
Daily Macro View Helps identify long-term institutional positioning and potential trend reversal zones.
< 15-Minute Experimental May generate excessive noise due to market micro-volatility. Not recommended for primary analysis.
💡 Tip: Combine 1H detection with Daily chart confirmation for a more robust, dual-layer view of institutional flow.
📊 Visualization
Purple Diamonds: Strong or Normal Buy signals
Red Diamonds: Strong or Normal Sell signals
Translucent Boxes: Highlight the estimated duration of dark pool activity.
Optional Labels: Display volume, VWAP delta, and signal strength for detailed analysis.
All visual components can be toggled on or off in the settings.
⚙️ Alert System
Create alerts for each specific signal type directly from the chart's alert menu or your script settings.
⚡ Strong Buy/Sell
📡 Accumulated Buy/Sell
⬆️ Normal Buy/Sell
➖ Neutral Activity (Volume spike near VWAP without clear direction)
Set alert frequency to Once Per Bar Close for confirmed, non-repainting signals.
🧭 How to Use
Add the indicator to your chart.
Select your preferred language and timeframe.
Customize visualization and alert settings to your preference.
Observe how the combination of volume + VWAP + trend reveals potential accumulation or distribution zones.
Use alerts to monitor for significant institutional activity in real-time.
🧠 Important Notes
This indicator is non-repainting. Signals are confirmed at the close of each bar.
It is intended for analytical and educational use, not as a direct trading system.
It works across equities, ETFs, and crypto, but volume data reliability can vary by exchange. Always confirm signals with your own strategy and risk management.