Abacus (CMF + Stoch. + Chop.) StrategyThis strategy combines uses Chaikin Money Flow, Stochastic Oscillator, and the Choppiness Index to determine trend strength and direction and generate entry and exit signals. This is a strategy adaptation of our earlier CMF + Stoch + Choppiness Index indicator.
Volume

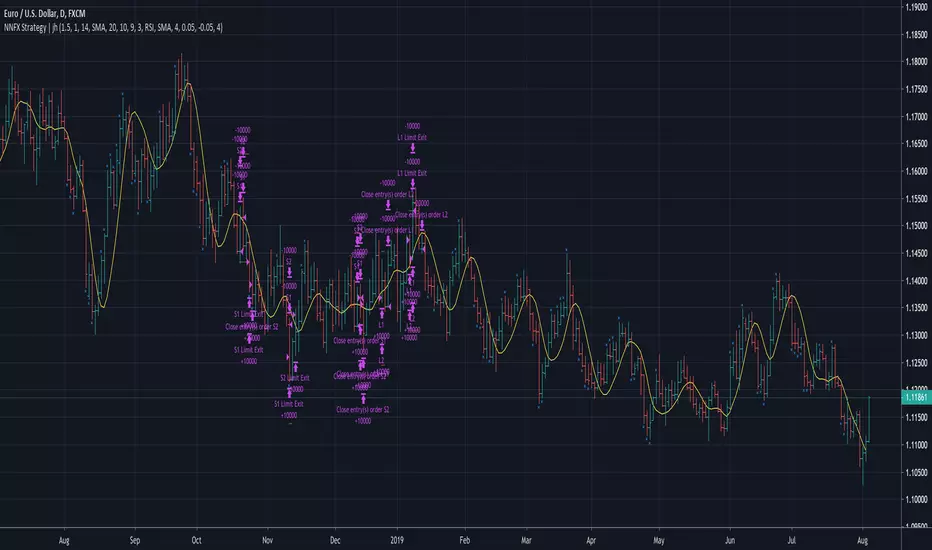
No Nonsense NNFX VP Strategy for Back Testing | jhMy first script, be kind :)
Most of the rules are implemented:
- Money management
- ATR, Baseline, Confirmation, Volume, Exit
More details below.
//////////////////////////////////////////////////////////////////////////////////////////////////////////////////////////////////
//////////////////////////////////////////////////////////////////////////////////////////////////////////////////////////////////
//Designed per No Nonsense Forex VP rules
//Made to be as modular as possible, so we can swap the indicators in and out.
//Originated from causecelebre
//Tried to put in as much VP rules as possible
///////////////////////////////////////////////////
//Rules Implemented:
///////////////////////////////////////////////////
// - SL 1.5 x ATR
// - TP 1 x ATR
//
// - Entry conditions
//// - Entry within 1 candles of baseline + 1 x confirmation + volume
//// - Entry only if baseline is < 1 x ATR
// - Exit conditions
//// - Exit on exit indicator or when baseline or confirmation flip
///////////////////////////////////////////////////
//Trades entries
///////////////////////////////////////////////////
// - First entry L1 or S1 with standard SL and TP
// - Second entry L2 or S2 with standard SL and exit upon the exit conditions
///////////////////////////////////////////////////
//Included Indicators and settings
///////////////////////////////////////////////////
// - Baseline = HMA 20
// - Confirmtion = SSL 10
// - Volume = TDFI 4
// - Exit = RVI 4
///////////////////////////////////////////////////
//Credits
// Strategy causecelebre
// TDFI causecelebre
// SSL Channel ErwinBeckers
//////////////////////////////////////////////////////////////////////////////////////////////////////////////////////////////////
//////////////////////////////////////////////////////////////////////////////////////////////////////////////////////////////////

MH1) There is no "security (tickerid, 'D', close)", which has "Blue Sky day 90%", "Vdub" and etc
2) The tested values which you can see below were without "Pyramiding"
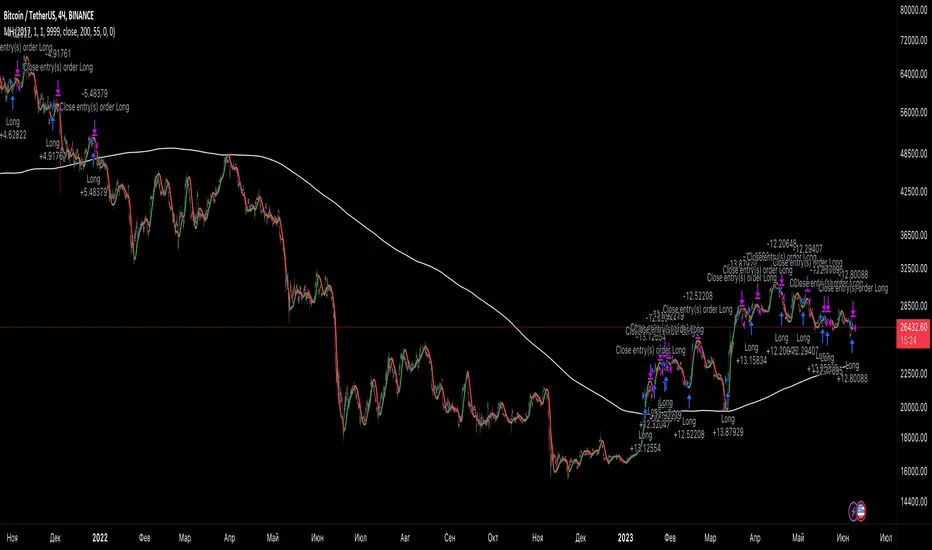

Quad Moving Avgerages BackTestHello Fellow Traders!
-------------------------------------------
This is the newest addition to Gnome Alerts PRO!
Trade Moving Average Breakouts with Minimal Drawdon.
This Bot Script works on all Crypto, Leverage, Forex, & Traditional Exchanges.
FEATURES
------------------------
*Autoview Ready*
- Easy to Use
- Backtesting Included
-Take Profit
- Stop Loss
You can get access to any of my scripts by visiting my Website, link is in Tradingview Bio ... Just click on the Gnome!

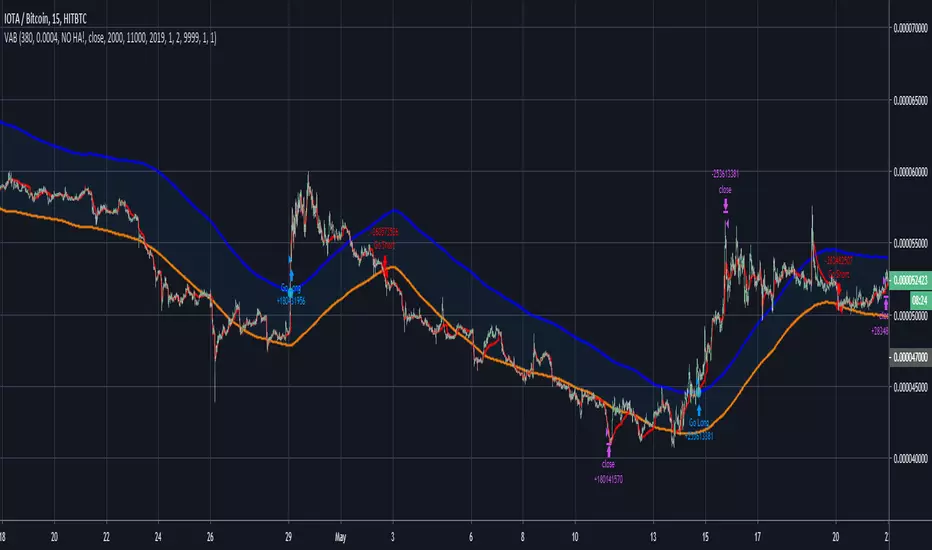
[XC] Adaptive strategy with volume bandsFirst much thanks to alexgrover for his rich source of unbelievable indicators
The list below shows as an example some might profitable strategy settings.
But like every new strategy only a long term test can tell you if it works.
//Curency - - src Time stategy Length C. Factor Smoothed SL TP Profit Factor (with no Commission)
//---------------------------------------------------------------------------------------------------------------------------------
//BTCUSD NOHA close 15min 1 240 10 yes 3000 25000 4.2 (June 2019)
//XBTUSD NOHA close 15min 1 310 0.00006 no 1000 11000 2.3 (June 2019)
//IOTABTC NOHA close 15min 1 380 0.0004 no 2000 11000 10.6 (June 2019)
Rock1) There is no "security (tickerid, 'D', close)", which has "Blue Sky day 90%", "Vdub" and etc
2) The tested values which you can see below were without "Pyramiding"

E21) There is no "security (tickerid, 'D', close)", which has "Blue Sky day 90%", "Vdub" and etc
2) The tested values which you can see below were without "Pyramiding"
Yaonology SPY StrategyOnly use this strategy in the US stock market. Especially use in SPY.
www.yaonology.com

CR Plain True Sight V1.0Plain True Sight tries to go with the trend patiently.
For the next gen of True Sight, see:
It doesn't mean that the MTF True Sight (next gen) is better, it just depends on your use-case.

CR MTF True Sight V1.0MTF True Sight is the next generation of my Plain True Sight strategy. While Plain True Sight is more patient, MTF is designed to respond with more agility.

CryptoRaven SRS V1.0Designed To be as safe as possible, but also get the most of a trend.
Initial capital: 10K from 1 Jan 2018


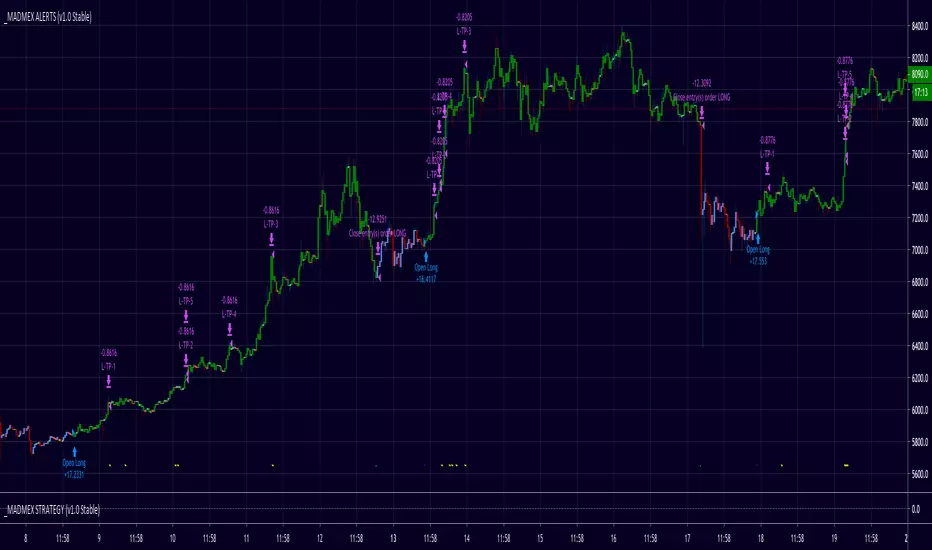
MADMEX XBTUSDBitmex BITMEX:XBTUSD Trading System with multiple ATR/Volatility-based Take-Profit Exits
B@K@StrategyB@K@Strategy
No repaint
Buying/selling Rules:
Exponential moving average and Macd must cross up/ down .
. Stop Loss
. Trailing Stop Loss
. Take Profit
. Trailing Take Profit


PpSignal Wyckoff Wave Strategybased on wyckoff market analysis wave, we did the indicator and now the strategy.
for more information visit this link
stockcharts.com

Bitmex Money Maker For Micro Time Frames & Day Trader's Hey y’all,
Today i am making on of my profitable trading strategy public,
i have seen people struggling with trading , its not so hard if u have a plan and strictly follow it .
i would love to hear your feed back & what can be improved
Thank you very much for Stopping By !
Take care! (^_^)
Regard's ,
WhaleHulk
for more info message me : @whalehulk on Telegram

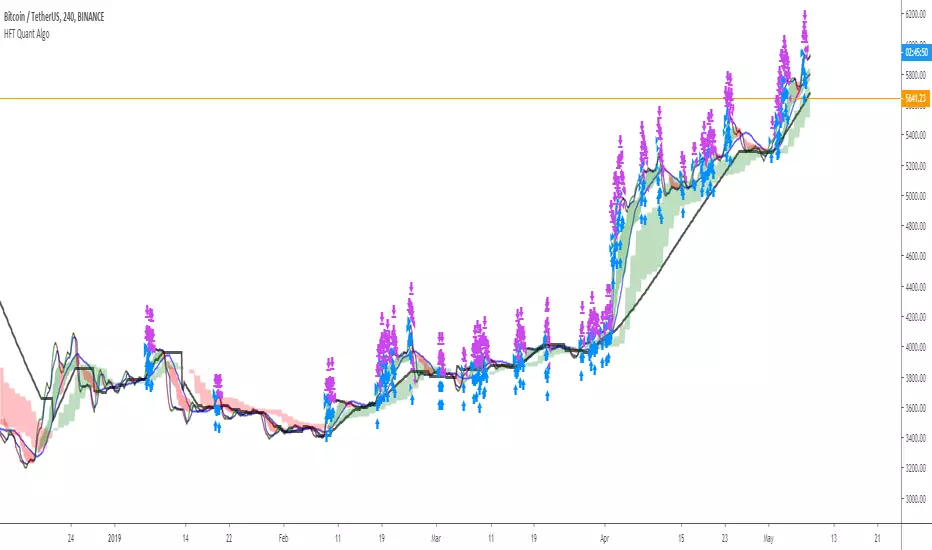
HFT Quant AlgoPrivate Fund Algo - HFT/Quant Approach Beta I
2019 Performance
1/Jan/2019 ~ 8/May/2019
Included:
Commission 0.1%
Slippage 100 ticks
CRYPTOCOINFOX-EOS-USDT 30 MIN STRATEGY BINANCEIN THIS STRATEGY JUST USE THE SAME COIN IN THE SAME TIME FRAME IN THE SAME EXCHANGER EXACTLY LIKE TITLE
COIN : EOS/USDT
TIME FRAME : 30 MIN
EXCHANGER : BINANCE

The Rocket : Profit Factor [Bradford_Fournier]The Rocket
I hope this helps you as much as it has me.
Suggestions:
Use with tech stocks with reasonably high volatility
Time-frames are flexible but a 1-3month window is best.
REQUEST: If you find this useful, please let me know. I'd like to improve this script further. Any suggestions or encouragement are greatly appreciated
The rocket is based on my Trend Shift Indicator. Please take a look if you haven't yet.
