Noro's BitFinex Long/Shorts Strategy v1.0The lime line - long positions at the BitFinex.com exchange.
The red line - short positions at the BitFinex.com exchange.
Strategy
If long positions it is more than short positions - to open long position.
And vice versa. If short it is more than long - to close long position.
You can change a symbol in settings.
Volume

VB Strategy
VB Indicator
VB Indicator PRO (with Alarm function)
With this strategy, you can test VB indicator.
This strategy use entry and close price
entry price = (high price + low price) / 2
close price = (high price + low price) / 2
이 전략으로 VB 지표에 대해 테스트할 수 있습니다.
이 전략의 진입가와 청산가는 아래와 같이 설정합니다.
진입가 = (고점+저점) / 2
청산가 = (고점+저점) / 2

The Ultimate TripleX Trading StrategyThe strategy is now set to wor with the 15 Minutes timeframe, but you can adjust it to work with any timeframe.

TTS Patterns Strategy - Market (By Ken)This TTS was modified to entry at market order but still 2 time risk reward ratio from the entry

Power Penguin - Trend Trading Script BacktesterPower Penguin is a script that detects a trend and determines entry into the market based on the strength and price action.
Thanks to all my early backers for believing in my work!
This script is optimal for use in any market at this time.
To request a trial for this script, please PM me.
-----------------
Power Penguin V1.0.0
- Initial release

Price-Volume by ClefsphereVolume is a key piece of the puzzle when analyzing stock performance!
Price-Volume script measures Buying Pressure and Selling Pressure and creates Bullish signals based on that information.
A trailing stop can be specified. Of course the dilemma of stops is that adjusting to tighter stop may result in more stop outs, less profits. Whereas, looser stop may result in larger drawdowns, larger profits.
Coded as a strategy so it can be back-tested.
Long signal is show in green at the bottom and is also shown in Strategy signals.
Coded with latest PineScript version 3. Get This Indicator Today! marketcast.wordpress.com
Thanks for your interest and support!
Disclaimer: This information is not trading advice and is for educational purposes only. Trade at your own risk. Past performance is not a guarantee of future results.

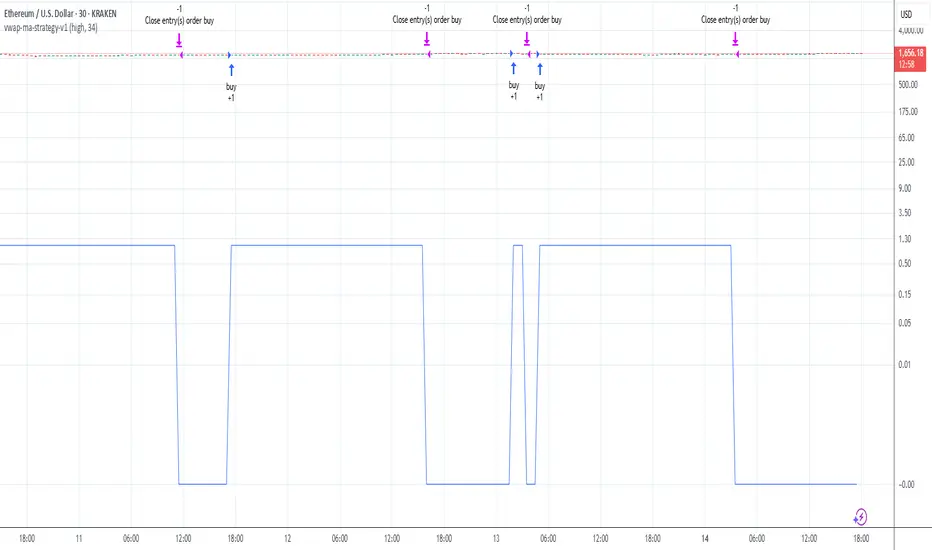
vwap-ma-strategy-v0.7This strategy was inspired by my Israeli fellow iAtiya.
I love it because it's my first pine v3 script that actually works.
Powerful with respect to it's simplicity.
Scalping with Heikin Ashi candle pattern for BTCUSDThis strategy is based on a trading idea that works for me on crypto markets. I use this trading strategy manually from a couple of weeks.
It is based on 1 minute timeframe and heikin ashi candles.
Basically, the strategy places two pending orders in a certain moment of the market and scalp as many pips as possible. Then suddenly it exits before price correction.
The scope of this script is to back test the strategy on a larger period but due to trading view limitation it has to be done modifing the backtesting period manually.
If some of you want to test, please write in comment section.
Please use comment section for any feedback.
Next improvment (only to whom is interested to this script and follows me): study with alerts. Leave a comment if you want to have access to study.

Series of Heikin ashi candle strategySeries of Heikin ashi candle strategy, idea and rules:
After 2 consecutive heikin ashi candles of same color, place a buy stop order at high of last candle if green or a sell stop order at low of last candle if red.
Strategy follows the open order with trailing stop.
Use on charts with heikin ashi candles.
Good on lower timeframes and scalping.
Please use comment section for any feedback.
Next improvment (only to who is interested to this script and follows me): study with alerts. Leave a comment if you want to have access to study.
Market Facilitation Index (MFI) Backtest The Market Facilitation Index is an indicator that relates price range to
volume and measures the efficency of price movement. Use the indicator to
determine if the market is trending. If the Market Facilitation Index increased,
then the market is facilitating trade and is more efficient, implying that the
market is trending. If the Market Facilitation Index decreased, then the market
is becoming less efficient, which may indicate a trading range is developing that
may be a trend reversal.
You can change long to short in the Input Settings
WARNING:
- For purpose educate only
- This script to change bars colors.


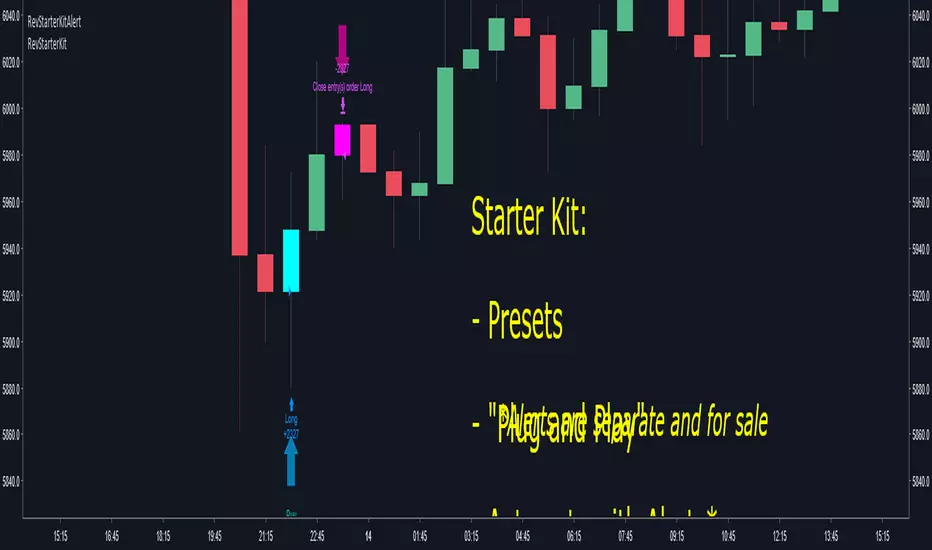
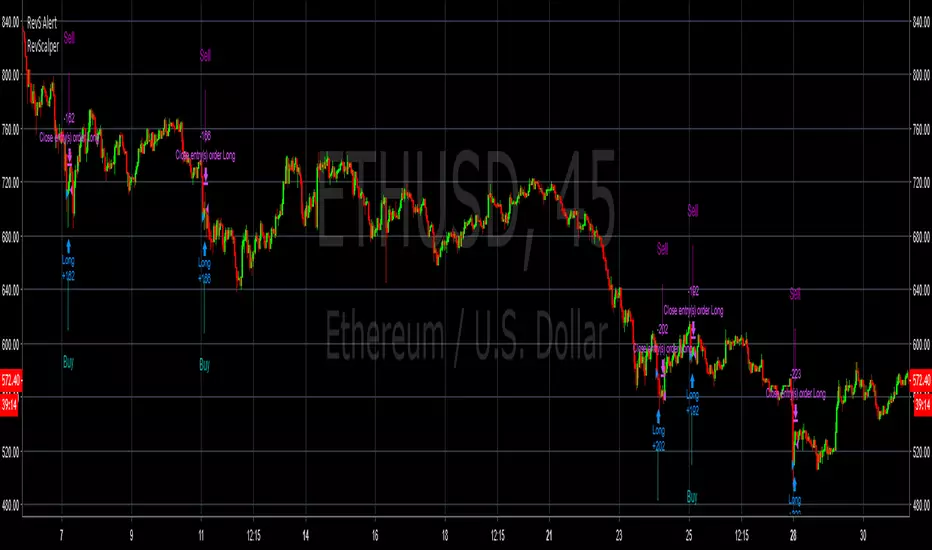
Crypto Reversal Scalper STARTER KIT BacktesterThis is a starter kit for people to try out.
Since many people were confused to how to properly config the original script, I decided to create this script.
This script uses the original script but is compiled to have presets.
Simple to use, EASY AS 1,2,3
1. Choose PAIR
2. Sync chart with chosen pair (Symbol and Timeframe)
3. DONE!
4. (Optional) Adjust Stoploss and Takeprofit
This will be FREE for people to consider giving it a try.
To automate the trades, you will need to have the alerts for the script.
If you want to automate the trades, PM me.
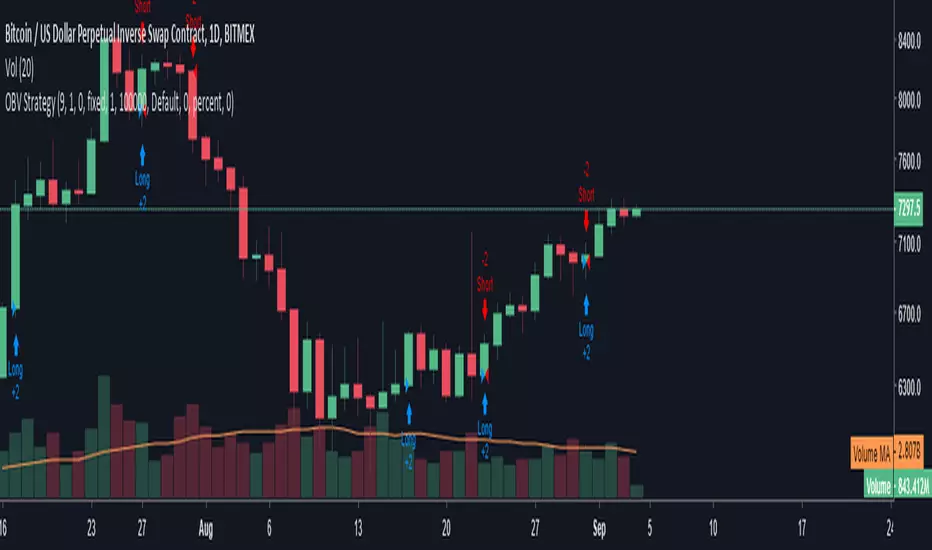
OBV StrategyA simple strategy to give buy/sell signals based on OBV and EMA crossover/crossunder.
When OBV crossunder the EMA it gives a sell signal. When OBV crossover EMA it gives a buy signal.
You can adjust the length of the EMA . By default it is set to 9

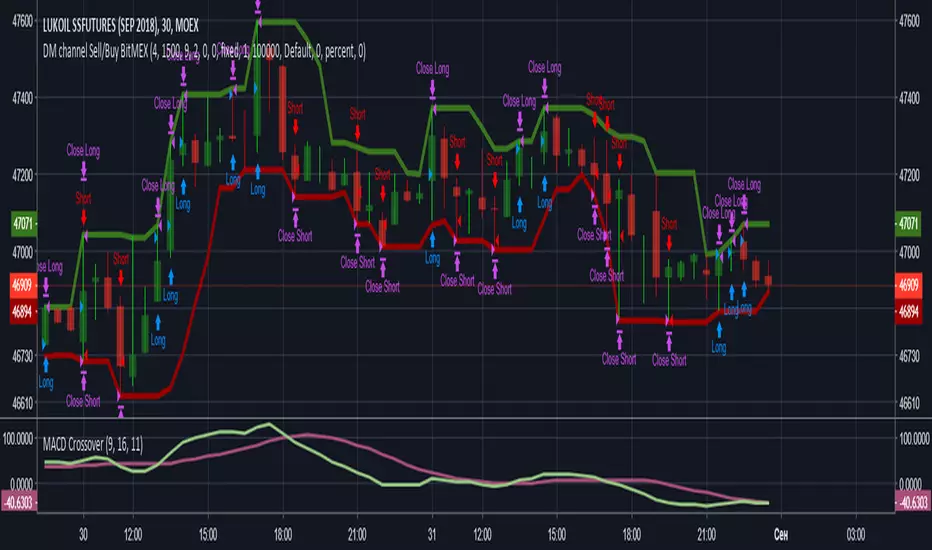
GM channel Sell/Buy BitMEX New script - really working strategy on one of tools of the Moscow Exchange.
The idea such - as soon as the price punches one of borders - upper or lower - we becomes in the direction of movement of the price. It is possible to come the postponed warrants for the probity prices up or down. An exit is performed on a trelling to stop, or everyone proceeding from the experience determines an exit point.
---------------
Новый скрипт - реально работающая стратегия на одном из инструментов Московской биржи.
Идея такая - как только цена пробивает одну из границ - верхнюю или нижнюю - мы становится в направлении движения цены. Можно отложенными ордерами заходить на пробитие цены вверх или вниз. Выход осуществляется по треллинг стопу, либо каждый сам исходя из своего опыта определяет точку выхода.

[frac] Flowrate StrategyThis script employs an algorithm to assess the net volume traded. Entry and exit signals are a function of the MA crossovers. The default settings produce extremely strong results on 4hr charts. Alternative settings set to EMA and a 233 Channel Length also produce very encouraging results on higher resolution timeframes, specifically the 15m-1hr.

Crypto Reversal Scalper BacktesterThe script that will detect a reversal with two variables. The script will then attempt to scalp against the trend short-term.
Absolutely, NO REPAINTING. Can be used across crypto pairs.
You must use ONCE PER BAR for alerts! Yes it does work!
PM me for a trial.
Cost for the bot will be 0.01 BTC/month. Cost can be negotiable.
bp2000 strategyThis strategy is the perfect balance of controlling the profitable accuracy and the times of trading. This version of the script has been written to reduce repaint and delay.
Works on any time frame. Kindly adjust the strategy settings for each single market.
This strategy is published for invited users. Only the customers will be granted access.

I AM Div3rgentIchimuko+MACD+William+CCi+Bollinger+4EMA,4SMA +ATR +pivot + strategy
When background is green William or cci or BOTH are under their boundaries (Good to Buy)
When background is red William or cci or BOTH are over their boundaries (Good to sell)
When Macd strategy tell u can buy
When it says close u can sell
Use ichimuko it is the best trend analyzer
U also can use EMA & SMA And ATR in option(touch Setting bottom)
,...
Hope u all EnJoY

DNP V3DNP V3 identifies optimal times to enter and exit a trade on relatively high-volume goods. The in-house algorithm works against all asset classes, from Forex, stocks, options and, especially, cryptocurrencies.
Through TV's alert system you can set up email alerts to notify you of any meaningful change in market activity, thereby giving you more time to take care of the things in life that are truly important.
There's no skill of interpretation required. Simply discover a set of values that return favorable profits on the backtest, set up the alert according to them and then buy and sell when told.
Welcome to the matrix
This script works best with: high volume, long-term goals, large trade positions.

Zanatta Buy & SellThis scrypt is for Long, Shorts, Buy, Sells, Stop Loss and Make Profit.
With this I can calculate the volume x moving average x volatility and shot alerts, that can be integrated easily and execute orders at BitMEX and Bitfinex.
