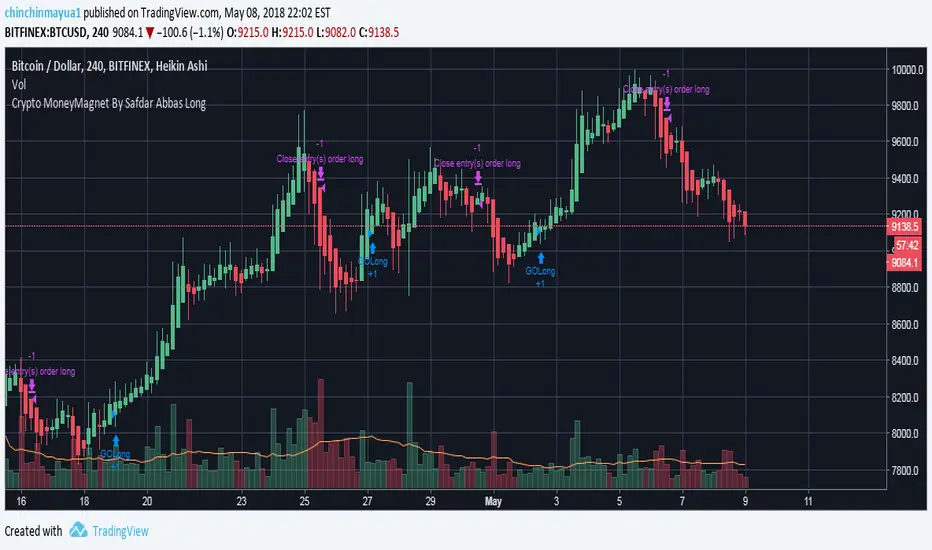
Crypto MoneyMagnet By Safdar Abbas LongStrategy works for 1h, 2h and 4hour , results are upto 80% success ratio
Volume
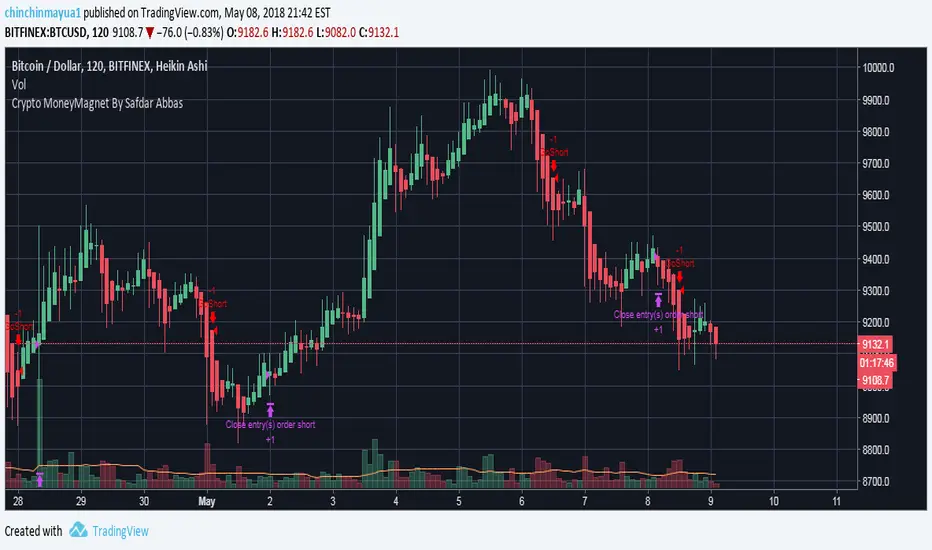
Crypto MoneyMagnet By Safdar Abbas For Short Trades 70% Success Strategy works good in 1h, 2h and 4h for btc , only for short trades .
SL_Scalping_Main_BacktestHow to use it :
1. Comment or PM
2. Enjoy trial around 3(+1) days.
3. If you want to keep using the indicator, let's discuss!

Labv1.0 Btc Buy/sell Signal Kesin sonuçlar ile sinyal veren yazılım. Orjinal hali Jay Rogers -0.92% tarafından yapılmıştır.
twitter : twitter.com
15 ve 0.00% 30 dakikalık grafiklerde yüksek başarını sağlar.
Test için 5-6 kişilik kontenjan vardır.
/////////////////////////////////
Software that signals with precise results. The original version was made by Jay Rogers -0.92% .
twitter: twitter.com
Provides high success on 15- and 30-minute charts.
There is a quota for 5-6 people for the test..

DiamondStrategyGreat working Strategy, it is private so to use it you must send me a message.
The Strategy is pretty accurate and I work on improving it constantly

SteveLeoStrat80% accuracy on IOTA/USD or BTC/USD, preferrably on 1 hour or 30 minute timeframes.
Backtested with 5 years of data and there is no repainting. I also added an alert function so you can notify yourself when a long or short pops up.
Enter on long when entry is below the green line by at least 1%
Take profit when it reaches the green line or above.
Not all signals are equal. If the crossover for a long signal is at a sharply downtrending angle, then the price may continue to fall. So look for support line and buy there.


Multi-Indicator Entry/ExitMultiple indicator entry/exit strategy.
BBs wrapped around MACD, utilizing RSI & OBV as confirmations.

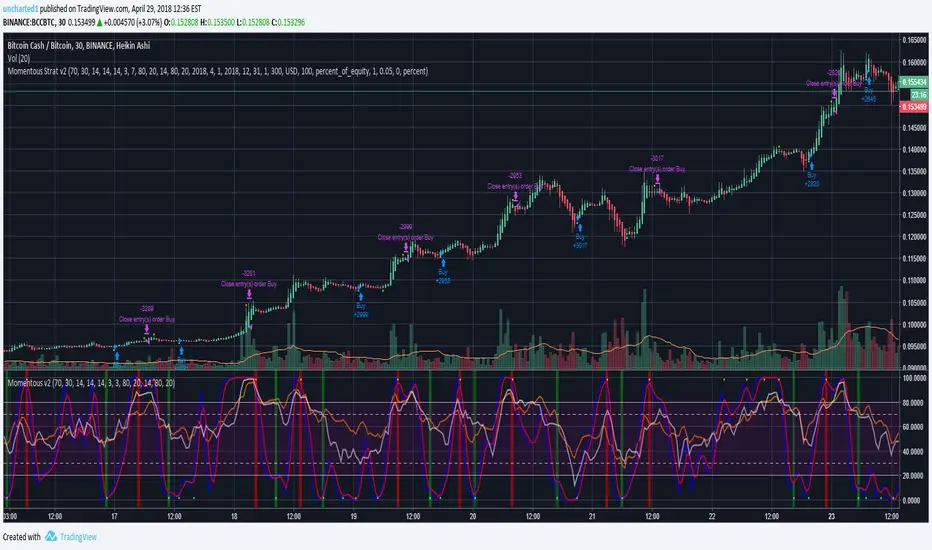
uncharted1 - Momentous Strat v2Strategy accompanying the study of the same name; uses RSI, StochRSI, and MFI indicators. Mix and match to find what you think could be the best entries and exits using these indicator combinations. All the switches are in the Inputs page so have fun with it. I created this primarily for crypto currencies and long positions. Perfect for users of AutoView. Backtest component by @pbergden included.
Altcoin-BTC TidesRider (beats Buy & Hold) BINANCE:EOSBTC
参数基于Binance的EOSBTC。不同交易对有不同DNA,没有万金油策略,需要调整参数。
基于均线
双均线过滤信号
Haiken Ashi蜡烛图过滤信号
通过量能放大来“偷鸡”赚取利润
不断改进中.
Based on Moving Average
Use dual SMA to filter false signals
Use Haiken Ashi candlesticks to filter false signals
Volume sensitive buy and sell to obtain higher profit
Default settings are based on EOSBTC on Binance and are overfitted to produce good backtest results, however this is normal as each trading pair has its own DNA hence optimal settings.
I welcome suggestions of improvements.
Ongoing improvement.
Contact me for subscription.
Disclaimer: The strategy does not form or provide financial advice regarding investment. Use at your own risk.

romathe roma indicator indicates crosses of emas which signals up and down and provides a simple trading

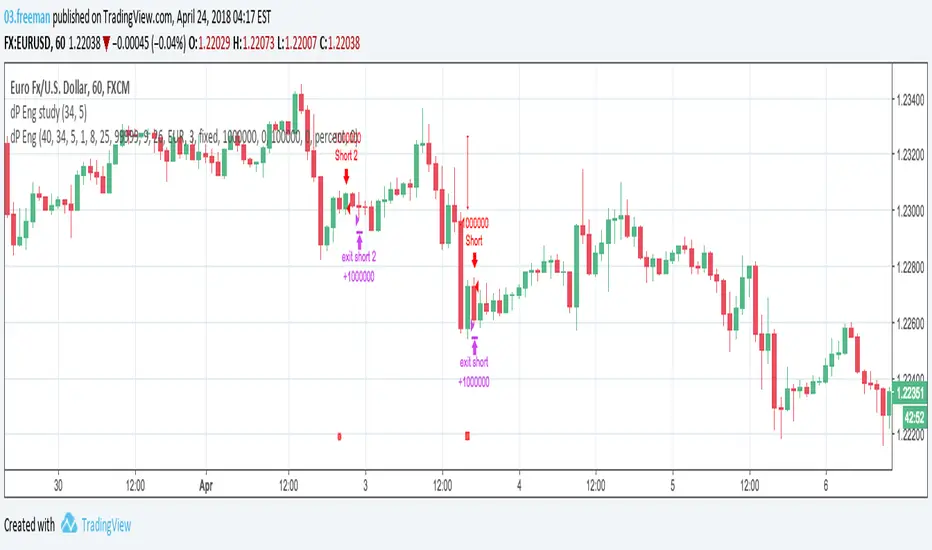
Engineered strategyThis strategy is based on volumes and Bill Williams indicators.
The idea is simple:
- if price has enough boost then follow the trend
- if the boost is slowing down then bet on trend reversal
Results are very good: look at maximum drawdown and percent profitable.
If you are intested on this strategy, I devoleped also the study with alarms.
I will post results on multi-timeframes.
Multiple Moving Averages+TransientZones+Volumes///////////////////////////////////////////////////////////////////////////////////////////
//// MULTIPLE_MA+TRANSIENT_ZONES+VOLUMES ////
/////////////////////////////////////////////////////////////////////////////////////////
// @author GianlucaBezziccheri
// A simple script including:
// 1) 4x Simple Moving Averages
// 2) 4x Exponential Moving Averages
// 3) 4x Weighted Moving Averages
// 4) 4x Volume Weighted Moving Averages
// 5) 4x Hull Moving Averages
// 6) Transient Zones v1.1 (by Jurij)
// 7) Volumes
// You can choose MA type you prefer and even to activate all of them at the same time,
// though i don't recommend doing this.
// For more details about 6) check the original script

Cryptopeep Volume StrategyFinally a strategy based on volume with good results. Please let me know what you think in the comments below.
If you would like to be kept up to date please follow us and try our indicators and strategies here: uk.tradingview.com
If you agree with the above please like.


S&P 500 Benchmark Strategy
This strategy is a Benchmark Trend trading strategy. I used it primarily to measure my private algorithms against. It works on a variety of instruments at intervals between 1m and 1d (you'll have to play with some of the ranged variables in these cases). It was primarily designed to trade the 15 minute interval on SPX derived products. S&P E-Mini contract featured above.
It hits what I consider to be key targets when developing an algo:
1. Avg Trade is above $50
2. Profit Factor is above 1.2 (preferably above 1.5)
3. Has a relatively small draw-down
4. Is able to be traded both long and short
Notes/Options:
Can trade within market hours (default), outside market hours (with open inside), or anytime
Can adjust lengths for trend calculations
Algo tries its best to avoid fake-outs by using a volume component, this means that it misses 'slow rises' sometimes
By default it tries to only enter trades between 0930 and 1600. If the trade has left the station, it will wait for the next setup.
Stop loss level has a big impact on performance per instrument - default is 20 ticks but this has to be changed per instrument (I plan on updating this with code to auto-magically generate appropriate stop levels
As a Trend Following algorithm, it is vulnerable to chop zones but has been particularly resilient over the past few months when traded at 15m or 1h intervals. It is designed to trade against the 'current' market that has more frequent whipsaws. When used over generic bull market periods, it fails due to the high number of failed short trades and trimmed long trades. It works in a medium/high volatility environment.

SW SVE - Stochastic+Vol+EMAs [Sergio Waldoke]Script created by Sergio Waldoke (BETA VERSION v0.5, fine tuning PENDING)
Stochastic process is the main source of signals, reinforced on buying by Volume. Also by Golden Cross.
Selling is determined by K and D entering overselling zone or EMA's Death Cross signal, the first occurring,
and some other signals combined.
Buy Long when you see a long buy arrow.
Sell when you see a close arrow.
This is a version to be tuned and improved, but already showing excelent results after tune some parameters
according to the kind of market.
Strategy ready for doing backtests.

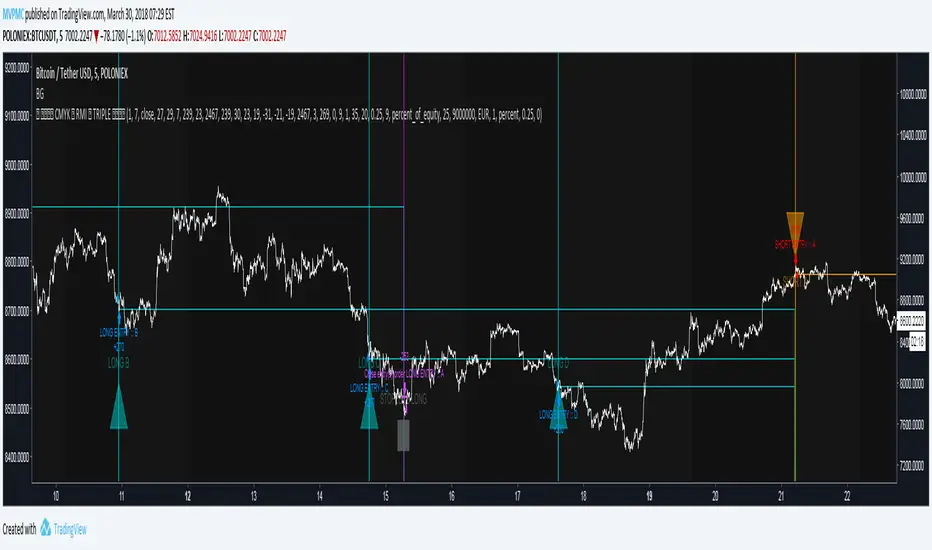
CMYK RMI TRIPLE Automated strategy▼ This is the strategy version of the script.
◊ Introduction
This script makes use of three RMI 's, that indicate Overbought/Oversold on different timescales that correspond with Frequency’s that move the market.
◊ Origin
The Relative Momentum Index was developed by Roger Altman and was introduced in his article in the February, 1993 issue of Technical Analysis of Stocks & Commodities magazine.
While RSI counts up and down ticks from close to close, the Relative Momentum Index counts up and down ticks from the close relative to a close x number of days ago.
This results in an RSI that is smoother, and has another setting for fine tuning results.
This bot originated out of Project XIAM , an investigative script that outlined my approach towards Automated Trading Strategies.
Are you interested in writing bots yourself ? check out the beta version of this script.
It has many bugs, but also most of the Skeleton.
◊ Usage
This script is intended for Automated Trading with AUTOVIEW or TVAUTOTRADER , on the 1 minute chart.
◊ Features Summary
Overlay Mode
Indicator Mode
Three RMI's
Trend adjustment
Pyramiding
Ignore first entries
Take Profit
Stop Loss
Interval between Entries
Multiring Fix
Alert signal Seperation
◊ Community
Wanna try this script out ? need help resolving a problem ?
CMYK :: discord.gg
AUTOVIEW :: discordapp.com
TRADINGVIEW UNOFFICIAL :: discord.gg
◊ Setting up Autoview Alerts
Use the study version of this script, To set up The Alerts Autoview Picks up on.
The Signals to work with are :
Open 1 Long
Use this to open one Long Position.
With quantity being : /
Once per bar
Being larger than 0
Comment example : e=exchange b=long q=amount t=market
Open 1 Short
Use this to open one Short Position.
With quantity being : /
Once per bar
Being larger than 0
Comment example : e=exchange b=short q=amount t=market
Close1 Position
Use this to Close The amount of one Open Position.
With quantity* being : /
Once per bar
Being larger than 0
Comment example : e=exchange c=position q=amount t=market
*Beware when using a percental % quantity, instead of an absolute quantity.
Percental Quantities are based on the , Not
And will change in absolute value relative to the amount of open trades.
Close All positions
Use this to Close All Open Positions.
With quantity being :
Once per bar
Being larger than 0
Comment example : e=exchange c=position t=market
For the specific Syntax used in the comment of the alert, visit Autoview .
◊ Setting up TVAutotrader
Use the strategy version of this script, And load it into TVAT .
◊ Backtesting
Use the strategy version of this script for backtesting.
◊ Contact
Wanna try this script out ? need help resolving a problem ?
CMYK :: discord.gg


Range Breakout PredictorHi everyone, I put this together while learning Pine and wanted to share to see if anyone finds it useful.
It does a decent job predicting the direction of breakouts from range conditions, as well as picking up some easy trend profits. I had some fun making it quite configurable for those who would like to tune it for a particular index (for example, check out GOOG at 1 hour resolution with the default values, just for fun).
Please let me know if you like anything about it or have suggestions!

BOLLedOverIntroduction
BOLLedOver leverages classic signal strategies typically seen in equity program trading algos. Interestingly, in the crypto world, these statistical methods don’t mean quite as much as crypto is generally random and spastic. (I find some of the online analysis humorous—“setting bottom when we cross the 50 day moving average”—really? Trend following is measured in minutes, hours or days, not weeks or months. BOLLedOver uses the Bollinger Band method with various filters to insure good buying and selling opportunities. These scripts use the same framework with different signaling strategies as I have found this a very useful way to “test and learn”. The framework allows configuration for “interesting” parameters to their underlying statistical functions. Trade execution strategies are equally as important than getting the right signals in place. In the live BOT version, the framework allows for MARKET orders only, and “chasing the book” which insures that you can place LIMIT orders attempting to be a “market maker” not “taker”. In addition, the framework takes a trailing STOP approach which eliminates a lot of risk on the down side.
FOR BOT RENTERS ONLY: With so much trading, fees and slippage can really make a difference. Some exchanges provide free trades (GDAX) if you make markets with your trading. This applies to both the BUY and SELL sides and proves very useful. A big mistake with newbies in this area is not considering cost (and slippage). The framework has yielded approximately 70-80% free trades (mileage varies based on statistical settings) with exchanges that have the market maker policy. Always, be conservative in back-testing the strategies with fee settings—this can quickly destroy profits. I have tested extensively on Binance, Bitfinex and GDAX and leave it to you to backtest your favorite exchange—BOLLedOver trades a lot with some settings, so if your exchange isn’t quite as reliable or has holes in the data the BOT may not perform as advertised.
Key Features
• Designed for market maker trading
• Leverages classic statistical models in a unique crypto way
• Trades when market is sideways or heading up, sleeps when heading down
• Two to three trades daily (depending on settings and market action)
• Tune-able with ample knobs and levers.
Parameters
Stop Loss % (default 97%) STOPs will be placed and ratchet up following stops with each 1% increase in price action.
Stop Loss Trail % (default 96%) Second STOP starts here.
Bollinger Bands Time Period (default 6) indicates 6 candles in calculation. BOLLedOver runs best at 15 minutes periods. Try your own setting with plenty of backtesting.
Average Volume (default 18) filters buy and sell signals
Buy ROC Length (default 75) number of candles averaged for positive rate of change , which gives the go ahead to act on a BUY signal. When markets are heading south the BOT goes to sleep. You might get a STOP LOSS haircut (default 3%, 2 to 1 chance if you are in a position), but no trade chattering in whipsaw downward spirals after that.
Sell ROC Length (default 85) number of candles averaged for a negative rate of change , which gives the go ahead to act on a SELL signal. Note: the tighter the Bollinger Bands (e.g. 5) the less likely a SELL will process before a STOP LOSS is reached making this parameter useless in those cases.
MACD – the moving average convergence/divergence is used to check the validity of BUY and SELL signals
MACD Fast Period (default 13)
MACD Slow Period (default 24)
MACD Signal Smoothing (default 8)
Candles to Wait After Trade (default 4) set to 0 to turn off. Keeps trades from occurring consecutively in pump and dump environment.
This script logic is available on cryptotrader.org as a rentable BOT. You will need API keys for automated trading.

SARcastiqueSARcastique
Introduction
SARcastique leverages classic signal strategies typically seen in equity program trading algos. Interestingly, in the crypto world, these statistical methods don’t mean quite as much as crypto is generally random and spastic. (I find some of the online analysis humorous—“setting bottom when we cross the 50 day moving average”—really? Trend following is measured in minutes, hours or days, not weeks or months. SARcastique uses the Parabolic SAR indicator with various filters to insure good buying and selling opportunities.
BOT RENTERS: All my BOTs use the same framework with different signaling strategies as I have found this a very useful way to “test and learn”. The framework allows configuration for “interesting” parameters to their underlying TA-lib functions. In addition, I have found that trade execution strategies are far more important than getting the right signals in place. My framework allows for MARKET orders only, and “chasing the book” which insures that you can place LIMIT orders attempting to be a “market maker” not “taker”. In addition, the framework takes a trailing STOP approach which eliminates a lot of risk on the down side.
With so much trading, fees and slippage can really make a difference. Some exchanges provide free trades (GDAX) if you make markets with your trading. This applies to both the BUY and SELL sides and proves very useful. A big mistake with newbies in this area is not considering cost (and slippage). My BOTs have yielded approximately 70-80% free trades (mileage varies based on statistical settings) with exchanges that have the market maker policy. Always, be conservative in back-testing the strategies with fee settings—this can quickly destroy profits.
I have tested extensively on Binance, Bitfinex and GDAX and leave it to you to backtest your favorite exchange—SARcastique trades a lot with some settings, so if your exchange isn’t quite as reliable or has holes in the data the BOT may not perform as advertised.
Key Features
• Designed for market maker trading
• Leverages classic statistical models in a unique crypto way
• Trades when market is sideways or heading up, sleeps when heading down
• Two to three trades daily (depending on settings and market action)
• Tune-able with ample knobs and levers.
Stop Loss % (default 97%) STOPs will be placed and ratchet up following stops with each 1% increase in price action.
Trailing Stop Loss (default 95%) once w hav momentum we can increase are downside risk. You dont want to get shaken out in a wild crypto market (or maybe you do)
SAR Settings (default .02, .028, .04) very sensative and specific to exchange and pair. A fscinating indicator
Short EMA - guide for SAR BUY indicator signal
Long EMA - guide for SAR SELL indicator signal
Buy ROC Length (default 75) number of candles averaged for positive rate of change, which gives the go ahead to act on a BUY signal. When markets are heading south the BOT goes to sleep. You might get a STOP LOSS haircut (default 3%, 2 to 1 chance if you are in a position), but no trade chattering in whipsaw downward spirals after that.
Sell ROC Length (default 85) number of candles averaged for a negative rate of change, which gives the go ahead to act on a SELL signal. Note: the tighter the Bollinger Bands (e.g. 5) the less likely a SELL will process before a STOP LOSS is reached making this parameter useless in those cases.
MACD – the moving average convergence/divergence is used to check the validity of BUY and SELL signals
MACD Fast Period (default 13)
MACD Slow Period (default 24)
MACD Signal Smoothing (default 10)
Average Volume Length (default 19) used to assert that SELL signals are accompanied by meaning full volume.
