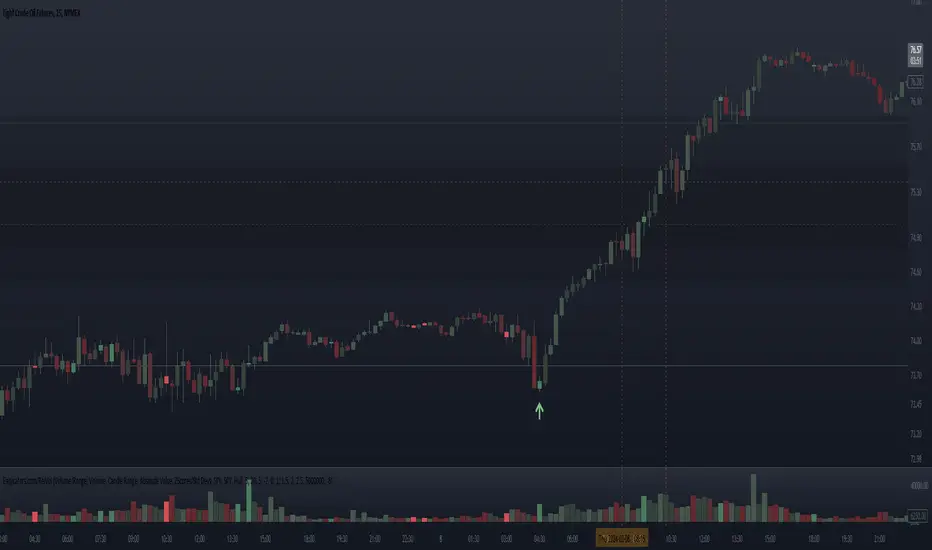
Breton Composite BTC Volume -turningpoint -strategyComposite BTCUSD Volume strategy compiled from 9 different exchanges, attempting to isolate turning points by trading on volume spikes and bag holding bars
VSA

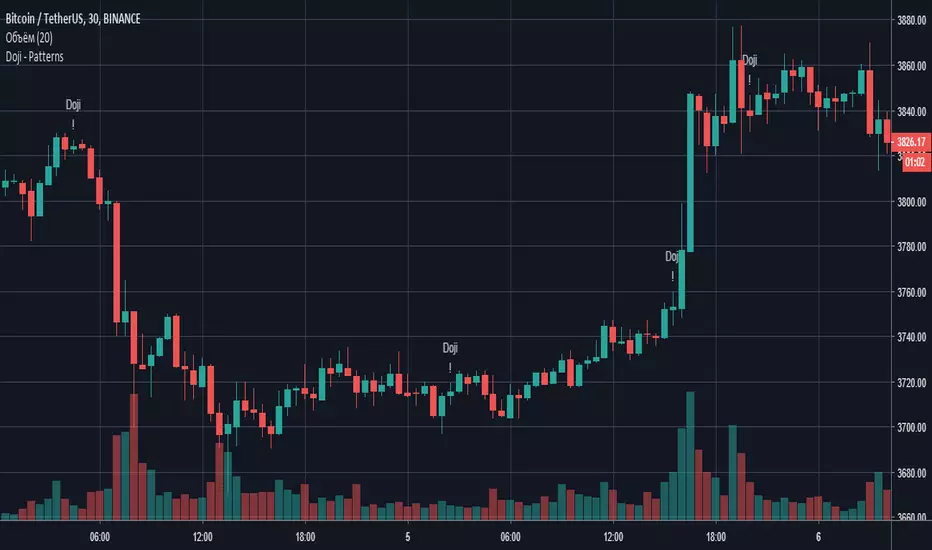
Doji - PatternsПаттерн "Доджи" - показывает равновесие сил продавцов и покупателей. Хотя сам по себе этот паттерн не является сигналом к открытию сделки, не стоит его всегда игнорировать. Доджи встречается в более сложных паттернах, состоящих из двух - трех свечей, например: "Утренняя звезда", "Вечерняя звезда" и "Крест харами" (подробнее о них я расскажу в своих следующих публикациях). Часто появление данного паттерна указывает на окончание трендового движения и/или начале "рэнджа".
Sumiński's VolumeHello, this indicator shows us the trading activity in the selected time period. It's similar to the tick volume, the difference being that this indicator is based on real volume. It measures the average amount of volume per 1 pips price in the selected time period. It is useful when after the end of the trend the price comes into consolidation, if at the levels close to support or resistance the indicator shows a high value - it means that there is an intense exchange of contracts or shares - which means that this price level is considered by the market as important.
Sorry for my English and good luck in the markets.
Institucional Color Candle Idea extracted from the books by Anna Coulling ,Gavin Holmes and Tin Ord, using Volume and Spread Analysis (VSA) techniques coupled with Al Brooks' expertise with Price Action these candles are magical, identify the exact moment
of the performance of the big players are acting in the market represented by the colors:
1) Red Candles we have an Ultra High activity,
2) Candles Orange we have a Very High Activity
3) Candles Yellow we have one High Activity
4) White Candles represent normal activity in the market
5) Blue Candles, market activity is very low without interest in the continuation of the movement here I fear we usually have the end of the wave of a pullbacks
www.mql5.com

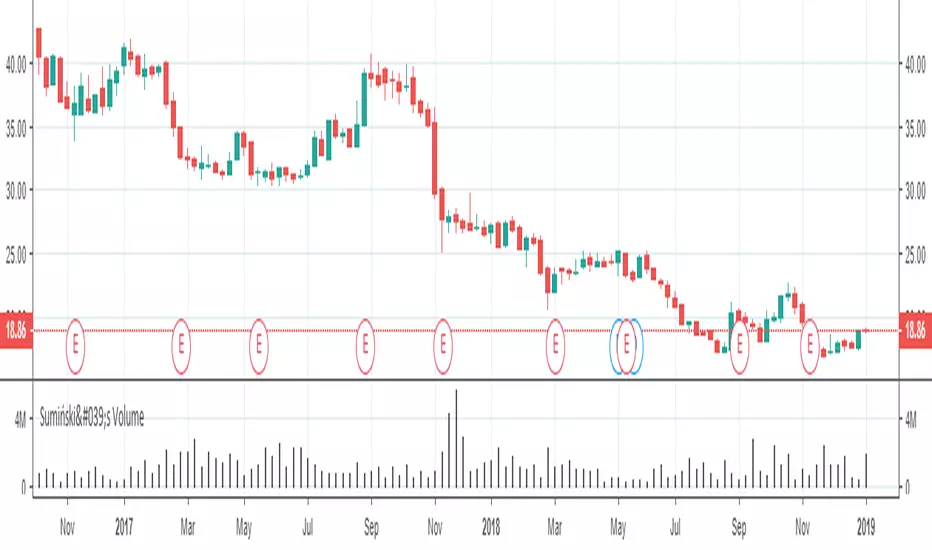
Average buyer/seller priceThis script shows average buyer or seller price since the last bar you define.
The bar is defined by the condition low/high less or greater than specific value.
Recommended to use 15/30 or 1h timerame (the less the better).
The error is about 1%.
Blue - Buyer
Red - Seller.

SMA VSAThis script calculates the strength of bears and bulls.
Long when green line crosses red upwards and stay upwards one more bar. Close long position when green line crosses red again in the opposite direction.
Short when red line crosses green downwards and stay downwards one more bar. Close short position when red line crosses green again in the opposite direction.
Open positions when lines are close to each other.
Recommended period: 14.

Objective Analysis of Spread (VSA)Note: Pardon for a busy chart. It really is irrelevant for this indicator. Just look at the bottom part of the chart for the indicator (SpAn).
This script is meant to add objectivity to the estimation of spread in VSA. This is best used with a similar volume indicator that measures volume in the same fashion, but a simple rule of "higher/lower than the previous 2 bars" for estimation of volume size can be used as well in conjunction with this indicator.
A 30-period (adjustable) SMA difference between the high and the close is used to estimate average spread. This value is used to plot bands of 0.8 and lower (blue) standard deviation for narrow spread, 0.8-1.3 (yellow) for medium spread, 1,3-1.8 (green) for wide spread, 1.8-3 (red) for ultra-wide spread. Anything above 3 (no color) is plain crazy. =)
How to use:
A histogram of each bar spread is plotted as well. See where each histogram bar ends. For example, if it ends in the green area, this bar has a wide spread.
Added indicator:
An ATR (14-period, adjustable) is plotted as a black line for your reference. May be used for stops. Otherwise, it is not necessary for VSA.
Feedback and suggestions for improvement are welcome.

Institucional VolumeAccording to Anna Colling, we should analyze the spreads together with the volume "VSA", the work in this script was to make the study of the volume of visual form, in this way we focus only on the candle spread, since the volume is represented by colors and their respective activities
Red Candles = Ultra High Volume
Orange Candles = Very Hight Volume
Candles Yellow = Volume Hight
White Candles = normal volume
Aqua Candle = Low Volume
Relative Volume - VPA / VSA / Better VolumeVolume is important.
Volume is VERY important.
But all the existing methods of volume analysis and order flow analysis fall into the same trap: they're all extremely complicated, hard to learn, and difficult for the human brain to distill down to an actual, tradable signal.
The Relative Volume Gradient Paintbars indicator seeks to address this issue by reducing and simplifying concepts from Volume Price Analaysis (VPA), Volume Spread Analysis (VSA), and Market Profile / Volume Profile into a single indication with varying levels of intensity. Rather than adding more complex symbology and cluttering up your charts with arrows and signals and lines as many volume indicators do, relative volume intuitively takes advantage of the dimension of color, and plays to your brain's automatic recognition of color intensity to highlight areas of interest on a chart where large volumes are being traded. These areas can in turn point out levels of support and resistance, or show strength in a move, exposing the actions of larger market participants that are behind a move.
The Relative Volume indicator can calculate based on a time-segmented / time-based / bar-specific average of volume, adjusting for some of the typical spikes in volume that happen at the beginning and end of a trading day; Or it can be calculated based on any length and type of moving average of volume that is desired: simple, exponential, weighted, Wilders, price-weighted, Hull, or TEMA.
This indicator does more than just normal relative share volume. It can also do relative volume-per-range. The idea behind this setting is that when more volume is being traded but very little movement is happening, this can indicate substantial support or resistance, where a lot of trades are likely being absorbed by larger operators. You can choose your own range calculation for this setting, whether you prefer True Range, high-low range, candle body range, close to close range, or any of several other custom settings.
Moreover, the levels or thresholds at which the color intensity changes are completely user-controlled, so you can adjust them upward to tune out more noise, or downward to increase the level of sensitivity. In addition, all of the colors for each of the thresholds are completely user-controlled.
We hope to see TradingView add support for Richard Arms' CandleVolume or Equivolume before too long, as well as Tick Volume or Trade Count Volume data, all of which can add a lot of power to this method of trading.
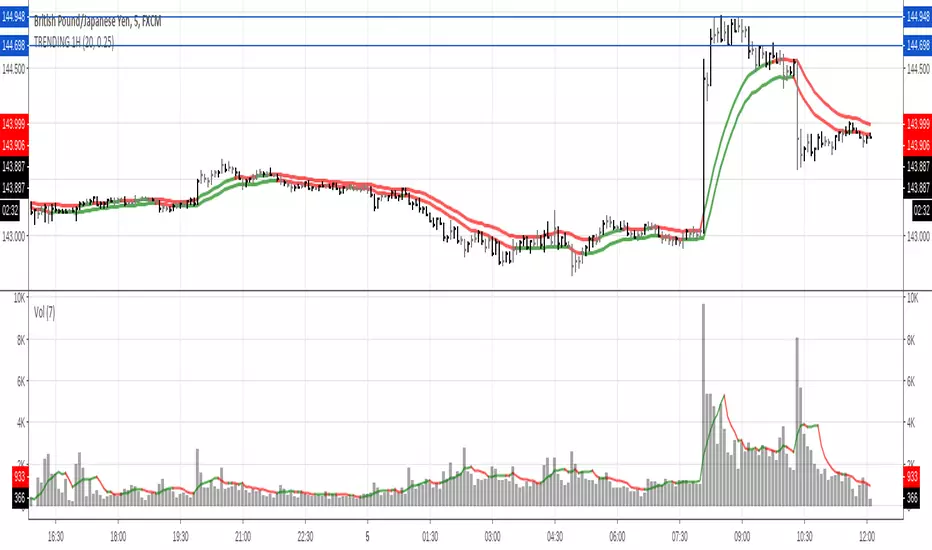
TRENDING high / low 20s EMA with GRAY Bars / Black BarsColored 20 default EMAs describing the trend
Black bars showing strength or weakness on 25% default.
Gray bars showing uncertainty
check volume to take decisions.

Candlestick normalizer + MA's Crossing SignalingWell, after 25 tries I finally did it ._.
Here is the candlestick normalizer I was trying to achieve. In this way you can do a fast and not biased by price candlestick analysis, for example to catch engulfish and doji's on the go ;)
I also added a MAs crossing-over signal I optimized.
Btw, I will try to add volume signaling on this indicator. I had been thinking in 2 options:
1) Maybe as a colour/unfilled bar when volume exceed average
2) Represent the volume on the width of the candlestick.
What do you prefer? Let me know.
I hope you enjoy it!
Phi it.
FIG - Volume Spread analysis Volume spread analysis is a very powerful tool developed by Tom Williams. Probably considered as the father of Volume spread analysis. He is a Syndicate trader who knows well about how smart moneys are playing their role.
I have developed an Indicator with Trading View called Volume spread analysis. We in FIG strongly believe that, we cannot beat or out perform institutional traders, instead we have to travel along with them . With that in mind we follow the footprints of Smart players who leave behind trails. People who are wise enough pick the trails along with us and earn descent amount of profit.
I have designed this indicator, so that it is capable of giving signals for all the phenomenon explained in the Tom Williams book.
Note The calculation of spread and volume are based on my research and analysis. To know more about me and my trading skills just follow me in trading view.
This Indicator is successful for the following phenomenon presently.
Trapped Buyers
Trapped Sellers
Stopping Volume (long)
Buying Climax
Selling Climax
I will be giving constant updates to indicator whenever a signal becomes successful. Other indicators are under test. so kindly disable those indicators in the settings window,. after an update you can start using other phenomenons.
Stay tuned. Follow us in ( FIG )

SignalToSignal.com - Logical Volume Trading SystemOur Logical Volume Trading System is a vast improvement on ‘standard’ volume spread analysis. Based on 15+ year combined experience with our Smart Volume Spread Analysis software, we have refined our analysis and algorithms to provide the most powerful VSA indicator on TradingView.
Combining fundamental analysis, technical analysis, and volume analysis into a powerful methodology that enables you to trade the markets in a way that is uniquely accurate.
The Signal to Signal Logical Volume Trading System quickly handles time-consuming manual background analysis, volume analysis, and signal analysis leaving you free to make considered and knowledgeable trading decisions instantly.
We have refined our price action and volume analysis algorithms to focus on the core trading signals, which often precede large moves, providing you with clear insight and a roadmap to trading successfully.
Due to unique characteristics of the Pine programming language that TradingView indicators utilize, we have also made adjustments to the signal validation and advisor systems. The result is a clean, easy to read chart which allows you to recognize strong setups as soon as they form.
Lastly, our Logical Volume Trading System is customizable. You can choose which signals and advisor warnings are enabled, allowing you test any number of ideas and analysis combinations. Of course the system is optimized for most charts by default so you can get started right away.
To gain access to the Logical Volume Trading System, please visit our website .
If you have any questions, please contact us through the Contact link on our website - signaltosignal.com


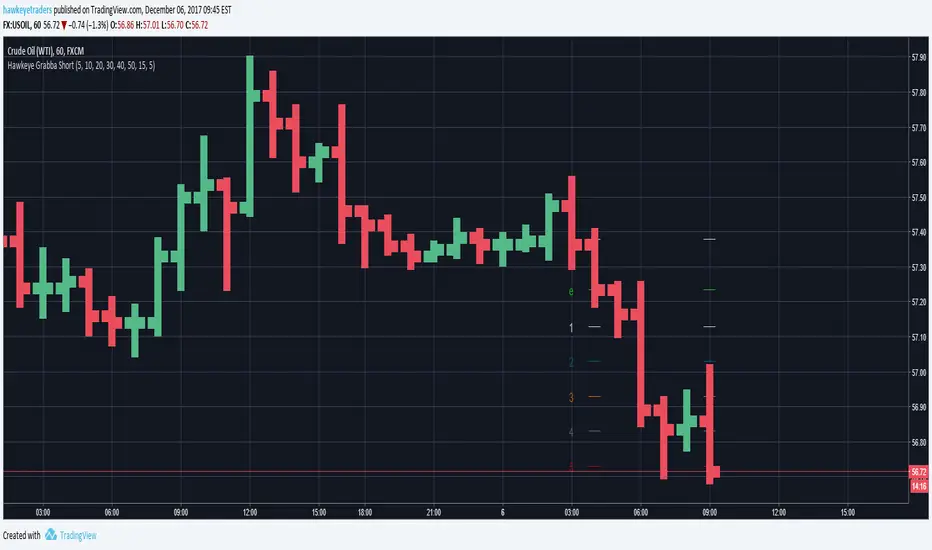
Hawkeye Grabba ShortGrab pips with Hawkeye Grabba
Grabba is a simple mechanical system that you can manage yourself, using your own risk and reward profile.
The Hawkeye Grabba is a risk management tool which provides traders with a visual representation of the risk-to-reward profile on every trade.
For example, you can apply your own profit targets (say 10 pips) and each line will show you that multiple.
As with all the Hawkeye Indicators, Grabba can be applied to any timeframe and any chart and can be custom set to be used on any market, i.e. Forex, stock indices, commodities, etc.
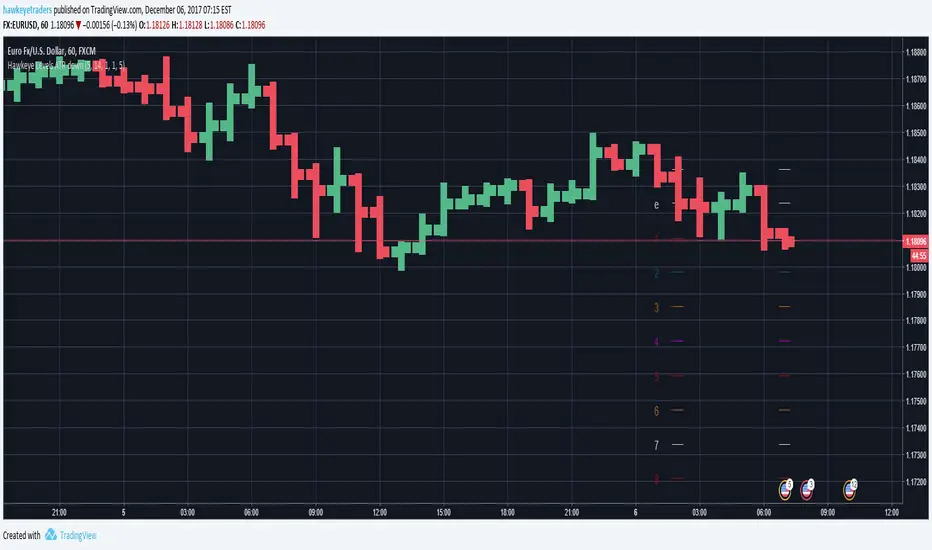
Hawkeye Grabba LongGrab pips with Hawkeye Grabba
Grabba is a simple mechanical system that you can manage yourself, using your own risk and reward profile.
The Hawkeye Grabba is a risk management tool which provides traders with a visual representation of the risk-to-reward profile on every trade.
For example, you can apply your own profit targets (say 10 pips) and each line will show you that multiple.
As with all the Hawkeye Indicators, Grabba can be applied to any timeframe and any chart and can be custom set to be used on any market, i.e. Forex, stock indices, commodities, etc.

Hawkeye Grabba AutoGrab pips with Hawkeye Grabba
Grabba is a simple mechanical system that you can manage yourself, using your own risk and reward profile.
The Hawkeye Grabba is a risk management tool which provides traders with a visual representation of the risk-to-reward profile on every trade.
For example, you can apply your own profit targets (say 10 pips) and each line will show you that multiple.
As with all the Hawkeye Indicators, Grabba can be applied to any timeframe and any chart and can be custom set to be used on any market, i.e. Forex, stock indices, commodities, etc.

Hawkeye Levels ATR downExit at the right time with Levels ATR!
Levels ATR is a powerful series of user pre-defined levels, which act as both potential exit positions and stop loss management.
The Levels ATR indicator helps traders identify clear exit strategies.
Inexperienced traders can:
spend too long focusing on where to enter the position
spend no time on where to exit or take profits
allow the market to dictate the exit following a particular chart pattern or set up
be panicked into exiting
Few traders concentrate on their exit strategies, yet this is where the big profits are made!
Hawkeye Levels ATR upExit at the right time with Levels ATR!
Levels ATR is a powerful series of user pre-defined levels, which act as both potential exit positions and stop loss management.
The Levels ATR indicator helps traders identify clear exit strategies.
Inexperienced traders can:
spend too long focusing on where to enter the position
spend no time on where to exit or take profits
allow the market to dictate the exit following a particular chart pattern or set up
be panicked into exiting
Few traders concentrate on their exit strategies, yet this is where the big profits are made!

Hawkeye Levels ATRExit at the right time with Levels ATR!
Levels ATR is a powerful series of user pre-defined levels, which act as both potential exit positions and stop loss management.
The Levels ATR indicator helps traders identify clear exit strategies.
Inexperienced traders can:
spend too long focusing on where to enter the position
spend no time on where to exit or take profits
allow the market to dictate the exit following a particular chart pattern or set up
be panicked into exiting
Few traders concentrate on their exit strategies, yet this is where the big profits are made!

Hawkeye RoadkillWait for the Roadkill signal – then dive for the perfect kill!
Hawkeye Roadkill looks at multiple timeframes simultaneously, and then provides two entry signals, one based on the trend and the other on volume.
One of the biggest problems traders face is that whenever they see a signal or set up in one timeframe, they immediately look at a lower or higher timeframe chart to validate the signal for the confidence to enter the trade. This is a classic problem, and one that can be seen on virtually every trader’s screen, which can be cluttered with several charts, all with different timeframes and all giving different signals to the confused trader. Ultimately, the trader loses both money and confidence, and is no longer able to trade.
For example, if you are looking at a daily chart, does the weekly chart also suggest that your trade is valid? Or, if you are looking at a 15 minute timeframe, does the one-hour chart confirm your analysis? Often the two charts will differ in their signals, since a trend that has begun in one timeframe, may already be ending in another.
So you have two clear signals to get you into the market in your preferred timeframe.

Hawkeye KISSIt only takes one KISS – and this is it!
Hawkeye KISS is designed specifically for trading stock indices or equities. KISS, in one simple indicator, will instantly reveal who is controlling the price – either the buyers or the sellers. KISS tells you the advance decline issues that are occurring across the whole of the US stock market
KISS has just two lines to watch, a green and a red line. As the sellers in the market begin to increase, the red line rises, and consequently as buyers decrease, then the green line falls.
So where you have a diverging indicator with a red line rising and a green line falling, you know the market is in a bearish trend – it’s that simple. So you look for “shorting” opportunities which will be low risk trades because they are in harmony with market sentiment.
Similarly, when the green line is rising and the red line is falling, you know that buyers are increasing and sellers are decreasing, so you’re in a bullish trend. Here you look for opportunities to buy the market, once again giving you low risk trading opportunities.
KISS works in all timeframes, and is the perfect tool, whether you are an intraday scalper on the indices, or a longer term trader in equities. Kiss is a powerful indicator on its own, but when added to the other Hawkeye Indicators such as Volume and Trend, it becomes the ultimate strength and weakness barometer.
Getting into a trade at the right time and on the right side of the market is one of the keys to trading success. However, it is equally important to be patient, and KISS will let you know when you should stay out of the market. When the red and green lines are tightly bunched together, then the buyers and sellers are equally balanced. In other words the market is in congestion as no one has control, so we stay out.
