Rolling Midpoint of Price & VWAP with ATR BandsThe Rolling Midpoint of Price & VWAP with ATR Bands indicator is a dual-equilibrium concept that fuses price-range structure and traded-volume flow into one continuously updating hybrid model. Traditional VWAPs reset each session and reflect where trading occurred by volume, while midpoints used here reveal where price has structurally balanced between extremes. This script merges both ideas into a cohesive, dynamic system. The Rolling Price Midpoint (50 % of range) represents the structural fair-value line, calculated as the average of the highest high and lowest low over a selected window. The Rolling VWAP (Volume-Weighted Window) tracks the flow-based fair-value line by weighting each bar’s typical price by its volume. Together, these components form the Hybrid Equilibrium — the adaptive center of gravity that shifts as price and volume evolve. Surrounding this equilibrium, ATR Bands at ± 2.226 ATR and ± 5.382 ATR define volatility envelopes that expand and contract with market energy. The result is a living cloud that breathes with the market: compressing during phases of balance and widening during impulsive movements, offering traders a clear visual framework for understanding equilibrium, volatility, and directional bias in real time.
➖
⚙️ Auto-Preset System
The Auto-Preset System intelligently adjusts lookback windows for both the Price Midpoint and VWAP calculations according to the active chart timeframe.
This ensures that the indicator automatically adapts to any trading style — from scalping on 1-minute charts to swing trading on daily or weekly charts — without manual tuning.
🔹 How It Works
When Auto-Preset mode is enabled, the script dynamically selects the most effective lookback lengths for each timeframe.
These presets are optimized to balance responsiveness and stability, maintaining consistent real-world coverage (e.g., the same approximate duration of price data) across all intervals.
📊 Preset Mapping Table
| Chart Timeframe | Price Midpoint Lookback | VWAP Lookback |
|:----------------:|:-----------------------:|:--------------:|
| 1–3m | 13 bars | 21 bars
| 5–10m | 21 bars | 34 bars
| 15–30m | 34 bars | 55 bars
| 1–2 hr | 55 bars | 89 bars
| 4 hr-1D | 89 bars | 144 bars
| 1W | 144 bars | 233 bars
| 1M | 233 bars | 377 bars
⚡ Notes & Customization
- Manual Override: Turn off Auto-Preset Mode to specify your own custom lookback lengths.
- Consistency Across Scales: These adaptive values keep the indicator visually coherent when switching between timeframes — avoiding distortions that can occur with static lengths.
- Practical Benefit: Traders can maintain a single chart layout that self-tunes seamlessly, removing the need to manually recalibrate settings when shifting from short-term to long-term analysis.
In short, the Auto-Preset System is designed to make this hybrid equilibrium tool timeframe-aware — automatically scaling its logic so that the cloud behaves consistently, regardless of chart resolution.
➖
🌐 Hybrid Equilibrium Envelope
The core hybrid midpoint acts as the mean of structural (price) and volumetric (VWAP) balance.
ATR-based bands project natural expansion zones:
🔸+2.226 / –2.226 ATR → inner equilibrium (controlled trend)
*🔸+5.382 / –5.382 ATR → outer volatility extension (over-stretch / reversion zones)
Color-coded fills show regime strength:
* 🟧 Upper Outer (+5.382) – strong bullish expansion
* 🟩 Upper Inner (+2.226) – trending equilibrium
* 🔴 Lower Inner (–2.226) – mild bearish control
* 🟣 Lower Outer (–5.382) – volatility exhaustion
➖
🧭 Higher-Timeframe Framework
Two macro anchors — Price length of 144 and VWAP length of 233 — outline higher-timeframe bias zones. These help confirm when local momentum aligns with (or fades against) long-term structure.
Labels on the right show active lookback values for quick readout:
`$(13) V(21)` → current rolling pair
`$144 / V233` → macro anchors
➖
🧩 Chart Examples
**AMD 15m (Equilibrium Expansion)**
Price steadily rides above the hybrid midpoint as teal and orange (bullish) ATR zones widen, confirming a phase of controlled bullish volatility and healthy trend expansion.
BTCUSD 1m (Volatility Compression)
Bitcoin coils tightly inside the teal-to-maroon equilibrium bands before breaking out.
The hybrid midpoint flattens and ATR envelopes contract, signaling a state of balance before volatility expansion.
ETHUSD 15m (Transition from Compression → Impulse)
Ethereum transitions from purple-zone compression into a clear upper-band expansion.
The hybrid midpoint breaks above the macro VWAP 233, confirming the shift from equilibrium to directional momentum.
SOFI 1m (Micro Bias Reversal)
SOFI’s intraday structure flips as price reclaims the hybrid midpoint.
The macro VWAP 233 flattens, signaling a transition from oversold lower bands back toward equilibrium and early trend recovery.
➖
🎯 How to Use
1. Bias Detection – Price > Hybrid Midpoint → bullish; < → bearish.
2. Volatility Gauge – Watch band spacing for compression / expansion cycles.
3. Confluence Checks – Align Hybrid Midpoint with HTF 233 VWAP for strong continuation signals.
4. Mean Reversion Zones – Outer bands highlight areas where probability of snap-back increases.
➖
🔧 Inputs & Customization
Auto Presets toggle
🔸Manual Lookback Overrides** for fine-tuning
🔸Plot Window Length** (show recent vs full history)
🔸ATR Sensitivity & Fill Opacity** controls
🔸Label Padding / Font Size** for cleaner overlay visuals
➖
🧮 Formula Highlights
➖Rolling Midpoint = (highest(high,N) + lowest(low,N)) / 2
➖Rolling VWAP = Σ(Typical Price×Vol) / Σ(Vol)
➖Hybrid = (PriceMid + VWAP) / 2
➖Upper₂ = Hybrid + ATR×2.226
➖Lower₂ = Hybrid − ATR×2.226
➖Upper₅ = Hybrid + ATR×5.382
➖Lower₅ = Hybrid − ATR×5.382
➖
🎯 Ideal For
➡️ Traders who want adaptive fair-value zones that evolve with both price and volume.
➡️ Analysts who shift between scalping, swing, and position timeframes, and need a tool that self-adjusts.
➡️ Those who rely on visual structure clarity to confirm setups across changing volatility conditions.
➡️ Anyone seeking a hybrid model that unites structural range logic (midpoint) and flow-based balance (VWAP).
➖
🏁 Final Word
This script is more than a visual overlay — it’s a complete trend and structure framework built to adapt with market rhythm. It helps traders visualize equilibrium, momentum, and volatility as one cohesive system. Whether you’re seeking clean trend alignment, dynamic support/resistance, or early warning signs of reversals, this indicator is tuned to help you react with confidence — not hindsight.
➖
Remember — no single indicator should ever stand alone. For best results, pair it with price action context, higher-timeframe structure, and complementary tools such as moving averages or trendlines. Use it to confirm setups, not define them in isolation.
💡 Turn logic into clarity, structure into trades, and uncertainty into confidence.
W-VWAP

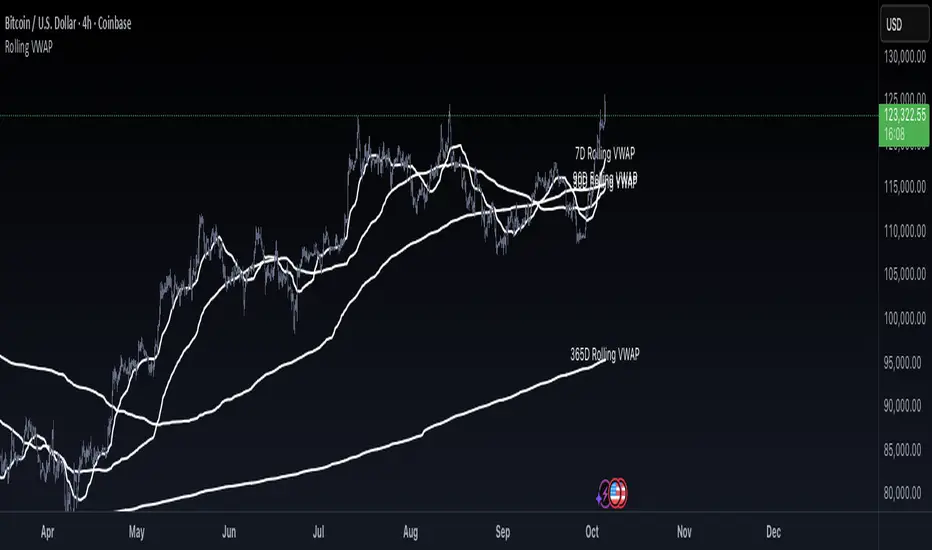
Rolling VWAP by VibieRolling VWAP
🧠 Concept
Rolling VWAP is a continuously updating VWAP that doesn’t reset at fixed anchors like daily or weekly VWAP.
Instead, it applies VWAP calculation to a moving window of recent bars, making it more adaptive and responsive to current market conditions.
⸻
⚙️ How It Works
1. VWAP Formula
• VWAP = Σ(price × volume) ÷ Σ(volume) over a rolling lookback period.
2. Rolling Window
• The indicator calculates VWAP only for the last N bars (e.g., 50).
• As each new bar appears, the oldest drops out, creating a continuously updated VWAP line.
3. Real-Time Adjustment
• Rolling VWAP constantly shifts with new data, tracking short-term fair value as market conditions evolve.
⸻
🧭 How to Use
• Intraday trading → use short rolling windows (20–50 bars) for scalping and mean reversion setups.
• Swing trading → use longer windows (e.g., 10 days) to track medium-term fair value.
• Rolling VWAP acts as dynamic support/resistance and can serve as a trend filter.
⸻
🌟 Why It’s Original and Useful
• Reacts faster to volume changes than anchored VWAP.
• Continuously represents short-term fair price without session resets.
• Excellent for adaptive strategies in volatile markets.
• Particularly valuable for active day traders.
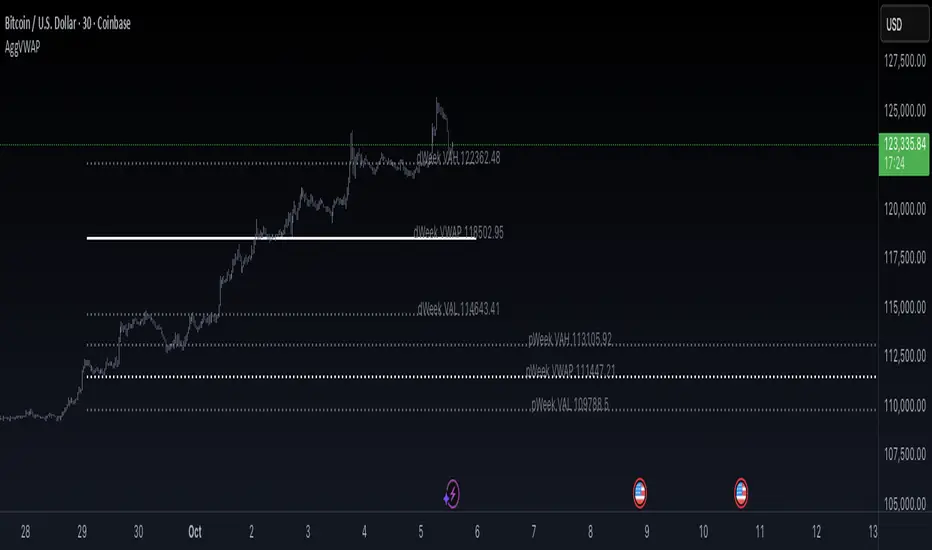
Aggregated VWAP by VibieAggregated VWAP (Professional Layout)
🧠 Concept
VWAP (Volume Weighted Average Price) is a widely used institutional benchmark for fair price.
This indicator enhances standard VWAP by aggregating multiple exchanges, adding standard deviation bands, and offering two visualization modes (bands or lines), providing a professional-grade VWAP analysis tool.
⸻
⚙️ How It Works
1. VWAP Calculation
• VWAP = Σ(price × volume) ÷ Σ(volume), using hlc3 as price reference.
• The indicator supports multiple anchor periods: Daily, Weekly, Monthly, Quarterly, and Yearly.
2. Exchange Aggregation
• VWAP values are aggregated from Binance, Bybit, and Coinbase to compute a market-wide VWAP.
• This prevents bias from a single exchange.
3. Standard Deviation Bands
• Plots ±1σ, ±2σ, ±3σ, ±4σ bands around VWAP.
• These show statistical extremes relative to fair value and act as dynamic overbought/oversold zones.
4. Display Modes
• Bands Mode → continuous VWAP and deviation bands.
• Lines Mode → plots VWAP and deviation levels as fixed horizontal lines for each completed period (e.g., pWeek VAL, dMonth VWAP).
⸻
🧭 How to Use
• VWAP levels act as dynamic support/resistance.
• Deviation bands highlight statistically stretched price areas.
• Previous period VWAP levels (e.g., pWeek, pMonth) often act as institutional reference points.
• Ideal for both swing and intraday trading strategies.
⸻
🌟 Why It’s Original and Useful
• Uses aggregated data for more reliable VWAP calculations.
• Integrates standard deviations, period anchoring, and labeling into one tool.
• Professional layout mirrors institutional analysis techniques.
• Extremely versatile for trend following, mean reversion, and breakout systems.
TGFA Flexible Alerts Multi-MA CrossoversTGFA Flexible Alerts, Multi-MA Crossovers
Description
Flexible MA crossovers with BUY/SELL alerts, customizable candle colors, and an info box for ATR/volatility insights. Supports EMA/SMA/HMA/VWAP on any chart.
Overview
TGFA Flexible Alerts is a versatile Pine Script indicator for traders seeking customizable moving average (MA) crossovers, visual signals, and quick-reference metrics. It overlays crossover lines (e.g., fast EMA over slow SMA), generates BUY/SELL labels and alerts, colors candles based on themes, and includes an optional info box with ATR bands, support/resistance, and trend projections. Built for any symbol and timeframe (optimized for 1H intraday), it auto-detects Heikin Ashi charts and handles mixed MA types like responsive HMA with lagging EMAs. All logic uses built-in TA functions for reliability—no repainting on confirmed bars.
Key Features
MA Crossover Engine: Configurable lines (EMA, SMA, HMA, VWAP) with dynamic colors (HMA tints green/red based on slope). Enable/disable via inputs.
Invert Signals Toggle: Flips BUY/SELL logic for mixed MA setups (e.g., HMA as fast line over EMA).
Reasoning: Traditional crossovers assume a fast line (low lag) crossing above a slow line (high lag) for buys. HMA's hull design makes it ultra-responsive, so it may "lead" too aggressively—causing premature signals. Inverting aligns it with user intuition (e.g., HMA dipping below then recovering signals strength), reducing false positives in trending markets. Test on your pairs!
Visual Alerts: BUY/SELL labels at crossover price (with optional price display and offset adjustment).
Single MA Overlays: Independent plots for EMA/SMA/HMA/VWAP (length 0 to hide).
Info Box: Real-time table with current price, ±1/2 ATR bands, median price (over lookback), trend (SMA50 slope), volatility % (ATR normalized), support/resistance (recent highs/lows), and reversal projections (tied to SMA50 pivot for up/down bias).
Candle Coloring: 20+ themes (dark/light canvases) for bull/bear/reversal/low-volume bars—e.g., Emerald Blaze greens uptrends, dims on low vol. Toggle off for no changes.
Chart Source Flexibility: Auto-switches to Heikin Ashi if detected; manual override for Regular/HA.
Alerts fire on crossovers/crossunders (custom messages with ticker/interval). Open-source for forking.
How to Use
Add to Chart: Search in TradingView's public library, apply to any symbol (e.g., stocks, forex). Best on 1H for intraday, but works on daily/weekly too.
Setup Crossovers: Choose Line 1/2 types/lengths (e.g., HMA 9 over SMA 20). Enable "Invert Signals" if using HMA—prevents lag mismatches in volatile assets.
Alerts & Labels: Toggle labels for visuals; set TradingView alerts on "Buy"/"Sell" conditions. Use offset for crowded charts.
Info Box Insights: Enable for quick scans—e.g., enter long near support if trend is bullish and price > median. Adjust ATR length (default 14) for sensitivity.
Candle Themes: Pick a scheme (e.g., Neon Pulse for dark mode); it overrides bar colors without altering data.
Customization Tip: For HMA-heavy setups, invert + short lengths (5-9) catch turns early; pair with volume filter in alerts.
Limitations & Disclaimers - Designed for overlay on price charts; may overlap in tight ranges—adjust transparency via styles.
HMA can repaint intra-bar; signals confirm on close. Not back tested for all assets—validate with strategy tester.
Info box projections use SMA(50) as a trend pivot (same for up/down as reference); customize via code for advanced calcs. Candle colors are cosmetic only.
This is an analysis tool, not advice. Trading involves risk; combine with fundamentals/news. Past performance isn't indicative of future results. No liability for losses.
I'm still a newbie, so feedback encouraged!
Thank you!!
ThisGirl

Anchored VWAP + Prev Session Levels by Avenoircustom vwap for weekly, monthly, quarterly and yearly vawp.
also highlighting previous vwaps.

VWAP Daily/Weekly/Monthly - Automatic AnchoredExplanation:
This script plots Volume-Weighted Average Price (VWAP) lines that are automatically anchored to the beginning of key timeframes — daily, weekly, and monthly. VWAP is a widely used trading indicator that shows the average price of an asset weighted by trading volume, making it useful for identifying fair value and institutional trading levels.
The “automatic anchored” feature means that you don’t have to manually select starting points. Instead, the script automatically resets the VWAP at the start of each day, week, or month, depending on the chosen setting. This ensures the VWAP always reflects the true average price for that period, providing traders with a consistent reference for support, resistance, and trend direction across multiple timeframes.
Notice:
On the chart, you may notice visible “jumps” in the VWAP lines. These are intentional. Each jump marks the reset point at the start of a new day, week, or month, depending on the selected setting. This design keeps the VWAP history from the previous period intact, allowing you to clearly see how price interacted with VWAP in past sessions.
By keeping these historical resets, you can easily compare short-term (daily) VWAP behavior against longer-term levels like weekly and monthly VWAP. This provides valuable context, helping you spot when price respects or diverges from fair value across different timeframes.
In short:
Daily VWAP resets at the start of each trading day.
Weekly VWAP resets at the beginning of each trading week.
Monthly VWAP resets at the start of each month.
This makes it easy to analyze how price interacts with VWAP levels across different time horizons without manual adjustments.

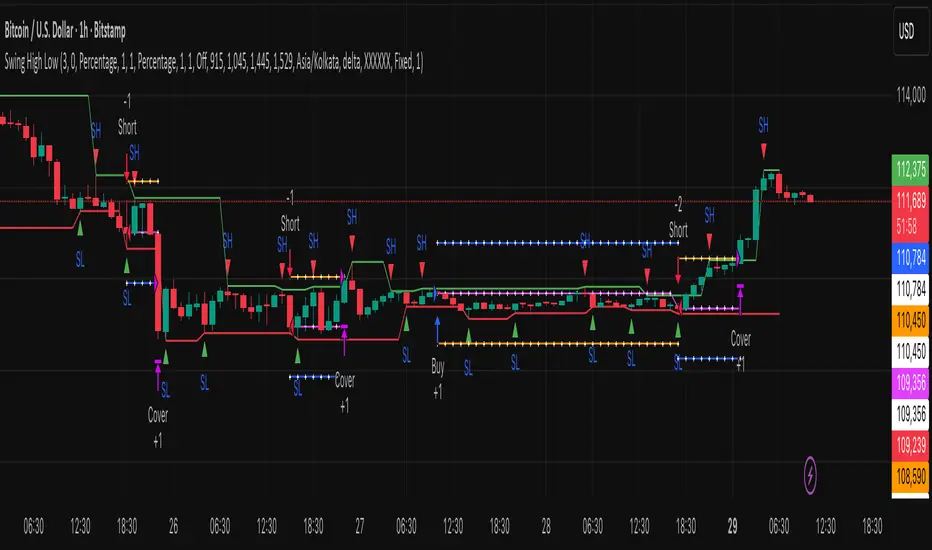
Swing High Low by MIRRORPIPThis strategy finds swing high and lows and marks them as SH and SL respectively.
if the pattern tries to form higher high it will trigger a buy signal
if the pattern tries to form lower low, it will trigger a short signal
This setup is very popular among price action lovers
BAB VWAP V2 Daily, Weekly & Monthly (Optimized)Overview
BAB VWAP V2 displays 3 automatically anchored VWAPs (Daily, Weekly, Monthly) plus 2 customizable intraday VWAPs (anchored at user-defined HH:MM). Optional ±σ bands (volume-weighted) for D/W/M. Includes dynamic labels and an optional summary table.
Main Features
Daily/Weekly/Monthly VWAPs with automatic reset per period.
2 Intraday anchored VWAPs (default 09:00 & 15:30, configurable).
Volume-weighted standard deviation bands (σ) for D/W/M with optional fill.
Alerts on VWAP D/W/M crossovers.
Labels dynamically updated (no stacking) + optional table (2×4) with key values.
Parameters
Display: toggle D/W/M VWAPs, labels, table.
Colors & Style: line colors, thickness, style.
Bands (σ): enable per period, set multiplier, toggle fill.
Intraday (Anchored): enable VWAP 1 & 2, choose hour/minute, set colors & thickness.
How to Use
Add the indicator to a clean chart.
Enable desired VWAPs (D/W/M and/or intraday).
Optionally enable σ bands to contextualize price deviation from VWAP.
Configure intraday VWAP anchors to match your market session (e.g., RTH, EU open, etc.).
Alerts
Price crossing over/under Daily, Weekly, Monthly VWAPs.
Configure alerts from the Alerts panel.
Best Practices
Publish chart screenshots without other indicators for clarity.
Adjust intraday anchor times according to your instrument’s trading session (pre-/post-market handling may vary).
Limitations
Intraday VWAPs are calculated in 1-minute resolution via request.security to remain consistent across all timeframes.
Intraday σ bands are not included by default (can be added in a later version).
Changelog
V2: Performance refactor, non-mutable labels, fixed fill() usage, added 2 intraday VWAPs with time selectors, stabilized table.
V1: Basic D/W/M VWAPs + alerts.
Disclaimer
This script is for educational and informational purposes only. It does not constitute financial advice. You are solely responsible for your trading decisions.
Credits & License
© BAB Trading. Pine Script® — TradingView.
Open-source under the Mozilla Public License (MPL 2.0) by default (or specify your own license in the script header if different).

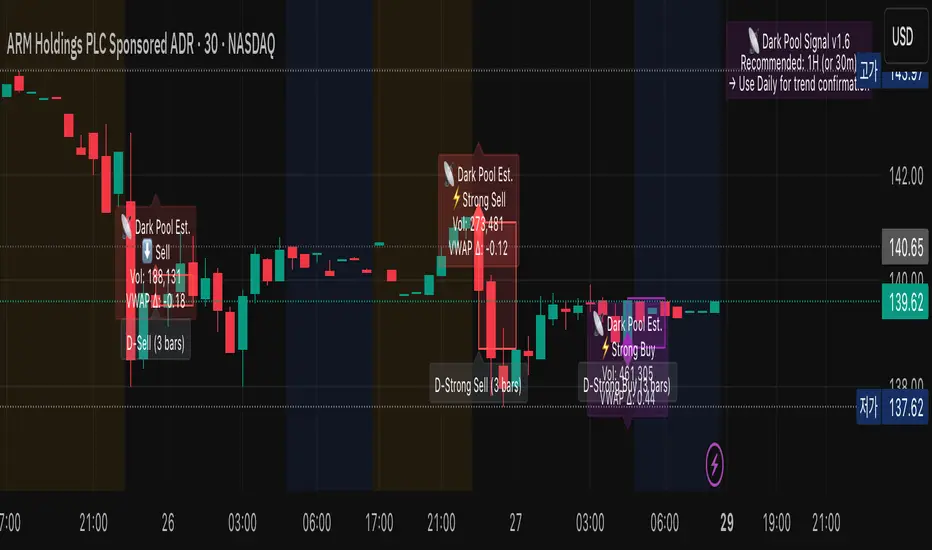
Dark Pool Estimate Signal TrackerDark Pool Estimate Signal — Detect Potential Institutional Activity
Overview
The Dark Pool Signal v1.6 indicator is designed to detect unusual trading activity near VWAP zones, which can be associated with institutional dark pool transactions. By combining volume spikes, VWAP proximity, and optional trend filters, it provides clear visual cues of potential hidden accumulation or distribution zones.
Disclaimer: This script is for informational and educational purposes only. It does not constitute financial advice. All trading involves risk. Past performance is not indicative of future results.
🔍 Core Logic
This indicator identifies potential off-exchange activity by analyzing three key factors:
Unusual Volume Spikes: Highlights bars where the current volume significantly exceeds its moving average by a user-defined multiplier.
VWAP Proximity: Triggers when the price stays within a volatility-adjusted range (ATR-based) of the VWAP, a common characteristic of algorithmic execution.
Trend Confirmation: An optional EMA filter helps align signals with the broader market direction.
Accumulation Detection: Counts repeated signals within a lookback period to identify persistent institutional buying or selling pressure.
The result is a set of visual and alert signals indicating possible institutional footprints.
🧩 Features
Dynamic VWAP Range (ATR-based): Automatically adjusts VWAP proximity sensitivity based on current market volatility.
Multi-tiered Signal Strength: Differentiates between Normal, Strong, and Accumulated signals to visualize the intensity of activity.
Non-Repainting Confirmation: Signals are confirmed only on bar close to ensure they do not repaint.
Language Support: Dual-language display (English / Korean).
Customizable Visualization: Easily adjust label size, color transparency, offset, and the duration of highlighted zones.
Smart Alert System (v1.6): Provides comprehensive alert() and alertcondition() calls for real-time push notifications.
Recommended Timeframe Notice (v1.6): Displays a small on-chart note suggesting optimal timeframes for analysis.
🕒 Recommended Timeframes
Type Recommended Use Description
1-Hour (default) Primary Analysis Offers a good balance between signal clarity and noise reduction. Ideal for most equities and ETFs.
30-Minute Short-term Confirmation Useful for intraday analysis and refining entry/exit points.
Daily Macro View Helps identify long-term institutional positioning and potential trend reversal zones.
< 15-Minute Experimental May generate excessive noise due to market micro-volatility. Not recommended for primary analysis.
💡 Tip: Combine 1H detection with Daily chart confirmation for a more robust, dual-layer view of institutional flow.
📊 Visualization
Purple Diamonds: Strong or Normal Buy signals
Red Diamonds: Strong or Normal Sell signals
Translucent Boxes: Highlight the estimated duration of dark pool activity.
Optional Labels: Display volume, VWAP delta, and signal strength for detailed analysis.
All visual components can be toggled on or off in the settings.
⚙️ Alert System
Create alerts for each specific signal type directly from the chart's alert menu or your script settings.
⚡ Strong Buy/Sell
📡 Accumulated Buy/Sell
⬆️ Normal Buy/Sell
➖ Neutral Activity (Volume spike near VWAP without clear direction)
Set alert frequency to Once Per Bar Close for confirmed, non-repainting signals.
🧭 How to Use
Add the indicator to your chart.
Select your preferred language and timeframe.
Customize visualization and alert settings to your preference.
Observe how the combination of volume + VWAP + trend reveals potential accumulation or distribution zones.
Use alerts to monitor for significant institutional activity in real-time.
🧠 Important Notes
This indicator is non-repainting. Signals are confirmed at the close of each bar.
It is intended for analytical and educational use, not as a direct trading system.
It works across equities, ETFs, and crypto, but volume data reliability can vary by exchange. Always confirm signals with your own strategy and risk management.
VWAP Momentum Oscillator How It Works
Core Calculation Method
The oscillator combines four key market measurements into a single, normalized reading:
1. Price-VWAP Deviation: `(Close - VWAP) / VWAP × 100`
2. VWAP-MA Momentum: `(VWAP - MovingAverage) / MovingAverage × 100`
3. Anchored VWAP Strength: Average of high/low anchor deviations from rolling VWAP
4. Range Position: `(Close - PeriodLow) / (PeriodHigh - PeriodLow) × 100 - 50`
Dynamic Signal Line
The signal line uses an EMA that automatically adjusts its length based on your chart timeframe:
- Futures: Always covers 23 hours of trading (1,380 minutes)
- Stocks: Always covers 6.5 hours of trading (390 minutes)
- Examples: 276 periods on 5-min futures chart, 1,380 periods on 1-min futures chart
Trading Signals
🟢 Buy Signals
- Condition: Main oscillator crosses above signal line while below zero
- Logic: Momentum turning bullish from oversold conditions
- Visual: Green "BUY" label below price action
🔴 Sell Signals
- Condition: Main oscillator crosses below signal line while above zero
- Logic: Momentum turning bearish from overbought conditions
- Visual: Red "SELL" label above price action
⚠️ Extreme Warnings
- Extreme Overbought: Red triangle when oscillator crosses above +4.0
- Extreme Oversold: Green triangle when oscillator crosses below -4.0
- Purpose: Risk management alerts, not entry/exit signals
Oscillator Zones
Interpretation Guide
- Above +2.0: Strong bullish momentum zone (green background)
- 0 to +2.0: Mild bullish territory
- 0 to -2.0: Mild bearish territory
- Below -2.0: Strong bearish momentum zone (red background)
- Above +4.0: Extreme overbought (caution advised)
- Below -4.0: Extreme oversold (potential reversal zone)
Customization Options
Moving Average Settings
- EMA/SMA Toggle: Choose between exponential or simple moving average
- Color Customization: Adjust MA line color and width
Visual Controls
- Bullish/Bearish Colors: Customize momentum zone colors
- Signal Line: Toggle visibility and adjust color
- Line Widths: Control thickness of all plot lines
Anchor Modes
- NY Session Only: Anchors reset at NY market open (9:30 AM ET)
- 24H NY Day: Anchors reset at NY calendar day change (midnight ET)
Best Practices
Timeframe Selection
- Scalping: 1-5 minute charts for quick momentum changes
- Day Trading: 5-15 minute charts for clearer trend signals
- Swing Trading: 1-4 hour charts for major momentum shifts
Signal Confirmation
- Wait for crossovers: Don't trade on oscillator position alone
- Respect extreme levels: Exercise caution above +4 or below -4
- Use with price action: Combine with support/resistance levels
Risk Management
- Extreme zones: Reduce position size when oscillator is extended
- Failed signals: Exit quickly if momentum doesn't follow through
- Market context: Consider overall trend direction and market volatility
Technical Specifications
Calculation Components
- Base Length: 1,380 periods (futures) / 390 periods (stocks)
- Signal Line: Dynamic EMA covering one full trading day
- Smoothing: 3-period SMA on raw oscillator (adjustable)
- Update Frequency: Real-time on every price tick
Performance Notes
- Resource Efficient: Optimized calculations minimize CPU usage
- Memory Friendly: Uses incremental VWAP calculations
- Fast Loading: Minimal historical data requirements
Version History & Development
This oscillator evolved from advanced VWAP overlay strategies, transforming complex multi-line analysis into a single, actionable momentum gauge. The indicator maintains the sophistication of institutional VWAP analysis while providing the clarity needed for retail trading decisions.
Core Philosophy
Traditional VWAP indicators show where price is relative to volume-weighted averages, but they don't quantify momentum or provide clear entry/exit signals. This oscillator solves that problem by normalizing all VWAP relationships into a single, bounded indicator that works consistently across all timeframes and asset classes.
---
Open Source License: This indicator is provided free for the TradingView community. Feel free to modify and enhance according to your trading needs.

MYM Edge Booster MYM Long Trading Assistant - ATR-Based Edge Booster
Clean, simple indicator that tells you when MYM long setups meet high-probability criteria. No complicated charts - just clear numbers and signals.
• ATR Targets & Stops (whole numbers)
• Quality Score (0-3 stars)
• Green Circle when conditions perfect
• Warnings for choppy/high volatility
• ES/NQ sector confirmation
Eliminates guesswork. Trade when the green circle appears.

[MCN] Volume Weighted Average PriceStandard VWAP with custom stdv colourings and the ability to anchor by midnight price.
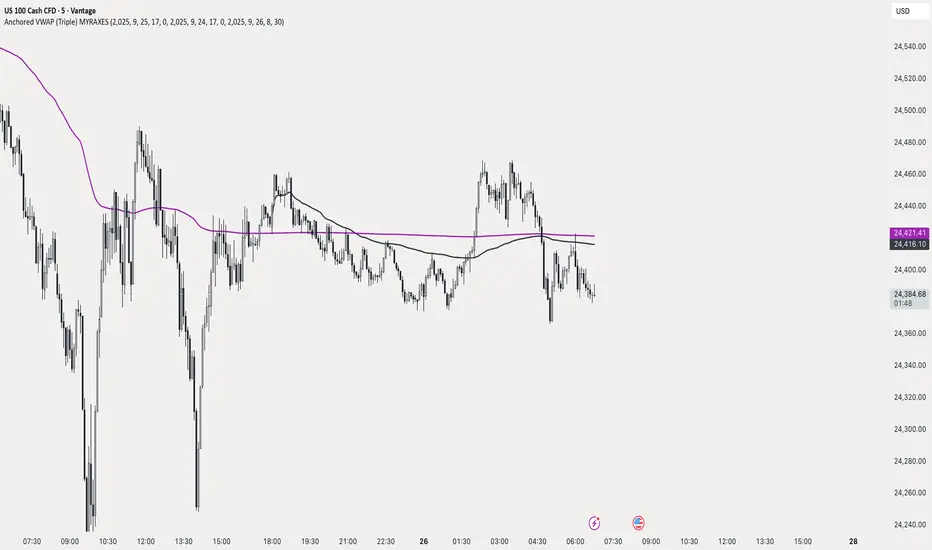
Anchored VWAP (Triple) MYRAXESAnchored VWAP Triple Indicator
The Anchored VWAP Triple indicator is a powerful tool for technical analysis, allowing traders to plot three customizable anchored Volume Weighted Average Price (VWAP) lines on a chart. Unlike traditional VWAP, which resets daily, this indicator lets you anchor each VWAP to a specific date and time, providing a unique perspective on price action relative to key market events.
Features
Three Independent VWAPs: Plot up to three VWAP lines, each anchored to a user-defined date and time.
Customizable Inputs: Set the year, month, day, hour, and minute for each VWAP anchor point. Choose distinct colors for easy identification.
Pure Anchored Design: VWAP lines start only from the anchor point, with no pre-anchor extensions, ensuring a clean and focused analysis.
Debug Mode: Optional display of hour and minute for troubleshooting or educational purposes.
Default Settings: Pre-configured with practical defaults (e.g., September 2025 dates) for immediate use.
How to Use
Add the indicator to your TradingView chart.
Adjust the anchor dates and times for each VWAP (VWAP 1, VWAP 2, VWAP 3) via the input settings.
Select custom colors for each VWAP line to differentiate them on the chart.
Enable Debug Mode if needed to verify time alignment.
Analyze price movements relative to the anchored VWAPs to identify support, resistance, or trend shifts.
Benefits
Ideal for swing traders and long-term analysts who need to anchor VWAP to significant price levels or events.
Enhances decision-making by comparing multiple VWAPs from different anchor points.
Fully compatible with TradingView’s Pine Script v6 for smooth performance.
This indicator is perfect for traders looking to deepen their market analysis with a flexible, multi-VWAP approach. Share your feedback or custom setups in the comments!
Anchored EMA/VWAP### Anchored EMA/VWAP Indicator
**Description:**
The **Anchored EMA/VWAP Indicator** is a powerful and versatile tool designed for traders seeking to analyze price trends and momentum from a user-defined anchor point in time. Built for TradingView using Pine Script v6, this indicator calculates and displays multiple **Exponential Moving Averages (EMAs)**, **Volume-Weighted Exponential Moving Averages (VWEMAs)**, and a **Volume-Weighted Average Price (VWAP)**, all anchored to a specific date and time chosen by the user. By anchoring these calculations, traders can focus on price action relative to significant market events, such as news releases, earnings reports, or key support/resistance levels.
The indicator supports multi-timeframe (MTF) analysis, allowing users to compute EMAs, VWEMAs, and VWAP on a higher or custom timeframe (e.g., 5-minute, 1-hour, daily) while overlaying the results on the current chart. It also includes customizable cross signals for EMA and VWEMA pairs, marked with distinct shapes (circles, diamonds, squares) to highlight potential trend changes or reversals. These features make the indicator ideal for trend-following, momentum trading, and identifying key price levels across various markets, including stocks, forex, cryptocurrencies, and commodities.
**Key Features:**
- **Anchored Calculations**: EMAs, VWEMAs, and VWAP start calculations from a user-specified anchor time, enabling analysis relative to significant market moments.
- **Multi-Timeframe Support**: Compute indicators on any timeframe (e.g., 60-minute, daily) and display them on the chart’s timeframe for flexible analysis.
- **Customizable EMAs and VWEMAs**: Four EMAs and four VWEMAs with adjustable lengths (default: 9, 21, 50, 100) and colors, with options to show or hide each.
- **Volume-Weighted Metrics**: VWAP and VWEMAs incorporate volume data, providing a more robust representation of market activity compared to standard EMAs.
- **Cross Signals**: Visual markers (circles, diamonds, squares) for crossovers between EMA and VWEMA pairs, with customizable visibility to highlight bullish (up) or bearish (down) signals.
- **User-Friendly Interface**: Organized input groups for General, EMA, VWEMA, VWAP, Arrow Settings, and Cross Visibility, with intuitive inline inputs for length and color customization.
- **Visual Clarity**: Overlaid on the price chart with distinct colors and line styles (dotted for EMAs, dashed for VWEMAs, solid for VWAP) to ensure easy interpretation.
**How to Use:**
1. **Set the Anchor Time**: Click a specific bar or enter a date/time (default: June 1, 2025) to start calculations from a significant market event.
2. **Select Timeframe**: Choose a timeframe (e.g., "5" for 5-minute, "D" for daily) to compute the indicators, allowing alignment with your trading strategy.
3. **Customize EMAs and VWEMAs**: Adjust lengths and colors for up to four EMAs and VWEMAs, and toggle their visibility to focus on relevant lines.
4. **Enable VWAP**: Display the anchored VWAP to identify volume-weighted price levels, useful as dynamic support/resistance.
5. **Monitor Cross Signals**: Enable cross visibility for specific EMA or VWEMA pairs to spot potential trend changes. Bullish crosses (e.g., shorter EMA crossing above longer EMA) are marked with green shapes below the bar, while bearish crosses are marked with red shapes above the bar.
6. **Interpret Signals**: Use EMA/VWEMA crossovers for trend confirmation, VWAP as a mean-reversion level, and volume-weighted VWEMAs for momentum analysis in high-volume markets.
**Use Cases:**
- **Trend Trading**: Identify trend direction using EMA and VWEMA crossovers, with shorter lengths (e.g., 9, 21) for faster signals and longer lengths (e.g., 50, 100) for trend confirmation.
- **Mean Reversion**: Use the anchored VWAP as a dynamic support/resistance level to trade pullbacks or breakouts.
- **Event-Based Analysis**: Anchor the indicator to significant events (e.g., earnings, economic data releases) to analyze price behavior post-event.
- **Multi-Timeframe Strategies**: Combine higher timeframe EMAs/VWAPs with lower timeframe price action for high-probability setups.
**Settings:**
- **Anchor Time**: Set the starting point for calculations (default: June 1, 2025).
- **Timeframe**: Choose the timeframe for calculations (default: 5-minute).
- **EMA/VWEMA Lengths**: Default lengths of 9, 21, 50, and 100 for both EMAs and VWEMAs, adjustable per user preference.
- **Colors**: Customizable colors with slight transparency for visual clarity.
- **Cross Visibility**: Toggle specific EMA and VWEMA cross signals (e.g., EMA1/EMA2, VWEMA1/VWEMA3) to reduce chart clutter.
- **Arrow Colors**: Green for bullish crosses, red for bearish crosses.
**Notes:**
- The indicator is overlaid on the price chart, ensuring seamless integration with price action analysis.
- VWEMAs and VWAP are volume-sensitive, making them particularly effective in markets with significant volume fluctuations.
- Ensure the anchor time is set to a valid historical or future bar to avoid calculation errors.
- Cross signals are conditional on non-NA values to prevent false positives during initialization.
**Author**: NEPOLIX
**Version**: 6 (Pine Script v6)
**Published**: For TradingView Community
This indicator is a must-have for traders looking to combine anchored, volume-weighted, and multi-timeframe analysis into a single, customizable tool. Whether you're a day trader, swing trader, or long-term investor, the Anchored EMA/VWAP Indicator provides actionable insights for informed trading decisions.

Foresight Cone (HoltxF1xVWAP) [KedArc Quant]Description:
This is a time-series forecasting indicator that estimates the next bar (F1) and projects a path a few bars ahead. It also draws a confidence cone based on how accurate the recent forecasts have been. You can optionally color the projection only when price agrees with VWAP.
Why it’s different
* One clear model: Everything comes from Holt’s trend-aware forecasting method—no mix of unrelated indicators.
* Transparent visuals: You see the next-bar estimate (F1), the forward projection, and a cone that widens or narrows based on recent forecast error.
* Context, not signals: The VWAP option only changes colors. It doesn’t add trade rules.
* No look-ahead: Accuracy is measured using the forecast made on the previous bar versus the current bar.
Inputs (what they mean)
* Source: Price series to forecast (default: Close).
* Preset: Quick profiles for fast, smooth, or momentum markets (see below).
* Alpha (Level): How fast the model reacts to new prices. Higher = faster, twitchier.
* Beta (Trend): How fast the model updates the slope. Higher = faster pivots, more flips in chop.
* Horizon: How many bars ahead to project. Bigger = wider cone.
* Residual Window: How many bars to judge recent accuracy. Bigger = steadier cone.
* Confidence Z: How wide the cone should be (typical setting ≈ “95% style” width).
* Show Bands / Draw Forward Path: Turn the cone and forward lines on/off.
* Color only when aligned with VWAP: Highlights projections only when price agrees with the trend side of VWAP.
* Colors / Show Panel: Styling plus a small panel with RMSE, MAPE, and trend slope.
Presets (when to pick which)
* Scalp / Fast (1-min): Very responsive; best for quick moves. More twitch in chop.
* Smooth Intraday (1–5 min): Calmer and steadier; a good default most days.
* Momentum / Breakout: Quicker slope tracking during strong pushes; may over-react in ranges.
* Custom: Set your own values if you know exactly what you want.
What is F1 here?
F1 is the model’s next-bar fair value. Crosses of price versus F1 can hint at short-term momentum shifts or mean-reversion, especially when viewed with VWAP or the cone.
How this helps
* Gives a baseline path of where price may drift and a cone that shows normal wiggle room.
* Helps you tell routine noise (inside cone) from information (edges or breaks outside the cone).
* Keeps you aware of short-term bias via the trend slope and F1.
How to use (step by step)
1. Add to chart → choose a Preset (start with Smooth Intraday).
2. Set Horizon around 8–15 bars for intraday.
3. (Optional) Turn on VWAP alignment to color only when price agrees with the trend side of VWAP.
4. Watch where price sits relative to the cone and F1:
* Inside = normal noise.
* At edges = stretched.
* Outside = possible regime change.
5. Check the panel: if RMSE/MAPE spike, expect a wider cone; consider a smoother preset or a higher timeframe.
6. Tweak Alpha/Beta only if needed: faster for momentum, slower for chop.
7. Combine with your own plan for entries, exits, and risk.
Accuracy Panel — what it tells you
Preset & Horizon: Shows which preset you’re using and how many bars ahead the projection goes. Longer horizons mean more uncertainty.
RMSE (error in price units): A “typical miss” measured in the chart’s currency (e.g., ₹).
Lower = tighter fit and a usually narrower cone. Rising = conditions getting noisier; the cone will widen.
MAPE (error in %): The same idea as RMSE but in percent.
Good for comparing different symbols or timeframes. Sudden spikes often hint at a regime change.
Slope T: The model’s short-term trend reading.
Positive = gentle up-bias; negative = gentle down-bias; near zero = mostly flat/drifty.
How to read it at a glance
Calm & directional: RMSE/MAPE steady or falling + Slope T positive (or negative) → trends tend to respect the cone’s mid/upper (or mid/lower) area.
Choppy/uncertain: RMSE/MAPE climbing or jumping → expect more whipsaw; rely more on the cone edges and higher-TF context.
Flat tape: Slope T near zero → mean-revert behavior is common; treat cone edges as stretch zones rather than breakout zones.
Warm-up & tweaks
Warm-up: Right after adding the indicator, the panel may be blank for a short time while it gathers enough bars.
Too twitchy? Switch to Smooth Intraday or increase the Residual Window.
Too slow? Use Scalp/Fast or Momentum/Breakout to react quicker.
Timeframe tips
* 1–3 min: Scalp/Fast or Momentum/Breakout; horizon \~8–12.
* 5–15 min: Smooth Intraday; horizon \~12–15.
* 30–60 min+: Consider a larger residual window for a steadier cone.
FAQ
Q: Is this a strategy or an indicator?
A: It’s an indicator only. It does not place orders, TP/SL, or run backtests.
Q: Does it repaint?
A: The next-bar estimate (F1) and the cone are calculated using only information available at that time. The forward path is a projection drawn on the last bar and will naturally update as new bars arrive. Historical bars aren’t revised with future data.
Q: What is F1?
A: F1 is the indicator’s best guess for the next bar.
Price crossing above/below F1 can hint at short-term momentum shifts or mean-reversion.
Q: What do “Alpha” and “Beta” do?
A: Alpha controls how fast the indicator reacts to new prices
(higher = faster, twitchier). Beta controls how fast the slope updates (higher = quicker pivots, more flips in chop).
Q: Why does the cone width change?
A: It reflects recent forecast accuracy. When the market gets noisy, the cone widens. When the tape is calm, it narrows.
Q: What does the Accuracy Panel tell me?
A:
* Preset & Horizon you’re using.
* RMSE: typical forecast miss in price units.
* MAPE: typical forecast miss in percent.
* Slope T: short-term trend reading (up, down, or flat).
If RMSE/MAPE rise, expect a wider cone and more whipsaw.
Q: The panel shows “…” or looks empty. Why?
A: It needs a short warm-up to gather enough bars. This is normal after you add the indicator or change settings/timeframes.
Q: Which timeframe is best?
A:
* 1–3 min: Scalp/Fast or Momentum/Breakout, horizon \~8–12.
* 5–15 min: Smooth Intraday, horizon \~12–15.
Higher timeframes work too; consider a larger residual window for steadier cones.
Q: Which preset should I start with?
A: Start with Smooth Intraday. If the market is trending hard, try Momentum/Breakout.
For very quick tapes, use Scalp/Fast. Switch back if things get choppy.
Q: What does the VWAP option do?
A: It only changes colors (highlights when price agrees with the trend side of VWAP).
It does not add or remove signals.
Q: Are there alerts?
A: Yes—alerts for price crossing F1 (up/down). Use “Once per bar close” to reduce noise on fast charts.
Q: Can I use this on stocks, futures, crypto, or FX?
A: Yes. It works on any symbol/timeframe. You may want to adjust Horizon and the Residual Window based on volatility.
Q: Can I use it with Heikin Ashi or other non-standard bars?
A: You can, but remember you’re forecasting the synthetic series of those bars. For pure price behavior, use regular candles.
Q: The cone feels too wide/too narrow. What do I change?
A:
* Too wide: lower Alpha/Beta a bit or increase the Residual Window.
* Too narrow (misses moves): raise Alpha/Beta slightly or try Momentum/Breakout.
Q: Why do results change when I switch timeframe or symbol?
A: Different noise levels and trends. The accuracy stats reset per chart, so the cone adapts to each context.
Q: Any limits or gotchas?
A: Extremely large Horizon may hit TradingView’s line-object limits; reduce Horizon or turn
off extra visuals if needed. Big gaps or news spikes will widen errors—expect the cone to react.
Q: Can this predict exact future prices?
A: No. It provides a baseline path and context. Always combine with your own rules and risk management.
Glossary
* TS (Time Series): Data over time (prices).
* Holt’s Method: A forecasting approach that tracks a current level and a trend to predict the next bars.
* F1: The indicator’s best guess for the next bar.
* F(h): The projected value h bars ahead.
* VWAP: Volume-Weighted Average Price—used here for optional color alignment.
* RMSE: Typical forecast miss in price units (how far off, on average).
* MAPE: Typical forecast miss in percent (scale-free, easy to compare).
Notes & limitations
* The panel needs a short warm-up; stats may be blank at first.
* The cone reflects recent conditions; sudden volatility changes will widen it.
* This is a tool for context. It does not place trades and does not promise results.
⚠️ Disclaimer
This script is provided for educational purposes only.
Past performance does not guarantee future results.
Trading involves risk, and users should exercise caution and use proper risk management when applying this strategy.

Ober Trend Oscillator [by Oberlunar]The Ober Trend Oscillator by Oberlunar unifies a volume-weighted view of price with order-flow information in a single, disciplined signal. At its core is a Triple Hull Moving Average applied to the session VWAP. This pairing is intentional: the Hull family is widely used because its quadratic weighting and internal differencing reduce phase lag versus SMA/EMA while preserving a smooth, readable contour; running it on top of VWAP anchors the calculation to a price already “risk-weighted” by volume, which behaves in practice like a microstructural equilibrium level. Around VWAP, the indicator computes standard-deviation envelopes that provide statistical context; excursions to the far band against the prevailing direction often mark probabilistic excess and become the first checkpoint for signal qualification.
The order-flow module is built on a tick-rule Cumulative Volume Delta, the most robust choice when native bid/ask deltas are unavailable. Volumes are signed by up- or down-moves, cumulatively integrated, then smoothed by a configurable EMA. To make the series comparable across instruments and timeframes, the CVD is standardised via an adjustable z-score window. This normalisation matters because it reframes “push” and “exhaustion” as deviations from recent behaviour rather than absolute thresholds tied to each market’s idiosyncratic liquidity. When enabled, a pivot-based divergence engine searches for fresh local highs or lows in price that the CVD refuses to confirm and annotates the symbol Δ with the percentage size of the divergence on price, on CVD, or both. Quantifying divergence avoids binary, eye-ball readings and lets you compare the relative strength of signals over time.
Signal generation follows a two-stage logic. Stage one is regime detection by the THMA on VWAP. The slope of the long THMA defines the primary trend, while the instantaneous difference between the THMA and its own lag sets the “serpentine” colour that conveys the local direction of pressure. Using slope on the longer window is deliberate: trend-following practice shows that slope filters materially reduce false positives in choppy regimes. Stage two enforces contextual alignment between price and higher-timeframe VWAP bands. For a long, the THMA computed on the higher-timeframe VWAP must sit below the current curve and below the second lower deviation, consistent with either a mean-reverting excess or early re-accumulation; shorts are defined symmetrically. Volume-flow confirmation is then required through either a rising CVD, a supportive z-score, or a detected pivot divergence in the same direction. To discourage over-trading, signals alternate by design and a strict colour gate is applied: a green diamond is never printed on a red line and bullish divergences are not drawn when the serpentine indicates bearish pressure. This visual consistency is not cosmetic; it reduces cognitive dissonance between filters and execution signal and improves reading discipline.
Parameters are organised to make these choices explicit. The main THMA length controls the oscillator’s sensitivity to VWAP, while the “trend” and “long-term” lengths drive the slope filter, with the latter acting as the regime anchor. The higher timeframe used to compute THMA on VWAP is the context-alignment knob and enables true multi-period operation, which is essential in fractal markets such as crypto, FX and equity indices. The VWAP deviation multiplier sets the breadth of the statistical bands; values modestly below one are a deliberate default to keep excess detection sensitive without turning the envelopes into a very wide channel. The ATR window that drives the line’s thickness is not a visual gimmick: thickness adapts to volatility and communicates the movement’s energy at a glance, much like an adaptive envelope.
The CVD package offers full control. A dedicated timeframe lets you decouple order-flow estimation from the chart’s timeframe when a slower, more reliable read of pressure is preferred. The calculation mode can reference Close-to-Close for responsiveness or HL2 for slightly greater robustness to closing noise, depending on the instrument’s microstructure. EMA smoothing governs granularity, the slope lookback sets how many observations are required to validate an inflection, and the z-score length defines the statistical horizon for normalisation—longer windows make the signal steadier, shorter windows make it more tactical. The pivot divergence option with percentage sizing grades relevance rather than merely flagging presence. Measuring both the price change between pivots and the CVD change is intentional: the most actionable divergences exhibit not only directionally opposing shapes but also a quantitative mismatch between price and flow; putting the two numbers side by side clarifies whether price is outrunning flow or flow is reversing ahead of price.
On the attached weekly Bitcoin example, the turquoise serpentine highlights impulsive phases while red denotes retracement or distribution. Δ labels with “P:%” and “C:%” mark points where price sets a new extreme without a matching CVD extreme; the percentage annotation helps distinguish a trivial imbalance from a credible exhaustion. Diamonds appear only when their colour agrees with the serpentine, and their location relative to the higher-TF VWAP bands clarifies when the market stops pushing “with volume” and starts pushing “against volume”—often the operational cue that precedes mean reversion or a consolidation before the next impulse.
Three methodological choices deserve emphasis. The THMA-on-VWAP architecture addresses the classic lag-versus-noise trade-off by combining a low-lag smoother with a volume-anchored base series that reflects institutional execution practice. Z-scoring the CVD is consistent with a statistical reading of flow that reasons in deviations from expected behaviour rather than fixed thresholds, which is particularly relevant on assets with shifting liquidity regimes. Finally, the colour gate plus signal alternation mitigates the well-known clustering of false positives in sideways markets: you do not print green on red or red on green, and you do not fire the same direction twice in a row without an opposite transition, which avoids hammering into the same move.
Practical usage is straightforward. Select your trading timeframe and align context with a higher timeframe in the VWAP-THMA; tune the VWAP deviation multiplier to match the instrument’s excess profile; choose an equal or slower CVD timeframe to extract structural pressure; enable divergence sizing when you want to measure, not only see, the gap between price and flow. Signals can also be drawn on the main chart, so next to candles, you will see both the execution diamonds and Δ labels with their percentage sizes. If you work with higher-timeframe inputs via `request.security`, be aware that those series confirm only at their own close; you can require confirmation for both the higher-TF VWAP and CVD timeframes to eliminate any practical repaint. Integrated alerts tied to THMA+VWAP+CVD validation convert discretionary reading into a monitorable workflow consistent with systematic routines.
Known limitations are stated explicitly. Tick-rule CVD is an approximation and, while standard in the absence of native bid/ask deltas, it may diverge from “true” delta on venues with unusual execution dynamics; normalisation helps but does not eliminate this. Pivot divergences depend on swing definition and require sensitivity calibration to avoid over-signalling on erratic markets. By construction, the oscillator favours trending contexts with statistically motivated pullbacks; during prolonged congestion, signals will naturally thin out, and the standardised CVD becomes the primary discriminator.
In sum, the Ober Trend Oscillator is a dual-channel reader: the THMA-on-VWAP line tells you about regime and movement quality, and the normalised CVD tells you about the pressure sustaining that movement. When the two stories align, continuation probability improves; when they diverge, the Δ annotation quantifies the gap and offers an objective basis for judging whether you are seeing a healthy pause or an impending reversal. The integration of volume-weighted price, simple statistics, and order-flow makes the indicator genuinely multi-period, capable of scaling from intraday to swing without changing its visual language or its decision criteria.
Oberlunar 👁️⭐


FlowSpike ES — BB • RSI • VWAP + AVWAP + News MuteThis indicator is purpose-built for E-mini S&P 500 (ES) futures traders, combining volatility bands, momentum filters, and session-anchored levels into a streamlined tool for intraday execution.
Key Features:
• ES-Tuned Presets
Automatically optimized settings for scalping (1–2m), daytrading (5m), and swing trading (15–60m) timeframes.
• Bollinger Band & RSI Signals
Entry signals trigger only at statistically significant extremes, with RSI filters to reduce false moves.
• VWAP & Anchored VWAPs
Session VWAP plus anchored VWAPs (RTH open, weekly, monthly, and custom) provide high-confidence reference levels used by professional order-flow traders.
• Volatility Filter (ATR in ticks)
Ensures signals are only shown when the ES is moving enough to offer tradable edges.
• News-Time Mute
Suppresses signals around scheduled economic releases (customizable windows in ET), helping traders avoid whipsaw conditions.
• Clean Alerts
Long/short alerts are generated only when all conditions align, with optional bar-close confirmation.
Why It’s Tailored for ES Futures:
• Designed around ES tick size (0.25) and volatility structure.
• Session settings respect RTH hours (09:30–16:00 ET), the period where most liquidity and institutional flows concentrate.
• ATR thresholds and RSI bands are pre-tuned for ES market behavior, reducing the need for manual optimization.
⸻
This is not a generic indicator—it’s a futures-focused tool created to align with the way ES trades day after day. Whether you scalp the open, manage intraday swings, or align to weekly/monthly anchored flows, FlowSpike ES gives you a clear, rules-based signal framework.

VWAP + Multi-Timeframe RSI StrategyThis strategy combines VWAP trend direction with confirmation from RSI on a higher timeframe. The idea is to only take trades when both intraday momentum and higher-timeframe trend are aligned, increasing accuracy.
LONG Entry:
Price above VWAP (bullish environment).
RSI on the current timeframe is below overbought (room to rise).
RSI on the higher timeframe (default H1) is above 50 (bullish confirmation).
SHORT Entry:
Price below VWAP (bearish environment).
RSI on the current timeframe is above oversold (room to fall).
RSI on the higher timeframe is below 50 (bearish confirmation).
Exit Rule:
Stop-loss near VWAP.
Take-profit at ~2x risk or when major levels are reached.
Best Timeframes:
Use 15m or 30m chart with H1 RSI for intraday trading.
Use 1H chart with Daily RSI for swing trading.
⚡ The higher-timeframe RSI filter reduces false signals and aligns trades with institutional flow.

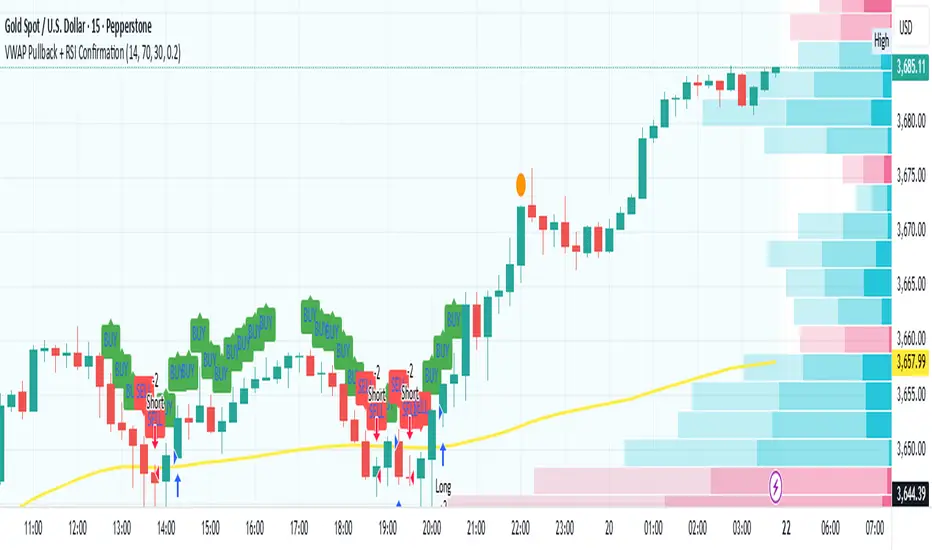
VWAP Pullback + RSI ConfirmationThis strategy focuses on trend continuation entries. Instead of betting on reversions, it looks for opportunities when price pulls back to VWAP but the dominant trend remains intact.
Trend Bias:
Price above VWAP = bullish environment → look for BUY pullbacks.
Price below VWAP = bearish environment → look for SELL pullbacks.
Entry Logic:
BUY: Price pulls back near VWAP, RSI stays above oversold (momentum intact).
SELL: Price pulls back near VWAP, RSI stays below overbought (momentum intact).
Exit Rule:
Stop-loss just below/above VWAP.
Take-profit at 1.5–2x risk (default script uses ~2%).
Best Timeframes:
15m–1H → good for intraday trend-following setups.
Daily → captures stronger, longer trends.
⚡ This strategy is powerful in trending markets because VWAP acts as a "magnet" for pullbacks, while RSI prevents overbought/oversold traps.
VWAP + RSI Strategytesting this method, based on RSI combine with Vwap
there is a buy and sell alert, if you like pls comment it, this is a simple method that can surely adapt to any assets,
Futures Playbook: VWAP + OR + Cross-Asset TellsFutures Playbook: VWAP + OR + Cross-Asset Tells (with Trade Messages + Coach Panel)
This all-in-one futures trading toolkit combines Opening Range (OR) levels, VWAP, and cross-asset signals to help traders quickly read intraday structure, manage execution, and filter noise.
Core Features
• Opening Range (OR):
• Customizable OR window with High/Low and Midpoint.
• Automatic shading of the OR zone.
• VWAP & Bands:
• Built-in or session-anchored VWAP.
• Optional standard deviation bands for context.
• Cross-Asset Tells:
• Live reads on US 10Y yield, DXY, Crude, and Gold.
• Regime detection: rates risk, USD strength, energy softness, and real-rate easing.
• Confirmations:
• Volume vs. moving average filter.
• Cumulative delta with smoothing.
• ATR-based chop filter to avoid low-quality trends.
Trade Messages + Coach Panel
• Trade Messages (labels): Automatic on-chart prompts for OR completion, VWAP reclaim/loss, long/short setups, and EU close flows.
• Coach Panel (table): Real-time dashboard with regime context, directional bias, execution notes, risk reminders, and key levels (ORH, ORL, VWAP).
Alerts
• OR breakout (long/short with confirmations).
• VWAP reclaim or loss.
• 10Y yield crossing risk threshold.
Use Case
Designed for futures traders and scalpers who rely on VWAP + OR dynamics and need cross-asset confirmation before committing to trades. Great for structuring entries, managing risk, and filtering market noise throughout the session.

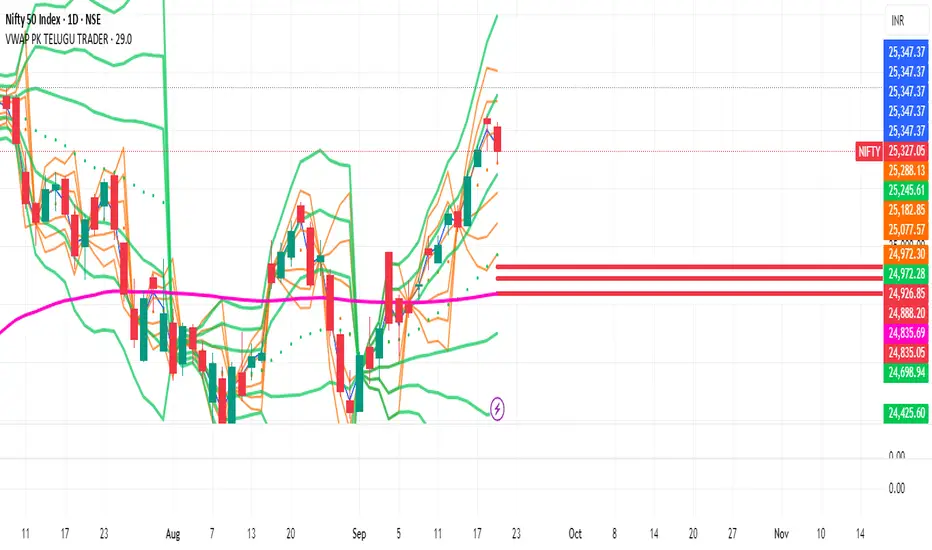
VWAP Bands by PKTELUGUTRADERThe VWAP bands are like moving-average bands, but instead of being based on a simple or exponential moving average, they are calculated around the Volume Weighted Average Price (VWAP).
UPDATED LINE COLORS