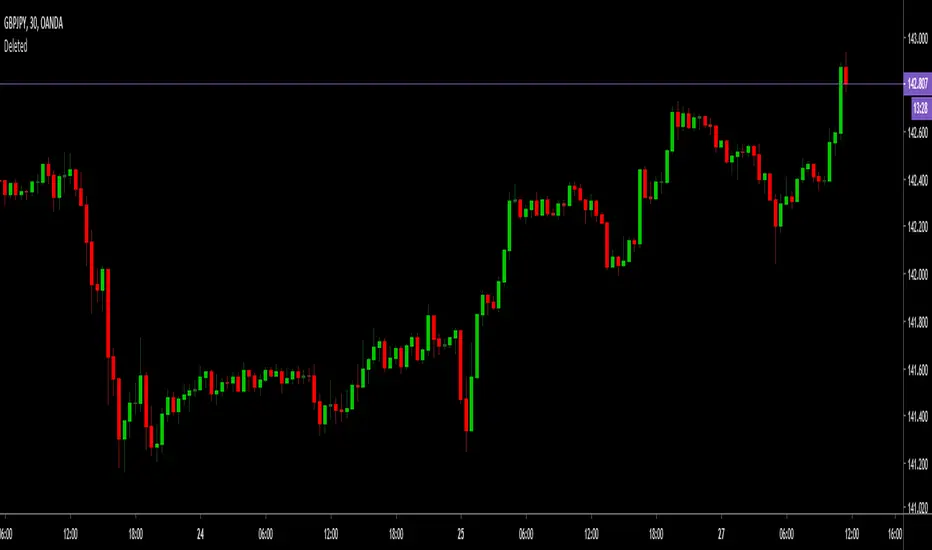
Wave Trend w/ VWMA overlayThis is a trend-following strategy and indicator which combines the Wave Trend Strategy (Lazy Bear) by thomas.gigure with the cRSI + Waves Strategy with VWMA overlay by Dr_Roboto .
You may update the parameters of the Wave Trend oscillator or the VWMA indicator to match your own preferences. You may also adjust the Base Quantity used for determining trade size (as described below) to suit your account size and risk tolerance.
The strategy identifies potential signals based on the on the Wave Trend oscillator, originally ported to TradingView by LazyBear. When a signal is produced by the Wave Trend oscillator, trade size is determined by the VWMA.
When the VWMA is trending against the direction of the Wave Trend signal, Base Quantity x 1 is used
When the VWMA is trending neutral, Base Quantity x 2 is used
When the VWMA is trending with the direction of the Wave Trend signal, Base Quantity x 4 is used
The strategy includes the ability to limit trade signals to certain defined periods of time ("Sessions") during the trading day and, optionally, to close any open position at the end of either or both "Sessions." This may be enabled/disabled via the Limit Signals to Trading Sessions? option on the "Inputs" tab of the strategy's "Settings" window.
If you are trading on a daily chart (or longer) you must disable the Limit Signals to Trading Sessions? in order for the strategy to produce signals.
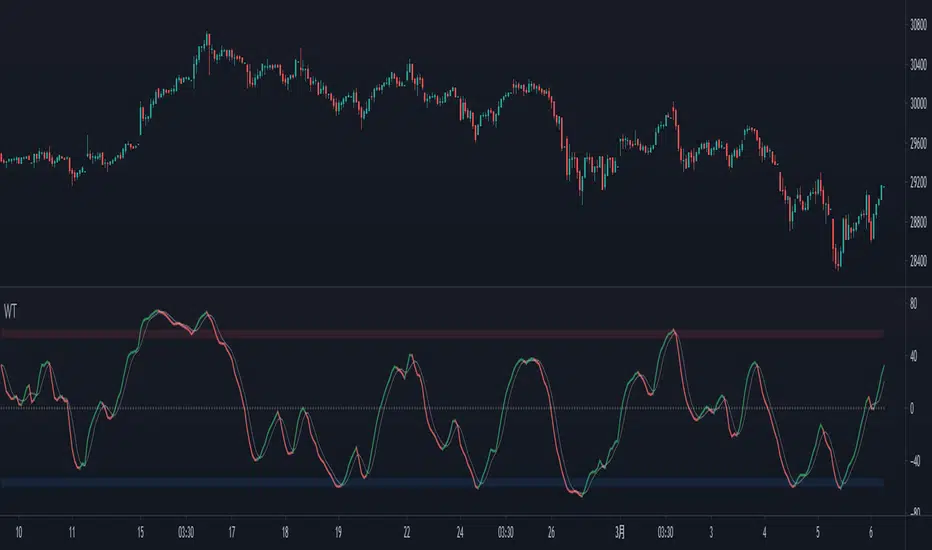
Wavetrend

MarketVision BWith Special Thanks to Everyone who has gone before me, and who have both allowed me given me permission to bring my version of Market Cipher to the World
Especially LazyBear for his amazing Wave Trend Oscillator and for Aevir, falconCoin, vumanchu, Crypto_Spike and others who have freely brought MarketCipher to the Tradingview Community
Also special mention to RicardoSantos for his Divergence script
MarketVision B - My take on MarketCipher B / Market Cipher B, Ive just put outlines on the Wave Trend to add to the Visual Appeal and Added a Trend Meter and a few more options for the Oscillators
Nice To Look At
Oscillator 1 Choose Between - RSI, MFI and Ultimate Oscillator
For Stochastics Choose Between Standard and RSI Stochastics and for the source you can choose On Balance Volume
Wave Trend
Money Flow
Trend Meter & Signals Bar
Divergences are marked, However they are easy to spot and it is better to train your eyes to spot them before the indicator marks them out
Lots of Alerts and Loads of ways to trade using MarketVision
PS: You can make this look like the original by adjusting the parameters in the menu

Simple Wave Trend Wave Trend Oscillator with minimal functionality.
- Change color by crossing
- Overboughtr and Oversold band
- Zero line
WaveTrend Simple Chart [NinjaDawgz]This is a chart version of my WaveTrend Simple Oscillator (). Its been adapted visualize most of the basic and intermediate interpretations, patterns and signals found in the Oscillator.
Quality of life and simplicity was the goal here... no need to squint at the oscillator and lookup at the bars, now the signals are plotted on the chart for easy interpretation. Additionally, a bunch of alert conditions have been created to help you know when signal occurs as soon as it occurs. I recommend using "on bar close" for any alerts as the signal is not true until the bar closes.
Personally, I only use the "Wave Reset MFI" signals but SMA and a combination of both SMA+MFI variations are coded there as well. Hide the variations you don't use to keep the chart clean.
Use this in conjunction with nearly any other form of analysis, especially Wave Theory, to get a powerful trading strategy. This is inherently biased to trading with momentum as its an easier and safer trade. Wave Bounce signals are reversal signals and can have brilliant timing but as with any attempt at picking tops and bottoms, you do get more false positives. Good money management and trade management will be extraordinarily helpful here, with most signals averaging approximately 1:3 risk/reward.
If you like this script let me know, I'd love to know how you use it with your own strategies :)

WaveTrend Oscillator v2 [Aspenforest]This is your regular WaveTrend Oscillator, which was originally scripted by LazyBear, but I updated the source code to Pine Script version 4, refactored the logic, and made the indicator more aesthetically pleasing.

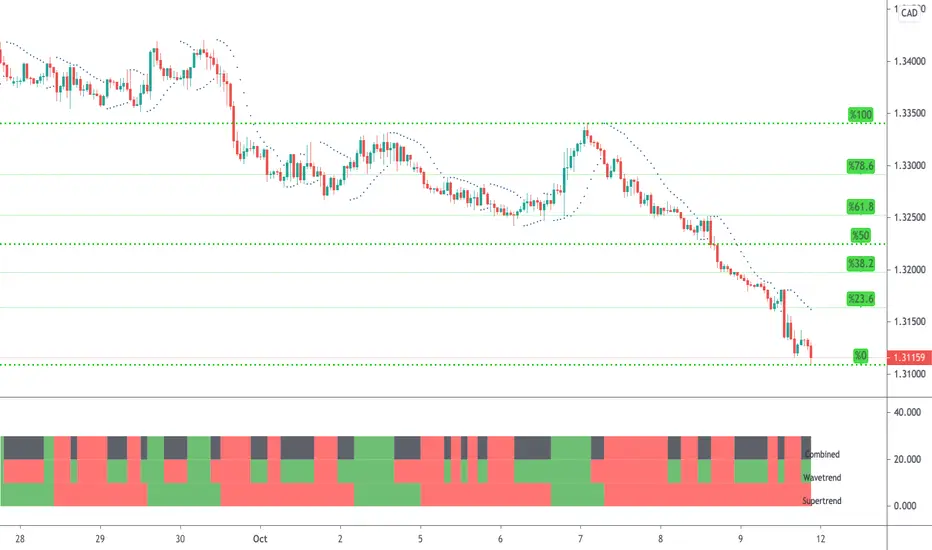
WaveTrend & Supertrend Comparison/CombinedThis compares two reasonably reliable strategies and shows where they are in agreement.
When the top line is GREEN - Then consider BUYing
When the top line is RED - Then consider SELLing
There are also alerts available.
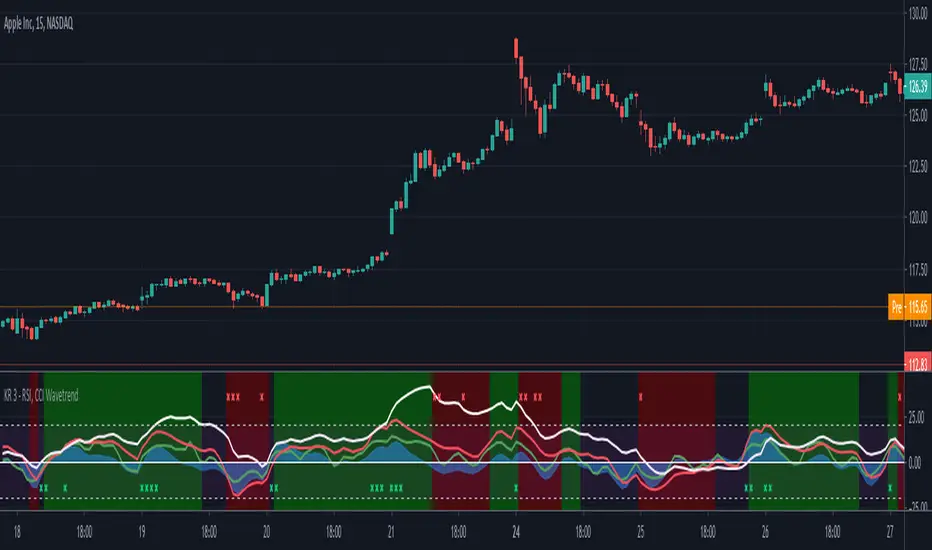
RSI, CCI WaveTrend God by Keiron RichieThis script uses Relative Strength Index ( RSI ), Commodity Channel Index ( CCI ) and WaveTrend (WT) together as an oscillator with an additional custom RSI rate of change indicator and buy/sell background color zones derived from a complex combination of these indicators.
The White line shows the moving average of RSI as an oscillator
The Green line is the fast Exponential Moving Average ( EMA ) of CCI & the Red line is the slow EMA of CCI .
The Blue area is the EMA of WaveTrend WT
How to read:
If the RSI , CCI or WT crosses above a programmed threshold and the other lines are also within a pre-defined buy range then the background will change to green for buy.
If the RSI , CCI or WT crosses below a programmed threshold and the other lines are also within a pre-defined sell range then the background will change to red for sell.
Where requirements are not met, the background is neither green nor red.
There are also red and green indicator x’s at the top/bottom of the indicator. They show a drastic change in Relative strength within a short period. This often indicates an immediate buy or sell opportunity.
Buy, Sell, Exit Buy and Exit Sell alerts are included.
Use the link below to obtain access to this indicator.
WaveTrend+ Strategy [SystemAlpha]This is a WaveTrend strategy based on WaveTrend Oscillator. In addition to using the normal crossovers, we use trend filters, trailing stop loss and take profit targets. WT+ Strategy was developed for crypto, forex and stocks for 15 minutes to daily timeframe. The main goal was to catch long term trends and ride them.
In this strategy you have a choice of:
Trend Filters:
- Average Directional Index (ADX) – buy when price is trend is up and sell when trend is down.
- Moving Average (MA) – buy when price close above the defined moving average and sell when price close below moving average
- Parabolic SAR – buy when SAR is above price is above price and sell when SAR is below price.
- All - Use ADX, MA and SAR as filters
For MA Filter , you can use the “TF MA Type” and "TF MA Period" parameter to select Simple or Exponential Moving Average and length.
Stop Loss:
- Average True Range (ATR) – ATR % stop as trailing stop loss.
- Parabolic SAR (SAR) – Parabolic SAR adapted as trailing stop loss.
For ATR , you can use the “ATR Trailing Stop Multiplier” parameter to set an initial offset for trailing stop loss.
Take Profit Target:
- Average True Range (ATR) – ATR % stop as trailing stop loss.
- Standard % – Percent as target profit
For ATR , you can use the “ATR Take Profit Multiplier” parameter to set an initial offset for trailing stop loss.
Additional feature include:
- Regular and Hidden Divergence display and alerts
- Filter Overbought and Oversold
- Use WT Cross for Exit
STRATEGY ONLY:
- Set backtest dates
- Set Trade direction - Long, Short or Both
- Use timed exit - Select method and bars
- Method 1: Exit after specified number of bars.
- Method 2: Exit after specified number of bars, ONLY if position is currently profitable.
- Method 3: Exit after specified number of bars, ONLY if position is currently losing.
TradingView Links:
WT+ Oscillator Companion:
WT+ Alerts:
How to use:
1. Apply the script by browsing through Indicators --> Invite-Only scripts and select the indicator
2. Once loaded, click the gear (settings) button to select/adjust the parameters based on your preference.
3. Wait for the next BUY or SELL signal to enter the trade!
Disclaimer:
The indicator and signals generated do not constitute investment advice; are provided solely for informational purposes and therefore is not an offer to buy or sell a security; are not warranted to be correct, complete or accurate; and are subject to change without notice.

WaveTrend+ Alerts [SystemAlpha]This is the alert companion of the WaveTrend+ Strategy . Instead of using just the normal crossovers, we use trend filters, trailing stop loss and take profit targets. WT+ Strategy was developed for crypto, forex and stocks for 15 minutes to daily timeframe. The main goal was to catch long term trends and ride them.
In this alert you have a choice of:
Trend Filters:
- Average Directional Index (ADX) – buy when price is trend is up and sell when trend is down.
- Moving Average (MA) – buy when price close above the defined moving average and sell when price close below moving average
- Parabolic SAR – buy when SAR is above price is above price and sell when SAR is below price.
- All - Use ADX, MA and SAR as filters
For MA Filter , you can use the “TF MA Type” and "TF MA Period" parameter to select Simple or Exponential Moving Average and length.
Stop Loss:
- Average True Range (ATR) – ATR % stop as trailing stop loss.
- Parabolic SAR (SAR) – Parabolic SAR adapted as trailing stop loss.
For ATR , you can use the “ATR Trailing Stop Multiplier” parameter to set an initial offset for trailing stop loss.
Take Profit Target:
- Average True Range (ATR) – ATR % stop as trailing stop loss.
- Standard % – Percent as target profit
For ATR , you can use the “ATR Take Profit Multiplier” parameter to set an initial offset for trailing stop loss.
Additional feature include:
- Regular and Hidden Divergence display and alerts
- Filter Overbought and Oversold
- Use WT Cross for Exit
TradingView Links:
WT+ Oscillator:
How to use:
1. Apply the script by browsing through Indicators --> Invite-Only scripts and select the indicator
2. Once loaded, click the gear (settings) button to select/adjust the parameters based on your preference.
3. Wait for the next BUY or SELL signal to enter the trade!
Disclaimer:
The indicator and signals generated do not constitute investment advice; are provided solely for informational purposes and therefore is not an offer to buy or sell a security; are not warranted to be correct, complete or accurate; and are subject to change without notice.

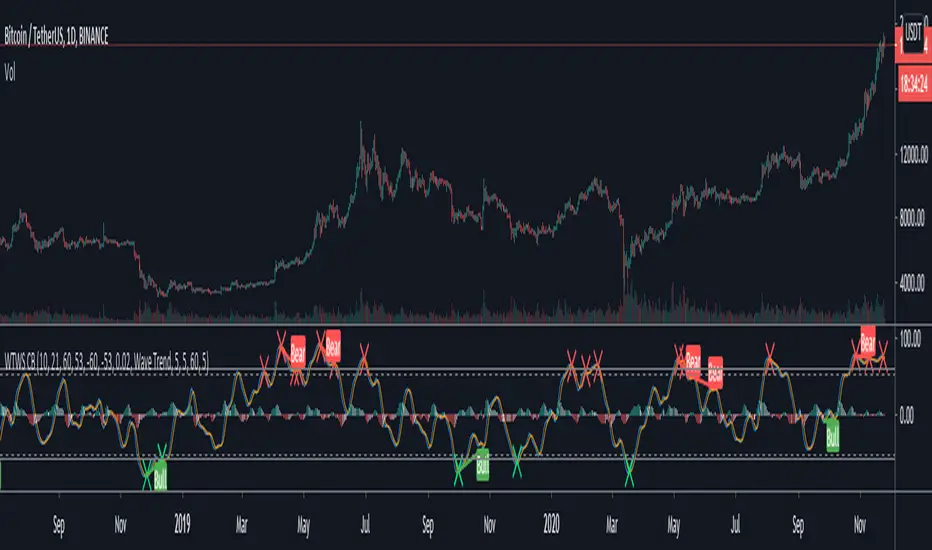
WaveTrend [LazyBear] vX by DGTDGT interpreted version of LazyBear's WaveTrend, visualizing on Price Chart
Original Author : LazyBear
Crosses above or below threshold are emphasized with bigger labels
- crosses above threshold : probable short indications with a bigger label and relativly small label for probable long indications
- crosses below threshold : probable long indications with a bigger label and relativly small label for probable short indications
All rest crosses within threshold boundaries with relatively small labels for both long and short probable indications

MultiWave v2 | CryptoProToolsThis is a release highly requested in our Discord server.
Finally we have an update / official release of our original MultiWave indicator
On top of the standard signals (displayed as the dots on chart) and alerts we now also have "trend signals" with various options (displayed as the triangles on chart).
These new trend signals still use the same multi wave algorithm but trigger differently for some quite nice results.
Also added the option for smoothing on all three wave plots. There are 10 levels of smoothing to choose from and each plot can be tuned with different levels of smoothing.
For access and further information about this or any of our other indicators please click the link to our website below.

Frontrow SniperThe Sniper indicator combines various indicators together in an effort to predict accurate money making signals. The indicator lets you know when to long or short. So that your trades are spot on and there is no more need for FOMO. The Sniper indicator is the secret weapon you need to give you an edge to win in this market.
Frontrow Sniper is an all-in-one oscillator, allowing for more quality indications on your chart. It combines five well known algorithms (VWAP, MFI, RSI, Stochastic RSI, Wave Trend) which have all been fine-tuned for optimal results. When all of these indicators converge, sniper projects a green dot buy signal. The green dot is characterized by extreme sell momentum. In other words, it tells you to long when price is at the bottom. Making it extremely powerful.
the indicator is a wavetrend indicator
Whenever the 2 lines converge on each other a red sell signal or green buy singal will be created.
When the market is really overbought/oversold it will create a big buy or sell signal

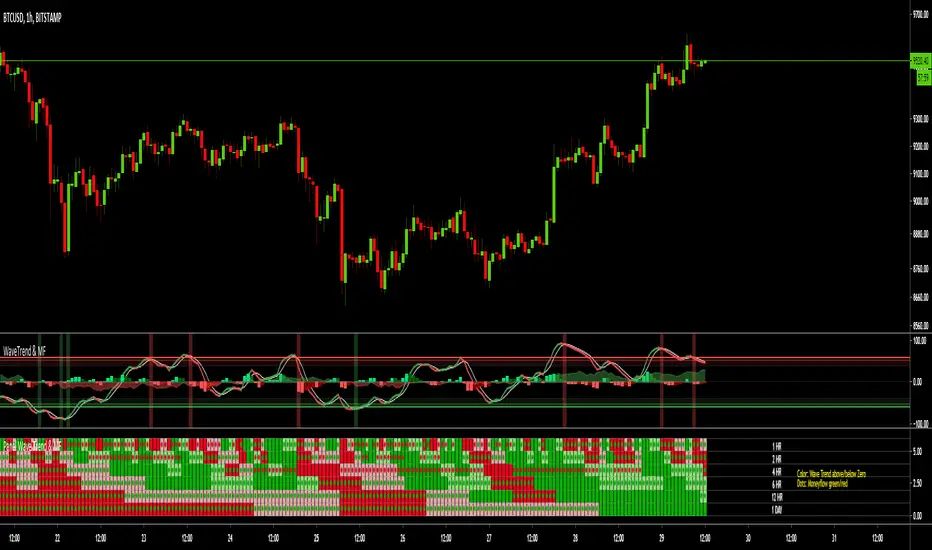
MTF Wave Trend & Money Flow - Monitoring PanelAnother indicator based on the famous "Wave Trend Oscillator" by LazyBear.
Monitoring panel showing the Wave Trend as color for 6 different timeframes. Additionaly the Money Flow (positive or negative) is indicated as green or red dots.
I find it helpful that with one glance the current Wave Trend and Money Flow on many timeframes is visible.
(Timeframes can be changed, but the description labels are currently hardcoded - if you want to change it, just copy the script and change them)
Meanings of the Colors:
WT above Zero and rising : Dark Green
WT above Zero and declining : Light Green
WT below Zero and declining : Dark Red
WT below Zero and rising : Light Red
Money flow positive : Green dot
Monet flow negative : Red dot
(Currently there are two additional timeframes commented in the code - if you want to use them, just copy the script and uncomment them)
Have fun and as always I am open for constructive feedback.
Cheers!
MTF Wave Trend CrossThis indicator is based on the famous "Wave Trend Oscillator" by LazyBear.
I have noticed that the Wave Trend Crosses (not the waves themselves) give a pretty good indication on the current status of the market (above Zero = bullish / below Zero = bearish ).
This new indicator is a Multi TF Version of this where it is possible to define 4 fixed Higher Time Frames and 4 fixed Lower Time Frames.
The results are then plotted above (higher TF) and below (lower TF) of the result of the current TF. (Offset can be flexibly changed in the settings)
This allows to judge the trend based on the various TFs.
Basically the greener it looks, the more bullish the situation is at the moment. More red color indicates a more bearish situation.
Enjoy.

WaveTrend Oscillator w/ Short/Long/Close Alerts - WIPHigh TFs work best, but it works on any TF. I plan to continue releasing updates to it to improve overall form and function. Green Circles are Long Alerts, Red Circles are Short Alerts. Blue and Yellow Circles are Close Position Alerts. First Blue Circle After Red Circle would be Short Exit. First Yellow Circle After Green Circle would be Long Exit.
Original script was based on Lazybear Indicator-WaveTrend-Oscillator-WT Script. I have added and modified some code to my personal liking.

WaveTrend Simple Oscillator [NinjaDawgz]Building on my previous I've attempted to distill everything down into its simplest form. All you need is to understand what the oscillator is telling you!
Oscillator line crosses will trigger a signal and are colored in the respective direction for clarity.
At its very basic usage, you can sell signals once they're oversold/overbought. Anything above/below the double lines are considered extreme. Using money management and standard trading techniques, like waiting for price to break the high/low of the triggering bar, will yield significant risk:reward ratio's that are profitable.
More advanced usage are using pattern recognition for both reversal and continuation signals. Any pair of opposite signals within a few bar's are powerful continuation signals.
Highly advanced usage is to find Elliot Wave patterns (mainly corrective patterns like flats but any pattern) in the oscillator itself, as well as leveraging the oscillator to identify corrections on chart. Finally, the oscillator will give you the (sub)pattern completion by printing a signal on oscillator.
This works for any security on any timeframe.

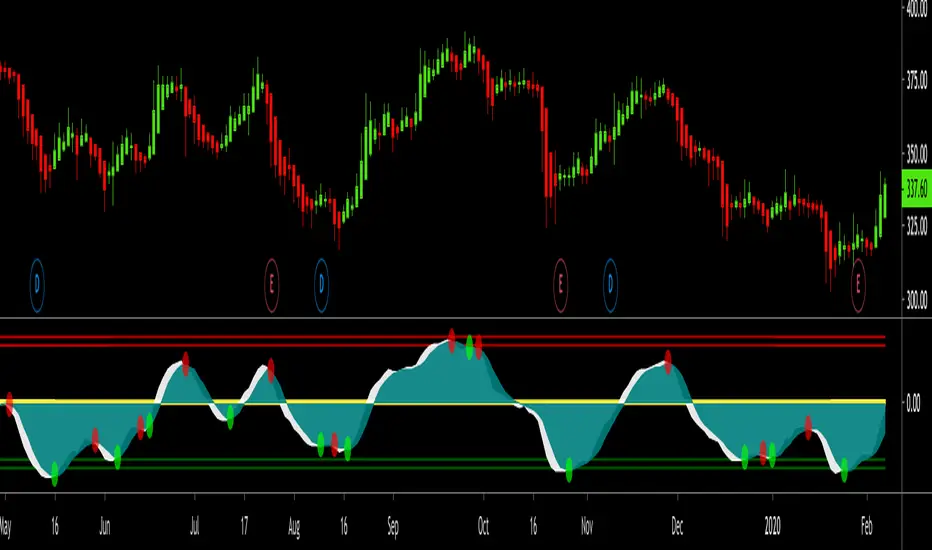
Swing Trade Pros - Wave Trend IndicatorThe STP Wave Trend Indicator allows you to catch big trends before they start by confirming the direction and momentum in real-time. This indicator can be used across all assets on any timeframe. When the oscillator (white area) crosses down the signal (green area), it is a good SELL signal. Similarly, when the oscillator crosses above the signal it is a good BUY signal. Another strategy is to buy when the oscillator crosses the oversold area and sell when it crosses the overbought area
Hashem WaveTrendHASHEM WAVETREND
This indicator is mixture of 4 types of WaveTrends with proper SMA and EMA Smoothings. When the Blue wave crosses the purple wave and if they are in the Lower or Higher Zones, that could be a setup. Also, Customized Godmode with 2 settings and Divergences on Purple Wave are included.
When an Orange Triangle shows up it means the setup is quite powerful.
This can be used on any timeframes and any markets. Don't forget always Higher TF = More Weight and Don't be greedy in CounterTrends .
Besides, VWAP (the difference between the two waves) is plotted. When the Yellow wave is high and near the Fibo levels, It means the trend is just started OR it's near the end.
This indicator is powerful in Swings , Scalpes and Trends on any timeframe, but when the price is ranging in a very tight range , the signals often would be false. So be careful about tight ranges .
Note That The Signals are NOT Confirmed. You must Confirm them with your own TA.

Parametric Oscillator (Zeiierman)█ Overview
The Parametric Oscillator (Zeiierman) transforms price movement into a structure-aware momentum field, a flowing wave of oscillator-candles wrapped around a smooth Quick Price Action line. Instead of reading raw closes, it constructs a multi-lane view from open, high, low, and close data to capture how price pressure expands, contracts, and shifts through time. These relationships are then projected into a bounded oscillator domain, creating a dynamic visualization of momentum and market balance.
The oscillator-candles flip green or red to signal shifts in buying or selling strength, while the Quick Line tracks underlying momentum on a 0–100 scale. Together, they reveal where pressure is forming, how quickly it’s changing, and whether that change is sustainable, helping traders spot momentum swings, stretched zones, and directional bias across any timeframe.
⚪ What Makes It Unique
The oscillator’s uniqueness lies in how it constructs and interprets price structure. It builds four independent lanes of open, high, low, and close to measure wave relationships and capture micro-drift, wick aggression, and full price behavior rather than relying solely on closing data.
Beneath the surface, the oscillator runs on a balanced motion function that translates market volatility into a clear rhythm of momentum and structure. Each change in color and gradient reflects the balance between acceleration and stability, revealing the underlying pulse of market behavior.
█ Main features
⚪ Parametric Oscillator
The Parametric Oscillator turns market movement into a visual map of buying and selling pressure. Its oscillator-candles reveal how momentum builds, compresses, and releases, showing the balance between strength and exhaustion in real time. As candles shift color and gradient, traders can instantly read acceleration, fading energy, or volatility spikes, allowing for quick interpretation of trend health and potential reversals.
The display captures both immediate bursts of momentum and the underlying trend’s persistence, giving a continuous view of how pressure evolves across market phases. It can be used to spot areas of buildup before breakouts, early signs of compression before expansion, and the transition points where control shifts from buyers to sellers.
⚪ Quick Price Action
The Quick Price Action line provides a smooth, real-time read of market momentum that often shifts before price itself reacts. Acting as a leading momentum gauge, it highlights subtle changes in strength and direction, helping traders anticipate moves rather than chase them.
When the line begins to turn, it frequently does so well ahead of price, signaling acceleration, exhaustion, or an early phase of reversal. A rise toward higher levels reflects building bullish pressure, while a downturn from elevated zones shows fading strength or emerging sell bias.
It adapts smoothly across symbols and timeframes, the Quick Price Action line gives traders a consistent, early warning system and a clear visual cue of when momentum is starting to shift and where the next meaningful move may form.
█ How to Use
⚪ Trend Following
The Momentum Candle Line helps define the underlying directional bias by measuring the strength and persistence of momentum. When momentum holds above or below the midline (50), it reflects whether buyers or sellers maintain control of the trend. Watching how the candles form relative to that level helps identify continuation or potential shifts in direction.
Maintain a bullish bias when the Momentum Candles stay above 50 and candles form higher lows.
Maintain a bearish bias when they stay below 50 and candles form lower highs.
⚪ Detect Leading Momentum
The Quick Price Line helps identify leading momentum moves that often precede price action. These can signal the start of a new move in that direction or the early stages of a reversal.
When the Quick Line peaks above 80, it indicates strong positive momentum.
When it peaks below 30, it signals strong negative momentum.
By observing how the momentum candles behave around these levels, traders can determine whether the move is likely a continuation or a reversal.
⚪ Fading Price Moves
Momentum drives price to new highs and lows, but when that momentum fades, reversals often follow. The Quick Price Line or the Parametric Oscillator candles can reveal weakening momentum before price reacts, giving traders an early signal. When the Quick Line peaks and then begins to fade, it indicates that momentum is losing strength. This can precede a pause, a range, or a full reversal in price. Likewise, if the Parametric Oscillator starts to fade while price continues to move, it suggests that momentum is weakening and a reversal or pullback may be approaching.
█ How It Works
⚪ Dual-Lane Displacement
Price is decomposed into trend and fast components across the open, high, low, and close. These relationships form four signed streams that describe body drive and wick aggression.
Calculation: Builds relative spreads between the trend and fast components, creating a multi-dimensional price-flow state.
⚪ Parametric Mapping
Each data stream is passed through a parametric transform (defaulting to a momentum-sensitive map) and assembled into synthetic OHLC in oscillator space.
Calculation: Applies a state transform over the data, aggregates into oscillator OHLC, and exponentially smooths for stability.
⚪ Quick Price Action
A companion line extracts recent trend displacement, normalizes it in a rolling window around the local mid, and passes it through a smoothing process controlled by Price Trend (softness). This yields a stable 0–100 scale that reacts quickly yet remains consistent across assets and timeframes.
Calculation: Windowed normalization around a dynamic midpoint with adjustable softness to balance responsiveness and stability.
-----------------
Disclaimer
The content provided in my scripts, indicators, ideas, algorithms, and systems is for educational and informational purposes only. It does not constitute financial advice, investment recommendations, or a solicitation to buy or sell any financial instruments. I will not accept liability for any loss or damage, including without limitation any loss of profit, which may arise directly or indirectly from the use of or reliance on such information.
All investments involve risk, and the past performance of a security, industry, sector, market, financial product, trading strategy, backtest, or individual's trading does not guarantee future results or returns. Investors are fully responsible for any investment decisions they make. Such decisions should be based solely on an evaluation of their financial circumstances, investment objectives, risk tolerance, and liquidity needs.

Wave Trend With Signals [ChuckBanger]A wave trend script based on LazyBears script but with added signals and a histogram...
High-Low- Signal (Expo)High-Low-Signal (Expo)
DESCRIPTION
This simple but powerful High-Low indicator plots price extremes. Either it’s an exhausting sign or a continuation sign of the trend. The color of the cloud determines the trend, and the height of the peaks determines the strength in the price moves. You can easily compare current peaks with historical ones to understand the current dynamics and what might happen next.
This indicator is a must if you want to understand price dynamics in the market. The indicator is perfect to combine with other indicators to confirm the signal.
For example:
Combine it with trend lines/Channels/Bollinger Band, you name it! If the indicator peaks in conjunction with that the price reaches a trend line/Channels/Bollinger Band. It's a great sign!
HOW TO USE
1. Look for a signal
2. Identify the color and height of the peak. Compare it to historical ones to get an understanding of the current market dynamics.
3. Combine the indicator with e.g. trend lines/Channels/Bollinger Band
4. Consider Enter the market.
INDICATOR IN ACTION
BTCUSD
BTCUSD
BTCUSD
Wall Street
EURJPY
EURUSD
GOLD
I hope you find this indicator useful , and please comment or contact me if you like the script or have any questions/suggestions for future improvements. Thanks!
I will continue to work on this indicator, so please share your experience and feedback with me so that I can continuously improve it. Thanks to everyone that have contacted me regarding my scripts. Your feedback is valuable for future developments!
ACCESS THE INDICATOR
• Contact me on TradingView or use the links below
-----------------
Disclaimer
Copyright by Zeiierman.
The information contained in my scripts/indicators/ideas does not constitute financial advice or a solicitation to buy or sell any securities of any type. I will not accept liability for any loss or damage, including without limitation any loss of profit, which may arise directly or indirectly from use of or reliance on such information.
All investments involve risk, and the past performance of a security, industry, sector, market, financial product, trading strategy, or individual’s trading does not guarantee future results or returns. Investors are fully responsible for any investment decisions they make. Such decisions should be based solely on an evaluation of their financial circumstances, investment objectives, risk tolerance, and liquidity needs.
My scripts/indicators/ideas are only for educational purposes!

Hashem Helper -TwoHashem Helper Two
This Indicator contains many indicators and mixture of them.
RSI+MFI = Green and Red Cloud (Above 0 is Green, Below 0 is Red)
StochRSI (K = Aqua, D = Purple)
WaveTrend (Not shown directly but used in the bigger Aqua and Purple Cloud Waves)
VWAP (Volume-Weighted Average Price) = Yellow Cloud Around 0 Line.
The Blue WaveCloud ( which is a Fast Momentum ) and the Purple WaveCloud ( which is Slow Momentum ) is the result of the mixture.
Basically when Fast Wave crosses the Slow Wave, It's a setup and the price momentum is probably going to follow the wave as a "Probable Signal". (when cross happen, a Red or Green Circle is plotted on the 60 or -60 Line)
The idea here is that you are looking for a big momentum wave( Purple Cloud ), followed by a smaller trigger wave ( Blue Cloud ).
In addition the Divergences on StochRSI and RSI and WaveCloud are analyzed. This indicator shows Normal Divergences (R) and Hidden Divergences (H) on itself. But the point is YOU with your TA should must that. So it's NOT an "Absolute Signal". Human eye is needed to interpret the false and true signals.
Divergences on StochRSI and WaveClouds are shown with actual Green/Red Lines (R/H) and on RSI are shown with Shapes on the its line.
Bullish Divergence = Aqua Triangle
Hidden Bullish Divergence = Aqua Circle
Bearish Divergence = Purple Triangle
Hidden Bearish Divergence = Purple Circle
When you see these shapes on the RSI , it tells you: Hey, Watch the RSI and Price, A Divergence could be there but it's not confirmed. you need to confirm it with your own TA.
Note that this is a Helper Indicator, NOT a Short/Long Signal Indicator. This should be used alongside with your TA.

Hashem Helper -OneHashem Helper One
This indicator is mixture of WaveTrend and RSI with EMA Crosses.
There are 8 EMA (Ribbon) which in confluence of RSI and WaveTrend gives shapes above the candles.
SHAPES:
Red Diamond = Bearish Momentum in the trend.
Orange Cross = Probability of the following candles to be reverse back to the candle which has orange cross above it, is High. (Current price likely doesn't match up with the Statistics)
Purple Cross = Bearish Indication on the Candle. ( Should be used in confluence of other Indications)
Aqua Circle = Bullish indication. (Based on EMA Crosses)
Purple Circle = Bearish Indication. (Based on EMA Crosses)
Blue Triangle = The EMA Ribbon is Recovering. Basically means a Probable Trend Change.
Note that this is a Helper Indicator, NOT a Short/Long Signal Indicator. This should be used alongside with your TA.