Week

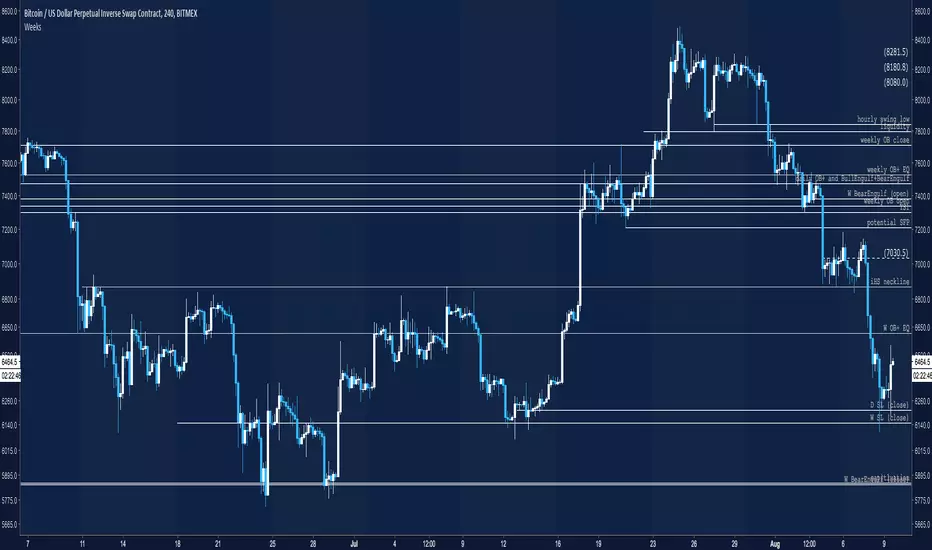
Bitstamp BTC Horizontal 200 Week SMAsmall change to my horizontal 200 week SMA script.
Plots the latest 200 week SMA value from Bitstamp BTCUSD on the chart. I use it for the Bitmex chart, as Bitmex doesn't have enough history for a 200 week moving average.

Horizontal 200 Week SMAfor horizontal level traders that don't want to disregard the 200 week SMA.
Plots a horizontal line for the latest 200 week SMA value in lieu of a wavy line.
Open the indicator's settings and check the "Price Line" box for max visibility

52WLow - 52 Week Low 52WLow - Plot the moving 52week low of the stocks daily price. Great for giving warning when a stock is close or about to break down to a new low. Best is used with a light red shading below line.
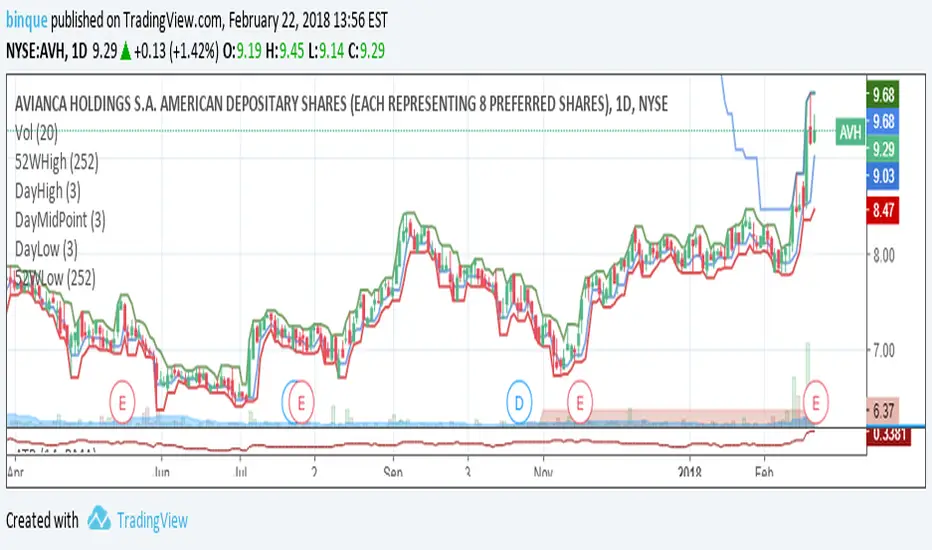
52 Week High/Low52 Week High / Low Indicator
A simple, unobtrusive indicator that can be used on any timeframe to display the 52 week high/low values.
Features
Works on any timeframe.
Unobtrusive: Simple horizontal lines showing only the current 52 week values.
Allows the user to select whether to calculate the 52-week values from candle close values or the respective highs/lows.
For full overview and code commentary - Visit the backtest-rookies website.


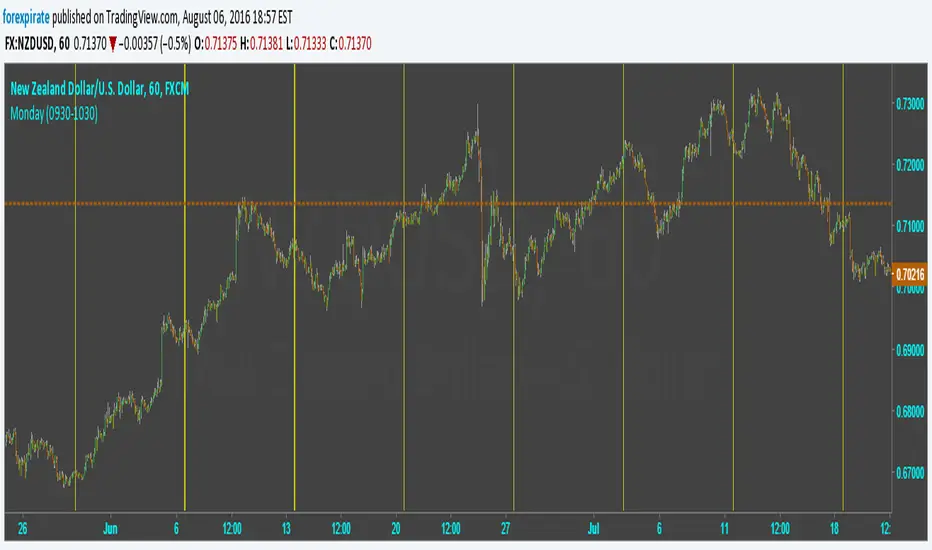
Week of the Year indicatorSimple time indicator showing weeks of the year. Acts to help you define the greater perspective of time on your charts. You can overlay it on the entire chart or use it small and consolidated like I prefer it.
Easiest to configure colors in the script itself and then leave transparency values untouched:
q1w1 = the first week of the first quarter of the year (1st week of january, indicating a new year)
q1= 1-13
q2= 14-26
q3= 27-39
q4=40-53
Hope this helps you, like it helps me.
Best regards,
IMPORTANT NOTE:
Because the scripts asks for the week of the year it doesn't exactly indicate the first day of the quarter of the year. Instead it indicates the year like this: 52 / 4 = 13 W p/Q. Or in other words: 13 weeks per quarter of the year (roughly). Every 5.6 years there's a 53rd week, which will not cause any trouble as long as TV allows the use of the 53rd week, which I think it does.

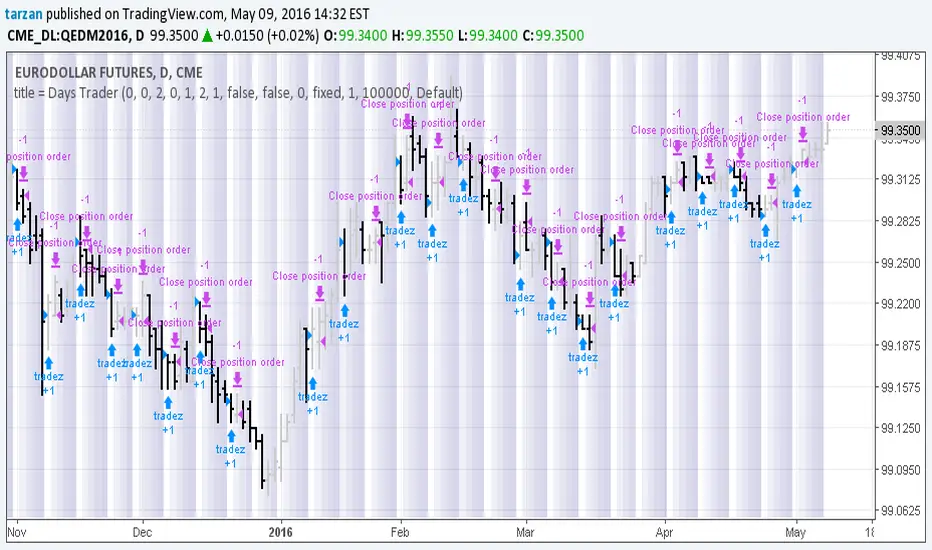
Days Trader 1.0Simple program to look for day of week or day of month patterns in chart data.
All original work by Boffin Hollow Lab
Author: Tarzan