RAINBOW AVERAGES - INDICATOR - (AS) - 1/3
-INTRODUCTION:
This is the first of three scripts I intend to publish using rainbow indicators. This script serves as a groundwork for the other two. It is a RAINBOW MOVING AVERAGES indicator primarily designed for trend detection. The upcoming script will also be an indicator but with overlay=false (below the chart, not on it) and will utilize RAINBOW BANDS and RAINBOW OSCILLATOR. The third script will be a strategy combining all of them.
RAINBOW moving averages can be used in various ways, but this script is mainly intended for trend analysis. It is meant to be used with overlay=true, but if the user wishes, it can be viewed below the chart. To achieve this, you need to change the code from overlay=true to false and turn off the first switch that plots the rainbow on the chart (or simply move the indicator to a new pane below). By doing this, you will be able to see how all four conditions used to detect trends work on the chart. But let's not get ahead of ourselves.
-WHAT IS IT:
In its simplest form, this indicator uses 10 moving averages colored like a rainbow. The calculation is as follows:
MA0: This is the main moving average and can be defined with the type (SMA, EMA, RMA, WMA, SINE), length, and price source. However, the second moving average (MA1) is calculated using MA0 as its source, MA2 uses MA1 as the data source, and so on, until the last one, MA9. Hence, there are 10 moving averages. The first moving average is special as all the others derive from it. This indicator has many potential uses, such as entry/exit signals, volatility indication, and stop-loss placement, but for now, we will focus on trend detection.
-TREND DETECTION:
The indicator offers four different background color options based on the user's preference:
0-NONE: No background color is applied as no trend detection tools is being used (boring)
1-CHANGE: The background color is determined by summing the changes of all 10 moving averages (from two bars). If the sum is positive and not falling, the background color is GREEN. If the sum is negative and not rising, the background color is RED. From early testing, it works well for the beginning of a movement but not so much for a lasting trend.
2-RAINBW: The background color is green when all the moving averages are in ascending order, indicating a bullish trend. It is red when all the moving averages are in descending order, indicating a bearish trend. For example, if MA1>MA2>MA3>MA4..., the background color is green. If MA1 threshold, and red indicates width < -threshold.
4-DIRECT: The background color is determined by counting the number of moving averages that are either above or below the input source. If the specified number of moving averages is above the source, the background color is green. If the specified number of moving averages is below the source, the background color is red. If all ten MAs are below the price source, the indicator will show 10, and if all ten MAs are above, it will show -10. The specific value will be set later in the settings (same for 3-TSHOLD variant). This method works well for lasting trends.
Note: If the indicator is turned into a below-chart version, all four color options can be seen as separate indicators.
-PARAMETERS - SETTINGS:
The first line is an on/off switch to plot the skittles indicator (and some info in the tooltip). The second line has already been discussed, which is the background color and the selection of the source (only used for MA0!).
The line "MA1: TYP/LEN" is where we define the parameters of MA0 (important). We choose from the types of moving averages (SMA, EMA, RMA, WMA, SINE) and set the length.
Important Note: It says MA1, but it should be MA0!.
The next line defines whether we want to smooth MA1 (which is actually MA0) and the period for smoothing. When smoothing is turned on, MA0 will be smoothed using a 3-pole super smoother. It's worth noting that although this only applies to MA0, as the other MAs are derived from it, they will also be smoothed.
In the line below, we define the type and length of MAs for MA2 (and other MAs except MA0). The same type and length are used for MA1 to MA9. It's important to remember that these values should be smaller. For example, if we set 55, it means that MA1 is the average of 55 periods of MA0, MA2 will be 55 periods of MA1, and so on. I encourage trying different combinations of MA types as it can be easily adjusted for ur type of trading. RMA looks quirky.
Moving on to the last line, we define some inputs for the background color:
TSH: The threshold value when using 3-TSHOLD-BGC. It's a good idea to change the chart to a pane below for easier adjustment. The default values are based on EURUSD-5M.
BG_DIR: The value that must be crossed or equal to the MA score if using 4-DIRECT-BGC. There are 10 MAs, so the maximum value is also 10. For example, if you set it to 9, it means that at least 9 MAs must be below/above the price for the script to detect a trend. Higher values are recommended as most of the time, this indicator oscillates either around the maximum or minimum value.
-SUMMARY OF SETTINGS:
L1 - PLOT MAs and general info tooltip
L2 - Select the source for MA0 and type of trend detection.
L3 - Set the type and length of MA0 (important).
L4 - Turn smoothing on/off for MA0 and set the period for super smoothing.
L5 - Set the type and length for the rest of the MAs.
L6 - Set values if using 4-DIRECT or 3-TSHOLD for the trend detection.
-OTHERS:
To see trend indicators, you need to turn off the plotting of MAs (first line), and then choose the variant you want for the background color. This will plot it on the chart below.
Keep in mind that M1 int settings stands for MA0 and MA2 for all of the 9 MAs left.
Yes, it may seem more complicated than it actually is. In a nutshell, these are 10 MAs, and each one after MA0 uses the previous one as its source. Plus few conditions for range detection. rest is mainly plots and colors.
There are tooltips to help you with the parameters.
I hope this will be useful to someone. If you have any ideas, feedback, or spot errors in the code, LET ME KNOW.
Stay tuned for the remaining two scripts using skittles indicators and check out my other scripts.
-ALSO:
I'm always looking for ideas for interesting indicators and strategies that I could code, so if you don't know Pinescript, just message me, and I would be glad to write your own indicator/strategy for free, obviously.
-----May the force of the market be with you, and until we meet again,
Width

Custom Candle Body WidthOver the specified bar range, plots a vertical line from open to close using the specified colors and line width (in pixels).
In effect, these look like thinner/thicker candle bodies.
The default candle bodies are made transparent over this range to make them appear hidden.
The indicator is capable of referencing the bar colors from another plot, using a technique of encapsulating the RGBT color value in a float value (plot to data window only recommended).
Refer to example code (which is commented out) in the source code.

Equivolume - volume as candle widthDo price action and volume really need to be on separate graphs? Why not display them both on a single graph and reduce the clutter? Presenting Equivolume candles here on TradingView - inspired by the NinjaTrader implementation
This indicator allows you to view traditional OHLC candles but with the additional ability to see relative volume through variations of width and/or transparency
Explanation
- Wide and/or full colour candles have the highest volume
- Thin and/or highly transparent candles have the lowest volume
- The following diagram shows the Equivolume indicator as well as a traditional volume graph along the bottom. You can see that when the volume is highest, the candle is widest and also the most intense color.
- The `Lookback candle count` user parameter specifies the number of candles to use in order to locate the highest volume within that range. All other candle widths in the range will be adjusted relative to this highest volume
Tips
- Toggle off the visibility of the original graph for the instrument to get the best view of the candles when using variable transparency
Gotchas
- Due to a Pine Script limitation a maximum of 500 variable width candles can be drawn on the chart
- If `Lookback candle count` is higher than the total number of available candles for the instrument, then the indicator will fail and not display anything. I’m still investigating how to handle this case better
- Be aware if you are using the `High` setting for the `Transparency range` parameter, candles with the lowest volume will be virtually invisible

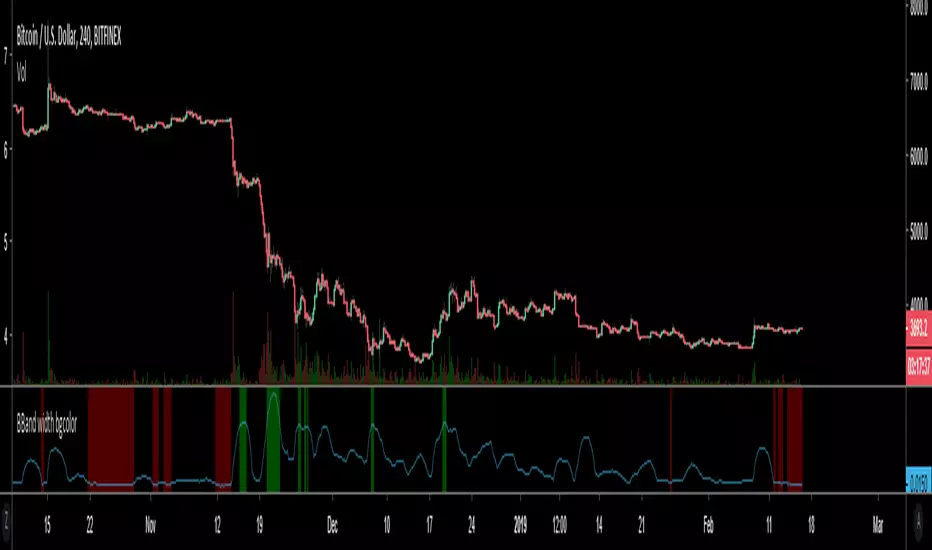
Flat Detect By Bollinger BandsThis simple script indicate the potential flat market zones, calculated based on the Bollinger Bands width.
It's showing the Bollinger Bands in red when the market is detected as flat.
You can adjust the Width Threshold with precision on the inputs settings.
Enjoy :)

Exponential Deviation Bands Width [ChuckBanger]This indicator is a compliment to Exponential Deviation Bands . It is the difference between the upper and the lower bands divided by the middle band. It is an easy way to visualize consolidation before price movements or periods of higher volatility.
How it works
During a period of high volatility, the distance between the two bands will widen and Exponential Deviation Bands width will increase. And the opposite occurs during a period of low volatility, the distance between the two bands will contract and Exponential Deviation Bands width will decrease. Meaning there is a tendency for bands to alternate between expansion and contraction.
When the bands are relatively far apart, that is often is a sign that the current trend is ending. When the distance between the two bands is relatively narrow that often is a sign that the market is about to initiate a bigger move in either direction.

Volatility Bands by DGTVolatility represents how large an asset's prices swing around the mean price, the degree of variation of a trading price over time, and is commonly measured with beta (β) coefficients, standard deviations (σ) of returns where tools such as Average True Range, Bollinger Bands, Keltner Channel, Squeeze Indicator, etc presents volatility concept
Volatility often refers to the amount of uncertainty or risk related to the size of changes in a security's value. The higher the volatility, the riskier the security - the price of the security can change dramatically over a short time period in either direction. A lower volatility - security's value does not fluctuate dramatically, and tends to be more steady
This study, Volatility Bands , attempts to present a way to measure and visualize volatility , using standard deviations (σ) and average true range indicator, and aims to point out areas that might indicate potential trading opportunities
I will try to explain the usage with examples,
same setup with different option selected
as you may observe from the examples different setting may have advantages and disadvantages over one another, it is recommended to verify a trading setup with different available options.
Additionally, It is recommended to use this indicator in conjunction with other technical indicators, or verify using chart/candle patterns. Below is an usage example using in conjunction with other indicator, in the given example “Neglected Volume by DGT” is selected
Similarities and Differences
Bollinger Bands depicts two standard deviations above and below a simple moving average, and Keltner Channel depicts two times average true range (ATR) above and below an exponential moving average
Volatility Bands study combines the approach of both Bollinger Bands and Keltner Channel, with different settings and different visualization
Default settings are one standard deviations and one time average true range (ATR) above and below 13 period exponential moving average. Setting can be adjusted by users but let me remind all testes are performed with the default settings.
Mathematically expressed as
Upper band area between “ema + stdev” and “ema + atr”
Lower band area between “ema – stdev” and “ema – atr”
A different display is added with the inspiration I get from one of the @quantgym ‘s study, many thanks @quantgym 😉
When difference band display is selected the study will reflect the area between “ema + stdev – atr” and “ema – stdev + atr”. As shown in the examples above
Note: standard deviation calculation can be adjusted based on price action or its moving average.
Other differentiation between BB and KC is with V-BANDS mostly we look for trade opportunities when price action move out of the bands and in most cases we assume market is consolidating when the price action is within the bands
The other indicator that presents similarities to Volatility Bands is Squeeze Indicator, which measures the relationship between Bollinger Bands and Keltner's Channels to help identify consolidations and signal when prices are likely to break out. Mainly Volatility Bands is different version of Squeeze indicator, in fact the purpose is almost same but visualization is completely different. Additionally Volatility Bands Offers trading opportunities whereas Squeeze indicator only presents market states unless a momentum indicator is adapted to Squeeze indicator.
Disclaimer:
Trading success is all about following your trading strategy and the indicators should fit within your trading strategy, and not to be traded upon solely
The script is for informational and educational purposes only. Use of the script does not constitute professional and/or financial advice. You alone have the sole responsibility of evaluating the script output and risks associated with the use of the script. In exchange for using the script, you agree not to hold dgtrd TradingView user liable for any possible claim for damages arising from any decision you make based on use of the script

3MAs & BB, Time-Res, Low-VolTriple MAs with EMA/SMA option, and specific timeframe options.
Very customizable.
Bollinger Bands
If BollingerBand Width is lowest in 100 bars it fills background.

Combo Backtest 123 Reversal & Donchian Channel Width This is combo strategies for get a cumulative signal.
First strategy
This System was created from the Book "How I Tripled My Money In The
Futures Market" by Ulf Jensen, Page 183. This is reverse type of strategies.
The strategy buys at market, if close price is higher than the previous close
during 2 days and the meaning of 9-days Stochastic Slow Oscillator is lower than 50.
The strategy sells at market, if close price is lower than the previous close price
during 2 days and the meaning of 9-days Stochastic Fast Oscillator is higher than 50.
Second strategy
The Donchian Channel was developed by Richard Donchian and it could be compared
to the Bollinger Bands. When it comes to volatility analysis, the Donchian Channel
Width was created in the same way as the Bollinger Bandwidth technical indicator was.
As was mentioned above the Donchian Channel Width is used in technical analysis to measure
volatility. Volatility is one of the most important parameters in technical analysis.
A price trend is not just about a price change. It is also about volume traded during this
price change and volatility of a this price change. When a technical analyst focuses his/her
attention solely on price analysis by ignoring volume and volatility, he/she only sees a part
of a complete picture only. This could lead to a situation when a trader may miss something and
lose money. Lets take a look at a simple example how volatility may help a trader:
Most of the price based technical indicators are lagging indicators.
When price moves on low volatility, it takes time for a price trend to change its direction and
it could be ok to have some lag in an indicator.
When price moves on high volatility, a price trend changes its direction faster and stronger.
An indicator's lag acceptable under low volatility could be financially suicidal now - Buy/Sell signals could be generated when it is already too late.
Another use of volatility - very popular one - it is to adapt a stop loss strategy to it:
Smaller stop-loss recommended in low volatility periods. If it is not done, a stop-loss could
be generated when it is too late.
Bigger stop-loss recommended in high volatility periods. If it is not done, a stop-loss could
be triggered too often and you may miss good trades.
WARNING:
- For purpose educate only
- This script to change bars colors.

Combo Strategy 123 Reversal & Donchian Channel WidthThis is combo strategies for get a cumulative signal.
First strategy
This System was created from the Book "How I Tripled My Money In The
Futures Market" by Ulf Jensen, Page 183. This is reverse type of strategies.
The strategy buys at market, if close price is higher than the previous close
during 2 days and the meaning of 9-days Stochastic Slow Oscillator is lower than 50.
The strategy sells at market, if close price is lower than the previous close price
during 2 days and the meaning of 9-days Stochastic Fast Oscillator is higher than 50.
Second strategy
The Donchian Channel was developed by Richard Donchian and it could be compared
to the Bollinger Bands. When it comes to volatility analysis, the Donchian Channel
Width was created in the same way as the Bollinger Bandwidth technical indicator was.
As was mentioned above the Donchian Channel Width is used in technical analysis to measure
volatility. Volatility is one of the most important parameters in technical analysis.
A price trend is not just about a price change. It is also about volume traded during this
price change and volatility of a this price change. When a technical analyst focuses his/her
attention solely on price analysis by ignoring volume and volatility, he/she only sees a part
of a complete picture only. This could lead to a situation when a trader may miss something and
lose money. Lets take a look at a simple example how volatility may help a trader:
Most of the price based technical indicators are lagging indicators.
When price moves on low volatility, it takes time for a price trend to change its direction and
it could be ok to have some lag in an indicator.
When price moves on high volatility, a price trend changes its direction faster and stronger.
An indicator's lag acceptable under low volatility could be financially suicidal now - Buy/Sell signals could be generated when it is already too late.
Another use of volatility - very popular one - it is to adapt a stop loss strategy to it:
Smaller stop-loss recommended in low volatility periods. If it is not done, a stop-loss could
be generated when it is too late.
Bigger stop-loss recommended in high volatility periods. If it is not done, a stop-loss could
be triggered too often and you may miss good trades.
WARNING:
- For purpose educate only
- This script to change bars colors.

BBand width bgcolorSimple backround colouring based upon input criteria.
Published by request of a TV user.
Sorry if this is duplicate, but I couldn't see any other scripts on TV.