Mykung's Financial Table (Revenue, EPS, Net margin)A compact fundamentals dashboard that displays the last **8 fiscal quarters** for the current symbol. It’s designed for clarity (minimal decimals) and flexible presentation, with a dynamic column layout and accurate quarter labels.
## What it shows
**Columns (left → right):**
`Quarter | Revenue | YoY % | QoQ % | EPS | YoY % | QoQ % | `
* **Quarter** — formatted as `YYYY Q#` (e.g., `2025 Q2`).
Labels are derived from **fiscal period end dates** for accuracy.
* **Revenue** — compact notation (K/M/B/T), **no decimals**.
* **EPS** — uses **Diluted EPS** by default and falls back to **Basic EPS** if Diluted is unavailable. Displayed with **2 decimals**.
* **Net Margin** — displayed with **1 decimal**.
*Note:* Its YoY/QoQ columns represent **percentage-point** changes (absolute differences), not relative percent changes.
* **YoY % and QoQ %** — shown as **integers** (no decimals). Positive values are colored green; negative values red.
## Key features
* **Accurate quarter labels** from fundamentals (`FISCAL_PERIOD_END_DATE` → fallback `FINANCIAL_END_TIME`).
* **Dynamic layout:**
* Show all 10 columns (include Net Margin group), or
* Hide Net Margin to render a **7-column** table automatically.
* **Row order:** **Oldest at top → Latest at bottom** (chronological reading).
* **Customization:**
* Table position (nine presets: corners/centers).
* Text size.
* Table background color.
* **Header colors** (text & background) — also applied to the **Quarter** column cells for visual grouping.
* **Body text color** for data cells.
## Inputs (Settings)
* **Table Position** — place the table anywhere on the chart.
* **Text Size** — auto/tiny/small/normal/large/huge.
* **Table Background** — overall table BG color.
* **Header Background Color** — header & Quarter column background.
* **Header Text Color** — header & Quarter column text color.
* **Body Text Color** — data cells text color.
* **Show Net Margin Group (Cols 7–9)** — toggle between 10-col or 7-col layout.
## Calculations
* **QoQ %** = $(Current − Previous) / |Previous|$ × 100
* **YoY %** = $(Current − 4Q Ago) / |4Q Ago|$ × 100
* **Net Margin YoY / QoQ** = **difference in percentage points** (e.g., 12.4% → 10.9% = −1.5pp)
## Notes & limitations
* Requires symbols with **quarterly fundamentals** on TradingView. If a field is unavailable, it shows **N/A**.
* Fundamentals are updated by TradingView; values may refresh after earnings filings.
* Works on any chart timeframe; data comes from **fundamentals**, not price bars.
* Colors are indicative only and not investment advice.
**Built for readability**: minimal decimals (EPS 2dp, Net Margin 1dp), integer percentages, and compact revenue formatting—so you can scan eight quarters at a glance.
Williamoneil
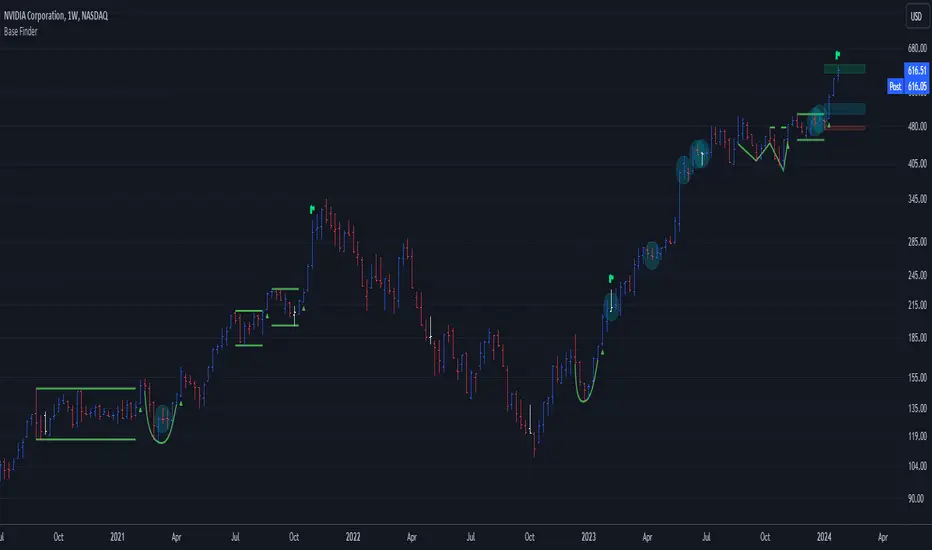
Base Detector Pro [AletheiaTradeLab]This custom Trading View indicator combines William O’Neal “Base” patterns with several complementary tools—David Ryan’s ANT indicator, key pivot‐based price levels, index and earnings lines, relative strength (RS) line, and moving averages—to help you pinpoint base formations and validate whether each one merits a trade.
1. Bases (William O'Neal)
A “base” is simply a period of price consolidation following a significant run-up. During this phase, a stock moves mostly sideways within a defined trading range, forming clear support and resistance lines.
Key Criteria for a Valid Base
- Prior Uptrend
Before a base begins, the stock should already have a healthy advance—typically at least a 30% gain.
- Shapes of Bases
Bases can form in several distinct geometric patterns, each signaling a different kind of consolidation and potential breakout:
Flat Base
Shape : A horizontal rectangle bounded by nearly parallel support (bottom) and resistance (top) trendlines.
Minimum Length : 5 weeks
Maximum Length : 65 weeks
Depth : < 15%
Pivot Point : Left-side high of base
i.ibb.co i.ibb.co
Cup Base
Shape : A smooth, rounded “U” curve.
Minimum Length : 6 weeks
Maximum Length : 65 weeks
Minimum Depth : 8%
Maximum Depth : 50%
Pivot Point : Left-side high of base
i.ibb.co i.ibb.co
Sauce Base
Shape : A very gradual, broad “U” curve, often taking more length than cup bases.
Minimum Length : 6 weeks
Maximum Length : 65 weeks
Minimum Depth : 8%
Maximum Depth : 50%
Pivot Point : Left-side high of base
i.ibb.co i.ibb.co
Cup with Handle Base
Shape : A “U”‐shaped cup followed by a smaller downward-sloping flag or channel (the handle).
Minimum Length : 6 weeks
Maximum Length : 65 weeks
Minimum Depth : 8%
Maximum Depth : 50%
Pivot Point : High of the handle
i.ibb.co i.ibb.co
Saucer with Handle Base
Shape : Similar to cup with handle, but cup looks like the saucer base.
Minimum Length : 6 weeks
Maximum Length : 65 weeks
Minimum Depth : 8%
Maximum Depth : 50%
Pivot Point : High of the handle
i.ibb.co
Ascending Base
Shape : An upward-sloping channel or wedge with 3 pullbacks. Each pullback low should be higher than the previous one. It needs around 20% increase from a base to the other.
Minimum Length : 8 weeks
Maximum Length : 16 weeks
Minimum Depth : 8%
Maximum Depth : 50%
Pivot Point : Left-side high of third base
i.ibb.co i.ibb.co
Consolidation Base
Shape : Similar to flat base, but wider and fails to form any of the above bases.
Minimum Length : 8 weeks
Maximum Length : 16 weeks
Minimum Depth : 8%
Maximum Depth : 50%
Pivot Point : Left-side high of base
i.ibb.co i.ibb.co
- Base Stages
Once a stock has completed its initial 30% run-up and formed its first base, that pattern is labeled Stage 1.
After a breakout from Stage N, the stock must rally at least 20% above the Stage N pivot (the base’s resistance point). If it does, the next valid base becomes Stage N + 1.
When a breakout fails to advance at least 20% a base on base forms. This is considered an extension for the current base stage, and a letter is assigned after the stage number.
When a breakout fails and the price undercuts the low for the previous base, the base stages reset, and a rally of 30% will be needed to form a new stage 1 base.
Note that for IPO stocks, a 30% increase is not required to form the first base. As soon as it meets any of the shape of any of the available bases, it will be drawn.
- Base statistics
To help you determine how healthy is a base, some statistics are available when you hover on the small dot shown above the high-left side of each base.
i.ibb.co
Base : The specific pattern type (Flat, Cup, Sauce, etc.).
Stage : The stage number of the base (1, 2, 3 …) and, in parentheses, how many distinct bases have formed since the very first base (including base-on-base like 1a, 1b, etc.).
Pivot : The resistance level that defines the top of the base. A close above this price often signals a valid breakout and a potential entry point.
Length : The number of bars (days on a daily chart; weeks on a weekly chart) between the start of the base and the bar immediately before breakout. (The initial bar and the breakout bar themselves are not counted.)
Depth : How far, in percentage terms, the low of the base has fallen below its left-side high.
Prior Uptrend : The percent gain from the pivot of the previous base up to the start of the current base.
Blue/Red Count : The number of up days (Blue) and down days (Red) during the base where volume was above the 50-period moving average.
Price % : The percent change from the close at the end of the base to the close at the breakout bar.
Volume % : The percent difference between the volume on the breakout bar and the 50-period average volume at the end of the base.
2. ANT Indicator (David Ryan)
The ANT indicator, developed by David Ryan, is a momentum-based signal used to identify high-potential breakout candidates during a stock’s run-up phase. It complements the base patterns by flagging moments of unusually strong price and volume activity within an uptrend, helping confirm emerging strength before or during a base formation.
i.ibb.co
3. Key Price Levels (Pivots)
Plots recent pivot-based support and resistance levels.
i.ibb.co
4. Index Line Overlay
Overlays a chosen index (e.g. SPX) on the top portion of the chart to compare relative performance.
i.ibb.co
5. Relative Strength (RS) Line
Plots the price ratio of the symbol vs. an index (e.g. SPX) to identify outperformance.
i.ibb.co
6. Moving Averages (SMA & RS-MA)
Allows up to four simple (or exponential) moving averages on price (daily/weekly) and three on the RS line.
7. Earnings Line & EPS Change
Marks earnings events on daily/weekly charts and optionally plots YoY EPS change in a lower portion of the chart. The earnings line also shows a projection to estimated earnings. To maintain alignment with the price chart, the line and YoY EPS data are limited to the most recent 28 quarters on weekly charts and 8 quarters on daily charts. For analyzing older data, you can use the replay feature.
i.ibb.co
8. Bars
Since Trading View displays very thin bars when zoomed out, I added 2-pixel-wide vertical lines over the bars to make them easier to see.
9. Dark Theme
I added this for a quick workaround to adapt colors for dark theme. Enabling this overrides any custom settings. Uncheck to customize colors.
i.ibb.co

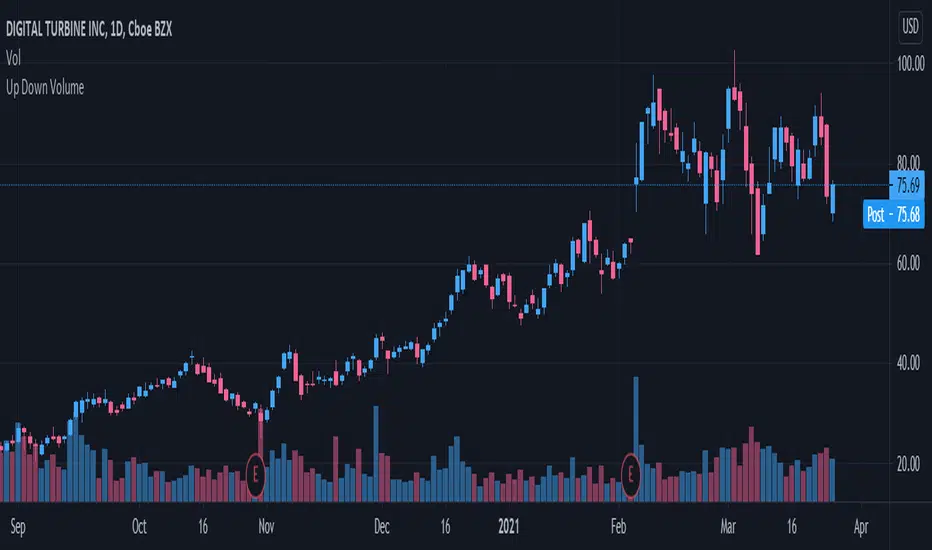
Follow Through Day (FTD) + Sweep [TrendX_]The Follow Through Day (FTD) + Sweep indicator is a Trend-following tool mixing William O'Neil's original FTD concept and Liquidity concept. This indicator helps you identify potential subsequent bullish trends with greater precision by combining volume analysis, price action, and liquidity concepts.
💎 FEATURES
Follow Through Day Candle (FTD Candle)
The FTD, pioneered by William O'Neil, serves as a reliable signal for identifying the beginning of new bull markets. It's particularly valuable because it combines multiple market factors - price action, volume, and timing - to confirm genuine market reversals rather than temporary bounces.
The power of the FTD lies in its ability to distinguish between ordinary market fluctuations and significant trend changes. By requiring specific criteria to be met across multiple sessions, it helps filter out false signals and identifies high-probability reversal points where institutional investors are likely beginning to accumulate positions.
Sweep Area
The Sweep area feature enhances the traditional FTD concept by incorporating modern liquidity analysis. This overlay identifies zones where large market participants are likely to trigger stop losses before continuing the trend. These areas often represent optimal entry points for traders looking to join the new uptrend with reduced risk.
🔎 BREAKDOWN
FTD Candle
The FTD formation process occurs in two distinct phases: Setup and Completion.
Setup Phase
Strong Market Decline
The market must first experience a significant downtrend
This selling pressure helps clear out weak hands and creates oversold conditions
The decline creates the potential energy for a powerful reversal
First Recovery Session
Marks the initial sign of buying pressure emerging
Often characterized by a strong reversal candle
Represents the first indication that selling pressure may be exhausting
Recovery Confirmation
The second and third days must maintain prices above the new pivot low
This consolidation period helps confirm the validity of the initial bounce
Shows that sellers are no longer in control of price action
Completion Phase:
Supply Test Session
Low volume indicates diminishing selling pressure
Price remains above the pivot low
Creates the foundation for institutional buyers to begin accumulating
Breakout Day
Price increase exceeds average profit of bullish candles
Volume increases by at least 15% compared to previous session
Shows strong institutional commitment to the new uptrend
Timing Window
Must occur between the 4th and 8th candle after First Recovery Session
This specific timing helps confirm the sustainability of the reversal
Based on O'Neil's research of historical market bottoms
FTD Sweep
The Post-FTD Phase introduces the Sweep concept, which is crucial for understanding how large market participants operate. This feature leverages the liquidity concept because institutional traders often need to trigger stop losses to accumulate larger positions at better prices. This helps:
Create liquidity pools for large position entries
Shake out weak hands before continuing the trend
Test the strength of the new trend by absorbing selling pressure
⚙️ USAGE
Sweep + TP & SL Strategy
Example: BTCUSDT (1D) - Replay back to 9th November 2024
After an FTD candle forms, traders can adopt a systematic approach to enhance their trading strategy. First, they should determine the swing range and convert the post-FTD zone into concrete stop loss and take profit levels, which are based on the price action during the FTD formation. Next, traders should wait for a sweep formation, as this indicates that institutional players are accumulating positions. A quick price rejection from the sweep level should be observed before executing an entry.
The reasoning behind this strategy is rooted in market microstructure. By waiting for the sweep, traders position themselves alongside institutional players who need to build large positions without causing adverse price movement. The sweep creates the liquidity they need, and the subsequent move often represents the true trend continuation.
DISCLAIMER
This indicator is not financial advice, it can only help traders make better decisions. There are many factors and uncertainties that can affect the outcome of any endeavor, and no one can guarantee or predict with certainty what will occur. Therefore, one should always exercise caution and judgment when making decisions based on past performance.

IBD Market School [tradeviZion]IBD Market School Indicator: User Guide and Settings Reference
A comprehensive guide to configuring and using the IBD Market School indicator for TradingView
Introduction
The IBD Market School indicator is an advanced market analysis tool that implements Investor's Business Daily's methodology for identifying optimal trading opportunities. By tracking key market indexes and analyzing price and volume patterns, it provides actionable buy and sell signals based on the CANSLIM investment system.
The indicator offers a comprehensive set of features:
Complete Signal System
10 primary buy signals (B1-B10)
Additional buy-side indicators (HH - Higher High, ED - Expired Days)
14 sell signals (S1-S14)
Index Rise 6% signal for Distribution/Stalling Day expiration
Market Health Tracking
Distribution Day detection and counting
Stalling Day identification and validation
Automatic 25-day signal expiration
6% price rise monitoring for signal clearing
Market Condition Analysis
Rally Day detection (major and minor)
Follow-Through Day confirmation
Dynamic market exposure management (0-100%)
Power Trend analysis with multiple states
Risk Management Features
Circuit Breaker system for major declines
Buy Switch system for exposure control
Customizable volume analysis (Nasdaq/S&P 500)
Distribution day clustering detection
Visual Analysis Tools
IBD-style candle display option
Power Trend state visualization
Signal line drawing system
Customizable tooltips and alerts
Proper configuration of the indicator's settings is essential as it affects:
Signal detection sensitivity and accuracy
Market exposure calculations and adjustments
Volume confirmation requirements
Visual display of market conditions and signals
Alert system behavior and notifications
This guide provides detailed explanations of each component and setting to help you optimize the indicator for your trading strategy while maintaining adherence to IBD's proven methodology.
📊 General Settings
This section controls the indicator's tooltip display, alert behavior, and candle visualization preferences.
The General Settings panel allows you to configure tooltip modes, alert types, and candle appearance.
Tooltip Display Mode
Select how detailed the tooltips should be when hovering over signals and indicators:
The three tooltip display modes: Simple (left), Detailed (center), and Market Analysis (right).
Simple Mode
Displays concise signal definitions
Shows basic entry and exit conditions
Focuses on essential trigger points
Perfect for experienced traders
Detailed Mode
Provides in-depth explanations of each buy/sell signal
Shows complete validation criteria and conditions
Includes volume requirements and percentage thresholds
Explains the context and significance of each signal
Market Analysis Mode
Focuses on broad market health metrics
Shows market exposure percentage and trend
Displays buy switch and power trend status
Tracks distribution days and signal buffers
Note: Choose the tooltip mode based on your needs:
- Simple: Provides quick, essential information on signals for fast decision-making
- Detailed: Breaks down conditions for each buy/sell signal, ideal for users wanting in-depth explanations
- Market Analysis: Focuses on broad market health, including exposure, buy switch, distribution days, and trends
Market Exposure Alert System
The indicator alerts you when market exposure levels change, helping you adjust your positions accordingly.
Alert Types
On Close (Recommended)
Triggers only after bar closes
More reliable signals as price action is confirmed
Real-Time
Triggers immediately when conditions are met
Note: Signals may change by bar close
Setting Up Alerts
Click the "..." (More) button on the indicator label "$tradeviZion - IBD Market School"
Select "Add alert on $tradeviZion - IBD Market School..."
In the Create Alert dialog:
Settings tab:
Verify the symbol and timeframe (e.g., NASDAQ:IXIC , 1D)
Condition: Select "$tradeviZion - IBD Market School"
Alert function: Choose "Any alert() function call"
Expiration: Set to "Open-ended alert"
Alert name will auto-populate
Switch to Notifications tab:
Enable "Notify in app" for push notifications in the mobile app
Enable "Show toast notification" for on-screen alerts
Enable "Play sound" and customize duration (e.g., Thin, 10 seconds)
Optional settings:
Send email (requires profile settings configuration)
Webhook URL for POST requests
Send plain text for alternative email format
Click Create to activate the alert
Alert Messages
Message format: "Market exposure change for : Market exposure from % to %"
Example: "Market exposure change for NASDAQ:IXIC : 📈 Market exposure reduced from 100% to 75%"
📈 Arrow indicates exposure increase
📉 Arrow indicates exposure decrease
Messages include previous and new exposure percentages
Note: These alerts specifically track changes in market exposure levels, helping you stay aligned with market conditions. They are essential for maintaining proper position sizing and risk management.
Chart Style Options
IBD-style Candles
Enable to match Investor's Business Daily chart style
For MarketSmith style setup, right-click on chart and go to Settings
Navigate to Symbol tab
Uncheck Body, Borders, and Wicks
Press Alt+R to restore chart view if zoom affects display
To revert to original style, right-click on chart and go to Settings
Navigate to Symbol tab
Check Body, Borders, and Wicks
Color Based on Previous Close
Colors bars based on close vs. previous close
When enabled, determines colors by comparing current close to previous close
Use blue color for closes above previous
Use pink color for closes below previous
📈 Market Exposure Table Settings
Configure how the market exposure information is displayed on your chart.
The Market Exposure Table Settings panel allows you to customize the appearance and layout of the market status display.
Layout Options
• Hide Table
Completely hides the market status display
• Basic (2 Columns)
Shows main indicators in two columns
Compact view without signal list
Ideal for minimalist chart view
• Detailed (2 Columns with Signals)
Displays main indicators plus signal panel
Shows Buy and Sell signals in separate columns
Provides comprehensive market overview
• Stacked (1 Column, Compact)
Vertical layout with single column
Most space-efficient option
Ideal for smaller chart windows
Color Settings
Background : Dark gray background for the table
Text : White text for general information
Buy Signal : Green highlighting for buy signals
Sell Signal : Red highlighting for sell signals
Additional Options
Show Trading Wisdom: Enable rotating trading messages
Displays empowering trading messages
Helps reinforce disciplined trading practices
Updates every 5 bars with new wisdom
Includes tooltips with comprehensive trading guidance
Customizable yellow text color for messages
💹 Buy Signals Settings
This section controls the visibility and behavior of buy signals and related indicators.
The Buy Signals Settings panel allows you to configure signal visibility, volatility calculations, and visual appearance of buy signals.
Signal Display Options
Buy Signals Display : Choose display mode
Show Selected Signals
Hide All
Compact Signals
Individual Signal Toggles
Primary Buy Signals (B1-B10)
Special Indicators (HH, ED)
Understanding Buy Signals
B1: Follow-Through Day (FTD)
Buy on the initial FTD with volume higher than the previous day. You may use an FTD from an index other than the NASDAQ:IXIC , but if you do, you must stay within that index for future Buy and Sell Signals.
B2: Additional Follow-Through
Buy on all additional follow-through days within 25 days from a rally day that closes above the low of the initial follow-through day.
B3: Low Above EMA21
Buy on an up or flat day when the intraday low is at or above the EMA21. Note: Once you have a B3 or B4, you can't have another until it is reset by an S5.
Special Buy Indicators
HH: Higher High (No FTD after Rally)
Triggers when current close exceeds highest point since last confirmed rally. Must not have a Follow-Through Day (FTD). Buy switch turns on when close exceeds last rally's high and turns off if close drops below that high.
ED: Expired Days
Tracks Distribution and Stalling days that have aged out. Days are tracked for a specific trading period and expired days are removed from the count.
Index Rise Settings
Index Rise 6% from DD & SD
Toggle to enable/disable monitoring of price rises above Distribution and Stalling Days. Default value of 6% (adjustable) for monitoring rises above these days.
Understanding Index Rise
This feature tracks significant market recoveries by monitoring when the index rises substantially above Distribution Days (DD) or Stalling Days (SD). When the index rises 6% or more above the closing price of any DD or SD, it indicates a strong market recovery. This is an important signal because it helps identify when the market has shown enough strength to potentially overcome previous distribution periods. When triggered, this signal reduces the distribution day count, effectively acknowledging that the previous distribution pattern may no longer be as relevant due to the market's strong recovery.
B1 Signal Configuration
Volatility Settings
B1 Auto Volatility: Calculates FTD price requirement based on 200-day volatility
B1 Manual Volatility: Fixed value (default 1.245) when auto is disabled
Visual Settings
Label Size: Small (options: Tiny, Small, Normal, Large)
Signal Color: Light green background for buy signals
Text Color: Customizable text color for signal labels
Important Notes
Signal visibility affects both chart display and calculations
Auto volatility is recommended for most users
Manual volatility should only be adjusted by experienced users
Visual settings apply to all enabled buy signals
Confirmation Rules
Price Requirements
Follow-Through Day (B1) thresholds based on 200-day volatility:
Below 0.4% volatility: 0.7% gain required
0.4% to 0.55% volatility: 0.85% gain required
0.55% to 1% volatility: 1% gain required
Above 1% volatility: 1.245% gain required
EMA Breaks (S5/S6): 0.2% threshold below 21 EMA
Downside Reversal (B9): 1.75% high-to-low spread required
Volume Requirements
Distribution Days: Volume > previous day, with -0.20% or more price decline
Stalling Days: Volume ≥ 95% of previous day
Follow-Through Days (B1/B2): Volume > previous day
Accumulation Days (B7): Volume > previous day, close in upper 25% range
Sell Signals Settings
This section controls the visibility and behavior of sell signals and market weakness indicators.
The Sell Signals Settings panel allows you to configure signal visibility and visual appearance of sell signals and market health indicators.
Signal Display Options
Sell Signals Display: Dropdown with options to control signal visibility:
Show Selected Signals
Hide All
Compact Signals
Individual Signal Toggles
Primary Sell Signals: S1-S14 and CB (Circuit Breaker)
Market Health Indicators:
Distribution Days (DD): Indicative of institutional selling. Occurs when:
Market closes down by at least 0.2%
Volume greater than or equal to prior day
Tracked for 25 trading days
Stalling Days (SD): Sign of heavy volume without upside progress. Occurs when:
Market at/near new highs
Closes with small gain (0% to 0.4%)
High volume in lower half of day's range
Understanding Sell Signals
S1: Follow-Through Day Undercut
Sell if the index closes below the low of the initial follow-through day.
S2: Failed Rally Attempt
Sell if the index undercuts the major low of the rally attempt. Market exposure is reduced to zero and the Buy Switch is turned off.
S2ml: Minor Low Undercut
Minor Low undercut of rally attempt. Market exposure is reduced by two. This does not turn off the Buy Switch.
S3: Full Distribution Minus One
Sell after the distribution count increases to one less than the full distribution count.
S4: Full Distribution
Sell after reaching the full distribution count.
S5: Break Below EMA21
Sell if the index closes 0.2% or more below the EMA21. Note: Once you have an S5, S6, or S7, you can't have another until it is reset by a B3.
S6: Overdue Break Below EMA21
Sell if the index closes down 0.2% or more below the EMA21 after 30 days have passed since the last B3 without triggering an S5.
S7: Trending Below EMA21
Sell after S5 on the 5th consecutive day that the high is below the EMA21 and a down day.
S8: Living Below EMA21
Sell after S5 on the 10th and every 5th consecutive day after that (15th, 20th, 25th, etc.) that the high is below the EMA21.
S9: Break Below 50-Day MA
Sell if the index closes below the 50-Day Moving Average. Triggers only if a B6 signal was previously printed.
S10: Bad Break
Sell if the close is down 2.25% or greater in the bottom 25% of the range. Close below the MA50 or intraday high below EMA21.
S11: Downside Reversal
Sell after a Downside Reversal Day, which occurs with:
New High within 13 weeks
Close in bottom quartile of range
Close Down for the day
Spread of 1.75% or greater
S12: Lower Low
Sell after closing below the last marked low as defined by MarketSmith.
S13: Distribution Cluster
Distribution and stalling days increase to four up to eight days within a rolling eight-day period.
S14: Break Below Higher High
Sell after closing below the last marked high that printed a B8 (Higher High).
CB: Circuit Breaker
Triggers when the index drops 10% from the highest high since the FTD (B1) and falls 5% or more below the 50-Day MA intraday.
Buy/Sell Undercut Lines
This section controls the visibility and appearance of important price level lines on your chart.
The Buy/Sell Undercut Lines panel allows you to configure which signal lines are displayed and their visual appearance.
Line Visibility
Buy Signal Lines :
B8 Line: First high above the last pivot high
HH Line: Close above the prior high since last confirmed rally without FTD
Sell Signal Lines :
S1 Line: Close below the initial follow-through day
S2 Line: Undercut of major low
S2ml Line: Minor low undercut
S12 Line: Close below last marked low
S14 Line: Close below last marked high
Line Appearance
Color Settings :
B8: Green (Buy signal)
HH: Green (Buy signal)
S1: Red (Sell signal)
S2: Red (Sell signal)
S2ml: Orange (Modified sell signal)
S12: Purple (Pivot low signal)
S14: Blue (Close below pivot)
Line Style : Dashed (options: solid, dotted, dashed)
Line Width : 1 (adjustable)
📈 Rally Signal Settings
The Rally Signal Settings panel allows you to configure Rally Day detection and visualization.
Rally Day:
Toggle to enable/disable Rally Day signals. These mark the beginning of potential market uptrends when the market closes higher than the previous day, following a significant decline.
Visual Settings:
Label Size: small (options: tiny, small, normal, large)
Background Color: Customizable background for Rally Day labels
Text Color: Customizable text color for Rally Day labels
Distribution Day Settings:
Use Manual FullDDcount: Option to manually set the minimum combined number of Distribution and Stalling Days
Count Value: Default is 6 days (adjustable when manual mode is enabled)
This setting determines how many Distribution/Stalling Days are required to trigger a new rally
Pivot Point Settings
The Pivot Point Settings panel allows you to configure the display of high/low points and percentage changes between pivots.
Display Options
Display H/L Points
Toggle to show or hide pivot levels (high and low points) on the chart
%Change
Toggle to display percentage changes between pivot points
Color Settings
Positive % Color : Blue (customizable) - Used for positive percentage changes
Negative % Color : Pink (customizable) - Used for negative percentage changes
Precision Settings
Decimal Places: Set the number of decimal places (default: 2) for:
Pivot point price levels
Percentage change calculations
⚡ Power Trend Settings
This section controls how Power Trend information is visualized on your chart.
The Power Trend Settings panel allows you to configure how trend states are displayed and customize their visual appearance.
Example of Power Trend visualization showing both boxes (green background) and trend lines. The boxes indicate trend state while lines show trend transitions.
Display Options
Show Power Trend Line : Display trend states as lines on the chart
Show Boxes : Display trend states as boxes
Show Background : Display trend states as background colors
Power Trend Color Settings
On : Light green - Full power trend active
Resume : Light green - Power trend resuming
Off : Gray - Power trend inactive
With Floor : Yellow - Under pressure with support
No Floor : Orange - Under pressure without support
Power Trend Line Settings
Line Width : Set line thickness (default: 1)
Line Offset : Adjust line position (default: 5)
Power Trend Box Settings
Text Align : Set text alignment (left, center, right)
Text Position : Set vertical position (top, middle, bottom)
Size : Set box size (tiny, small, normal, large)
Color : Customize box background color
Power Trend States
Full Power (On)
Represents strongest market condition with maximum exposure of +7
Base maximum exposure of 5 plus 2 buffer signals
Buffer allows maintaining high exposure during normal pullbacks
2 sell signals reduce count from 7 to 5 without affecting base
Indicates very healthy market that can absorb normal profit-taking
Resume State
Shows successful market recovery after pressure period
Requires 10+ days without S2 minor, S9, or S13 signals
Must reestablish all initial strength conditions
Maintains same benefits as Full Power (+7 max, +2 floor)
Shows as light green in visualization
Under Pressure With Floor
First warning stage triggered by S2 minor or S13 signals
Reduces maximum exposure to +5
Maintains minimal protection with +1 floor
Suggests defensive positioning while keeping core positions
Shows as yellow in visualization
Under Pressure No Floor
Severe warning stage triggered by S9 signal
Maintains +5 maximum exposure but removes floor protection
Indicates higher risk of continued market decline
Requires careful position management
Shows as orange in visualization
Power Trend Off
Triggered by EMA/MA crossdowns with declining price
Can also be activated by S2 or Circuit Breaker signals
Maximum exposure limited to +5 with no buffer signals
Suggests focus on capital preservation
Shows as gray in visualization
Power Trend System Rules
Each state enforces strict exposure limits with automatic floor and ceiling adjustments
Power Trend can activate Buy Switch when entering Full Power state
Restraint Rule limits exposure to +2 until significant progress or B4 signal when starting from zero exposure
State transitions immediately update exposure limits and Buy Switch status
Distribution Cluster (S13) can move Power Trend to Under Pressure With Floor state
System maintains exposure floors to prevent panic selling while allowing flexibility below floor levels
Weekly SMAs Settings
The Weekly SMAs Settings panel allows you to configure the weekly moving averages display and calculations.
SMA 1: 10 periods (enabled), Red
Length: 10
Optional EMA toggle
Width: 1
SMA 2: 20 periods, Pink
Length: 20
Optional EMA toggle
Width: 1
SMA 3: 30 periods, Green
Length: 30
Optional EMA toggle
Width: 1
SMA 4: 40 periods (enabled), White
Length: 40
Optional EMA toggle
Width: 1
SMAs Settings
The SMAs Settings panel allows you to configure the daily moving averages display and calculations.
MA 1: 10 periods, Optional EMA, Pink
Length: 10
Optional EMA toggle
Width: 1
MA 2: 21 periods (enabled), EMA, Green
Length: 21
EMA enabled
Width: 1
MA 3: 50 periods (enabled), SMA, Red
Length: 50
EMA disabled
Width: 1
MA 4: 200 periods (enabled), SMA, White
Length: 200
EMA disabled
Width: 1
Volume Settings (NASDAQ & S&P 500)
This section controls volume data sources for market analysis. Proper volume settings are crucial for confirming market signals and analyzing institutional participation.
The Volume Settings panel allows you to configure volume data sources and custom ticker options for accurate market analysis.
Important Volume Source Information
TradingView's default volume data differs from IBD's Yahoo Finance data source
Current default settings (IXIC and TVOL) provide the most accurate results compared to IBD signals
Volume differences between TradingView and IBD are expected due to different data sources
Custom ticker options are provided for future compatibility with Yahoo Finance volume data
Volume Configuration
Nasdaq Volume Settings
Default Source: NASDAQ:IXIC (Nasdaq Composite Index)
Custom Ticker Option: USI:TVOL.NQ
Enable custom source by checking "Use Custom Nasdaq Ticker?"
Note: Custom ticker must be price-based for accurate volume analysis
S&P 500 Volume Settings
Default Source: TVOL (S&P 500 Total Volume)
Custom Ticker Option: USI:TVOL.NY
Enable custom source by checking "Use Custom S&P 500 Ticker?"
Note: Custom ticker must be price-based for accurate volume analysis
Volume Analysis Impact
Used for Distribution Day confirmation
Required for Follow-Through Day validation
Helps identify institutional buying/selling
Critical for Stalling Day detection
Recommendations
Keep default settings for most accurate current results
Only use custom tickers if you have confirmed price-based volume sources
Be aware that volume-based signals might slightly differ from IBD due to data source differences
Future updates may add Yahoo Finance volume compatibility
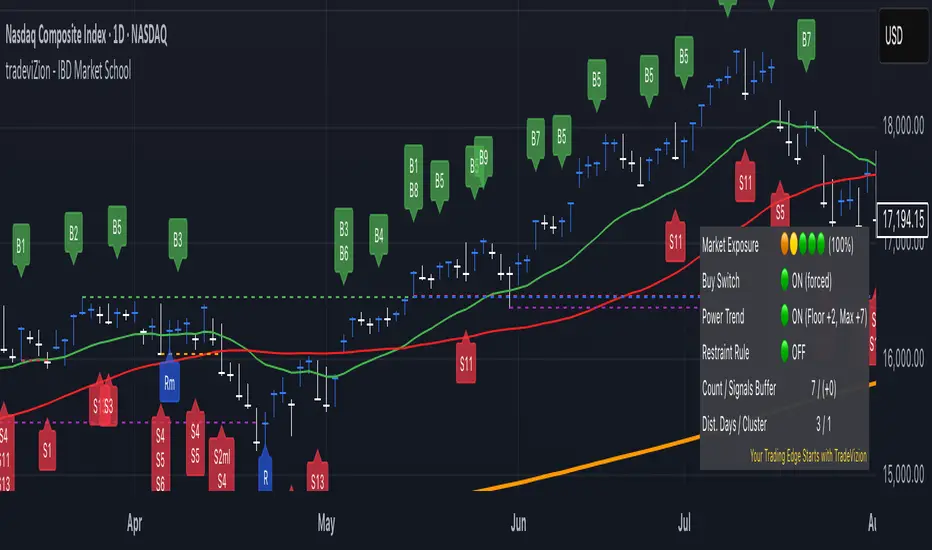
Market Status Table
The Market Status Table provides a real-time visual overview of current market conditions and signal status. Users can customize the table's appearance through the Market Exposure Table Settings.
The Market Status Table can be displayed in three different layouts: Basic (left), Detailed (center), and Stacked (right).
Layout Options
Hide Table
Completely hides the market status display
Basic (2 Columns)
Shows main indicators in two columns
Compact view without signal list
Ideal for minimalist chart view
Detailed (2 Columns with Signals)
Displays main indicators plus signal panel
Shows Buy and Sell signals in separate columns
Provides comprehensive market overview
Stacked (1 Column, Compact)
Vertical layout with single column
Most space-efficient option
Ideal for smaller chart windows
Main Indicators
• Market Exposure
Displayed as colored dots: 🟠 🟢 🟢 🟢 🟢
Shows current exposure level (0-100%)
(⚪ ⚪ ⚪ ⚪ ⚪): 0% exposure
(🟠 ⚪ ⚪ ⚪ ⚪): 30% exposure
(🟠 🟡 ⚪ ⚪ ⚪): 55% exposure
(🟠 🟡 🟢 ⚪ ⚪): 75% exposure
(🟠 🟡 🟢 🟢 ⚪): 90% exposure
(🟠 🟡 🟢 🟢 🟢): 100% exposure
• Key Status Indicators
Buy Switch: Shows ON (forced) or OFF status
Power Trend: Displays current state with floor and maximum values
Restraint Rule: Indicates ON or OFF status
Count / Signals Buffer: Shows current count and available buffer (e.g., "7 / (+0)")
Dist. Days / Cluster: Displays distribution day count and cluster status (e.g., "1 / 0")
• Signal Panel (Available in Detailed layout)
Lists all active Buy and Sell signals
Highlighted signals indicate currently active conditions
Green highlighting shows confirmed signals
Provides quick reference for all available signals
Status Indicator Colors
🟢 indicates "ON" or positive conditions (e.g., Buy Switch ON, Power Trend Full Power)
🟡 indicates "Under Pressure" or caution (e.g., Power Trend Under Pressure With Floor)
🟠 indicates "Under Pressure No Floor" or increased caution
🔴 indicates "OFF" or negative conditions (e.g., Buy Switch OFF, Power Trend OFF)
• Signal Colors
Green background for buy signals
Red background for sell signals
Black text on signal backgrounds for better visibility
• Number Formats
Count / Buffer signals shown as "7 / (+2)"
Distribution Days / Cluster count shown as "1 / 0"
Exposure percentage shown with dots (e.g., "90%")
Trading Wisdom - Market Risk Management
"The key to successful trading is not just knowing when to enter, but managing your exposure based on market health. Always check two critical indicators before any trade:
1. Market Exposure Levels
100% (5 dots): Full positions in strong market
90% (4 dots): Slightly reduced positions
75% (3 dots): Moderate positions, more cautious
55% (2 dots): Half positions only
30% (1 dot): Small positions only
0% (0 dots): Stay in cash
2. Distribution Days Risk Levels
1-2 Days: Normal market behavior
3 Days: Caution - reduce new positions
4+ Days: High risk - defensive positioning
5-6 Days: Consider moving to cash
Remember: It's better to miss an opportunity than to catch a falling market. Let the Market Exposure Table be your guide to smart position sizing."
Pro Tip: Make checking these two indicators part of your daily routine. They're your first line of defense against major drawdowns.
Conclusion
The IBD Market School indicator brings William O'Neil's proven methodology to TradingView, providing a comprehensive system for market analysis and risk management. This tool automates the complex task of tracking market signals while maintaining strict adherence to IBD's time-tested principles.
Key Features
Follows IBD's core methodology for identifying market direction
Automates tracking of Distribution Days, Follow-Through Days, and market signals
Provides clear market exposure guidance through the Power Trend system
Helps maintain discipline through systematic Buy Switch control
Offers multiple layers of risk management
Best Practices
Always check Market Exposure and Distribution Day count before making trades
Let the Buy Switch guide your market participation
Follow Power Trend states for proper position sizing
Use the default volume settings for most accurate signal generation
Monitor all confirmation rules for proper signal validation
Remember: This indicator is designed to replicate IBD's methodology as closely as possible within TradingView's environment. While it automates signal detection and exposure management, successful trading still requires discipline, patience, and strict adherence to risk management principles.
"The goal is not to be right about the market - it's to make money by following the market's signals and managing risk."
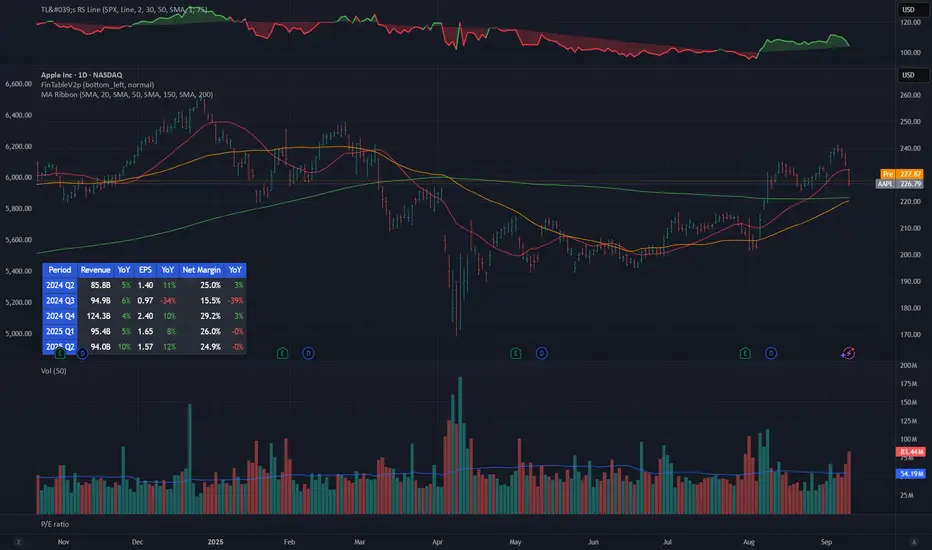
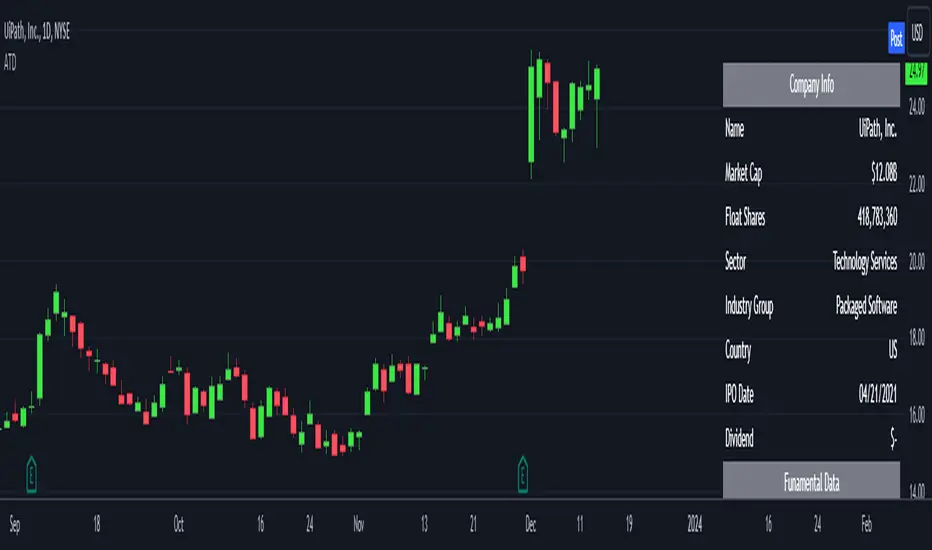
Analytics Trading DashboardThe Analytics Trading Dashboard is a tool designed to bring key information about a company into an easy-to-view dashboard. The indicator combines Company Info, Fundamental Data, Price & Volume Data, and Analyst Recommendations all into one table.
Let’s dive into the details by section:
Company Info:
Name – Company name.
Market Cap – Total dollar market value of the company’s outstanding shares of stock.
Float Shares / Shares Outstanding – Floating shares indicate the number of shares available for trading. Outstanding shares are any shares held by shareholders and company insiders.
Sector – The stock's sector.
Industry Group - The industry group the stock belongs to.
IPO Date – Date on which a security is first publicly traded.
Dividend – The latest dividend amount if the company pays one.
Fundamental Data:
EPS Due – The date the company is set to report earnings next.
EPS Est Next Qtr – The earnings per share estimate for the upcoming report.
EPS Est % Chg (Current Qtr) – The earnings growth as a percentage based on the reported earnings of the same quarter from the previous year.
EPS % Chg (Last Qtr) – The earnings growth of the last reported quarter as a percentage versus the same quarter from the previous year.
Last Qtr EPS Surprise – The amount reported earnings beat or missed estimates from the last reported quarter.
Last 3 Qtrs Avg. EPS Growth – The average percentage growth of the last 3 earnings reports.
# Qtrs of EPS Acceleration – The number of consecutive quarters that EPS has increased.
Last 3 Qtrs Avg. Rev Growth – The average percentage growth of the last 3 revenue numbers reported.
# Qtrs of Rev Acceleration – The number of consecutive quarters that revenue has increased.
Gross Margin – Measures gross profit compared to revenue as a percentage.
Debt/Equity Ratio – The ratio of debt to equity, or financial leverage.
Price and Volume Data:
52 Week High – The highest high of the last 52 weeks.
% Off 52 Week High – The percentage the current price has decreased from the 52-week high.
Price vs. Moving Average – The distance as a percentage that the current price is from the selected moving average.
Average Volume – The average number of shares traded based on the selected lookback period.
Average $ Volume – The average of the total value of shares traded based on the selected lookback period.
Pocket Pivots – The number of pocket pivots that have occurred in the selected lookback period.
Up/Down Volume Ratio - A 50-day ratio derived by dividing total volume on up days by the total volume on down days.
ATR – The average true range shown as a dollar value and percentage of current price.
ADR – The average daily range shown as a dollar value and percentage of current price.
Beta - Beta is a measure of its volatility relative to the overall market, indicating how much the stock's price is expected to fluctuate compared to the market average.
Analyst Ratings:
Strong Buy – The number of strong buy recommendations.
Buy – The number of buy recommendations.
Hold – The number of hold recommendations.
Sell – The number of sell recommendations.
Strong Sell – The number of strong sell recommendations.
The Analytics Trading Dashboard also comes with the flexibility to select your preferred moving average for price and volume analysis, as well as to choose the specific lookback period for calculating the Average True Range (ATR), Average Daily Range (ADR), and Pocket Pivots lookback period.
MarketSmith Daily Market IndicatorsMarketSmith Daily Market Indicators is designed to mimic the Daily Market Indicators tab found in MarketSmith. This tab contains 4 different secondary indicators to help gauge the health of the overall market.
This indicator allows you to choose which of the 4 indicators to show, as well as which index to pull data from, Nasdaq or NYSE. There is also a snapshot table showing the following:
# of stock advancing and up volume
# of stocks declining and down volume
# of stock unchanged and unchanged volume
# of stocks making new highs and new lows
Now let's look at the 4 indicators and how they work.
Advance/Decline Line
Plots the number of advancing shares vs the number of declining shares. Heavily weighted index stocks can skew price action, this line helps reveal that and whether most stocks are aligned with the trend.
Short Term Overbought/Oversold Oscillator
A 10-day moving average of the number of stocks moving up in price less the number of stocks moving down in price.
10 Day Moving Average of Up & Down Volume
Two 10 day moving averages to represent the volume of all stocks. Blue line: total volume of all stocks moving up in price. Red line: the total volume of all stocks moving down in price.
10 Day Moving Average of New Highs & New Lows
Two 10-day moving average to represent stocks making new highs and new lows. Blue line: The number of stocks making new price highs. Red line: The number of stocks reaching new lows.
Note this indicator is designed to work on a daily time frame chart. Data typically updates 90 minutes after the close. Data may differ from Marketsmith due to different providers, however the general trends are the same.

Webby % Off 52 WeekThis indicator measures a stocks distance from its 52 week high. The concept is based on what Mike Webster shared on his appearance on IBD Live, allowing users to see if a current pullback from the highs is normal compared to historical pullbacks or if more attention is warranted.
It is also important to pay attention to a stocks 52 week high in relation to it's current price to confirm trend, spot potential breakout levels or see if the high acts as an area of resistance.
The indicator has 3 different zones with shaded backgrounds to easily spot the distance off of the high.
Zones
Green Zone - 0 to 8% off highs
Yellow Zone - 8 to 15% off highs
Red Zone - 15 to 25% off highs
Similar Healthy Pullbacks
Possible concern as pullback undercuts previous pullback level

[TTI] Reversion Alert on Nasdaq📜 ––––HISTORY & CREDITS 🏦
This script, titled " Reversion Alert", was developed by TinTinTrading with the intention of creating an easy visual tool based on the relationship between the price and different Exponential Moving Averages (EMAs). It is something TinTinTrading has learned over the years from studying the Investor's Business Daily courses and materials, especially seminars held by William O'Neil.
🎯 ––––WHAT IT DOES 💡
The " Reversion Alert" script monitors the distance between the closing price and the 9-period EMA as well as the distance between the 9-period and 20-period EMAs. It generates an alert when the closing price is far enough away from the 9-period EMA relative to the distance between the two EMAs. The sensitivity of this alert can be adjusted by the user. The script also plots the 9-period and 20-period EMAs on the chart for visual reference. When the distance between the closing price and the 9-period EMA is more than the distance between the 9 and 20 period EMAs (and meets several other coded conditions), the price is likely extended and we can anticipate a pullback within next 1-3 days on the chart.
IMPORTANT - I only use this indicator on the NASDAQ Composite ( NASDAQ:IXIC ) and S&P500 ( SP:SPX ) and Dow Jones Composite ( TVC:DJI ). If you decide to use it for individual assets (equities, crypto or forex) make sure you toggle the sensitivity input so that it makes sense for the asset you are trading.
🛠️ ––––HOW TO USE IT 🔧
After adding the script to your chart, you will see two lines representing the 9-period and 20-period EMAs. You can adjust the sensitivity of the alert using the 'Sensitivity (%)' input in the settings panel. The default sensitivity is set at 18.5%. When an alert condition is met, a downward pointing red triangle with an exclamation mark will appear above the bar. This indicates a potential reversion scenario based on the relative positioning of the closing price and the two EMAs.
If the indicator shows an exclamation mark above the chart we can anticipate a pullback. Some techniques that yuo could apply could be:
👉 Tighten stops
👉 Reduce position size
👉 Harvest profits (or scale down)
👉 Be cautious to add new positions
Remember that this tool is meant to aid in your analysis and not to dictate trades. Always use in conjunction with other tools and your own analysis.

Base Finder DailyThe Base Finder Daily is the companion tool to the original Base Finder which is used to identify consolidation periods in a stock's advance. The Base Finder Daily allows traders to zoom in from the weekly chart and get a more precise view of the daily price action during a basing period.
Base Finder Daily identifies three different types of bases (Flat Base, High Tight Flag, Consolidation) and provides key information about the consolidation such as the depth, length, and pivot point. This information allows traders to compare and analyze the best basing patterns quickly and easily.
This tool helps traders of all levels train their eye to identify potential trading opportunities that might have otherwise gone unnoticed.
Base Finder is a must-have tool for any trader, especially those that have studied the work of William O’Neil. Base Finder stacks up base for base with MarketSmith.
Easily customize the settings, from the look to the intricacies of a consolidation.
Default base settings:
Flat Base
length: 25 days minimum
depth: <= 15%
High Tight Flag
Flag Pole: up 80% or more in less than 40 days
Flag: Less than 25% correction in 10-20 days
Consolidation:
length: minimum 30 days
depth: <= 35%
Notes
This indicator is meant to be used on the daily timeframe.
In order to see the stats labels hover your mouse over the left side high of the consolidation and please make sure the indicator is brought to the front using the visual order of your chart. If the visual order is not correct you will not be able to see the stats label.
Disclaimer:
This indicator is for informational and educational purposes only. Do your own research before making any trade decisions. We accept no liability for any loss or damage, including without limitation any loss of profit, which may arise directly or indirectly from use of or reliance on this indicator.

Market Navigator OscillatorSimilar to the Market Navigator, the Market Navigator Oscillator turns the methodology taught in Market School by Investors Business Daily into an easy-to-use indicator, but in a more condensed form. The Market Navigator Oscillator plots all of the same information as the original Market Navigator, but keeps your main chart clear. This system follows a strict set of rules to help gauge when it's time to increase market exposure or back away.
The indicator considers 24 different buy and sell signals, as well as portfolio management rules, to keep you on the right side of the market with no guesswork.
Buy and sell signals are generated based on different criteria, including the relationship between price and key moving averages, volume, and time. Each signal is assigned a point value, which is then added (buy signal) or subtracted (sell signal) to the running exposure count when the signal occurs. This exposure count is then used to give a recommended maximum exposure level.
The Market Navigator Oscillator also identifies certain instances when being more aggressive is called for, known as a Power Trend. A Power Trend is triggered within the context of an uptrend that meets a certain criterion of price, length, and moving average relationship.
This indicator is a must-have for any trader looking to take the guesswork out of their trading by automating recommended exposure levels and being in step with the market.
Principles covered include:
Recommended maximum portfolio exposure
Buy switch / restraint rules
Follow through / distribution days
Power Trend
Dynamic Day 1
When you first put the indicator on your chart, it will ask you to select Day 1 of the current rally attempt. A Day 1 is defined as either:
The first positive day in a down trending market
A down day where the index closes in the upper half of the daily range
Disclaimer: This indicator is for informational and educational purposes only. Do your own research before making any trade decisions. I accept no liability for any loss or damage, including without limitation any loss of profit, which may arise directly or indirectly from use of or reliance on this indicator.
I am not affiliated with Investor's Business Daily. This is my original interpretation of the rules taught in the Market School Home Study Program.

Market NavigatorThe Market Navigator turns the methodology taught in Market School by Investors Business Daily into an easy-to-use indicator. This system follows a strict set of rules to help gauge when it's time to increase market exposure or back away.
The indicator considers 24 different buy and sell signals, as well as portfolio management rules, to keep you on the right side of the market with no guesswork.
Buy and sell signals are generated based on different criteria, including the relationship between price and key moving averages, volume, and time. Each signal is assigned a point value, which is then added (buy signal) or subtracted (sell signal) to the running exposure count when the signal occurs. This exposure count is then used to give a recommended maximum exposure level.
The Market Navigator also identifies certain instances when being more aggressive is called for, known as a Power Trend. A Power Trend is triggered within the context of an uptrend that meets a certain criterion of price, length, and moving average relationship.
This indicator is a must-have for any trader looking to take the guesswork out of their trading by automating recommended exposure levels and being in step with the market
Principles covered include:
Recommended maximum portfolio exposure
Buy switch / restraint rules
Follow through / distribution days
Power Trend
Customize the indicator so it fits and looks great on your charts!
Multiple ways to view key information
Customize colors
Show or hide different element to see as much or as little information as you want
Highlight the background of Power Trends
Change the bar color of distribution/stall days
Change table position & size
Show or hide key moving averages
Dynamic Day 1
When you first put the indicator on your chart, it will ask you to select Day 1 of the current rally attempt. A Day 1 is defined as either:
The first positive day in a down trending market
A down day where the index closes in the upper half of the daily range
With over 24 buy and sell signals, the built-in reference table makes it simple to crosscheck which signals occur.
Included with this indicator is access to the Market Navigator Oscillator, which plots the exposure count as a line in a separate pane, keeping your main chart uncluttered. This version allows you to see all of the same information in a condensed form.
Disclaimer: This indicator is for informational and educational purposes only. Do your own research before making any trade decisions. I accept no liability for any loss or damage, including without limitation any loss of profit, which may arise directly or indirectly from use of or reliance on this indicator.
I am not affiliated with Investor's Business Daily. This is my original interpretation of the rules taught in the Market School Home Study Program.

Base FinderThe Base Finder is a powerful tool to identify consolidation periods in a stock's advance. With this indicator, traders can effortlessly spot consolidation patterns on their charts providing them with a deeper understanding of the stock's price action.
Base Finder goes beyond identifying consolidation patterns, as it also offers key information about the consolidation such as the depth, length, pivot point, and the number of accumulation or distribution weeks throughout the pattern. This information allows traders to compare and analyze the best basing patterns quickly and easily.
With Base Finder, traders can differentiate between a Flat Base, a High Tight Flag, or a consolidation, like a cup with handle or double bottom base.
This tool helps traders of all levels train their eye to identify potential trading opportunities that might have otherwise gone unnoticed.
Base Finder is a must-have tool for any trader, especially those that have studied the work of William O’Neil. Base Finder stacks up base for base with MarketSmith.
Easily customize the settings, from the look to the intricacies of a consolidation.
Default base and accumulation/distribution settings:
Flat Base
length: 5 weeks minimum
depth: <= 15%
High Tight Flag
Flag Pole: up 80% or more in less than 8 weeks
Flag: Less than 25% correction in 2-4 weeks
Consolidation:
length: minimum 6 weeks
depth: <= 35%
Accumulation Week:
Current candle closes lower, but in the upper half of the weekly closing range on above average volume. OR Current candle closes positive in the upper 40% of the weekly closing range on above average volume.
Distribution Week:
Current candle closes positive, but in the lower quartile of the weekly closing range on above average volume. OR Current candle closes down on the week in the lower half of the weekly closing range on above average volume.
Notes
This indicator is meant to be used on the weekly timeframe.
In order to see the stats labels hover your mouse over the left side high of the consolidation and please make sure the indicator is brought to the front using the visual order of your chart. If the visual order is not correct you will not be able to see the stats label.
Disclaimer:
This indicator is for informational and educational purposes only. Do your own research before making any trade decisions. We accept no liability for any loss or damage, including without limitation any loss of profit, which may arise directly or indirectly from use of or reliance on this indicator.
[TTI] IBD Market School––––History & Credit
This is a game-changer! Fully based on the Market School Home Study Program (Retail Price $1,500), the script takes the strict, rule-based market timing system developed by Investor's Business Daily and makes it into a easy to ready automated indicator. So that you take the ego and emotions out of the equation!
Over the years, many investors have been asking for a highly specific, quantitative method to assist them in navigating the market, stating that their existing system is too qualitative in character and focused too heavily on feel rather than predetermined principles.
The IBD Market School develops a common sense strategy that will help you enter every major market uptrend and prevent you from entering every major market downtrend/ You will discover the crucial market cues you need to pay attention to in order to manage your account with this indicator.
–––––What it does
The indicator uses 10 buys signals that will get you into the market rally early and 14 sell signal that reduce your market exposure before a downtrend.
👉 Buy Sell signals
Follow Through Days and Failed Rally Attempts
Rules around the 21-Day Moving Average
Rules around the 50-Day Moving Average
Strength and Weakness Rules
Downside Reversals
Distribution Rules
👉 Investment Allocation Rules
Recommended Portfolio Market Exposure at any given time
Buy Switch
Restrain Rules
Power-Trend
–––––How to use it
The combination of the Buy and Sell rules, together with the portfolio management rules, make sure that you are in line with the market trend The Market Exposure box gives information on the Recommended % of total portfolio exposure, that is recommended at any given time. The proliferation of Sell rules indicate danger and the Buy Switch, Restraint Rule and Power Trend indicate show how strong or weak are the current market rallies.
The indicator can be applied on any major market index.

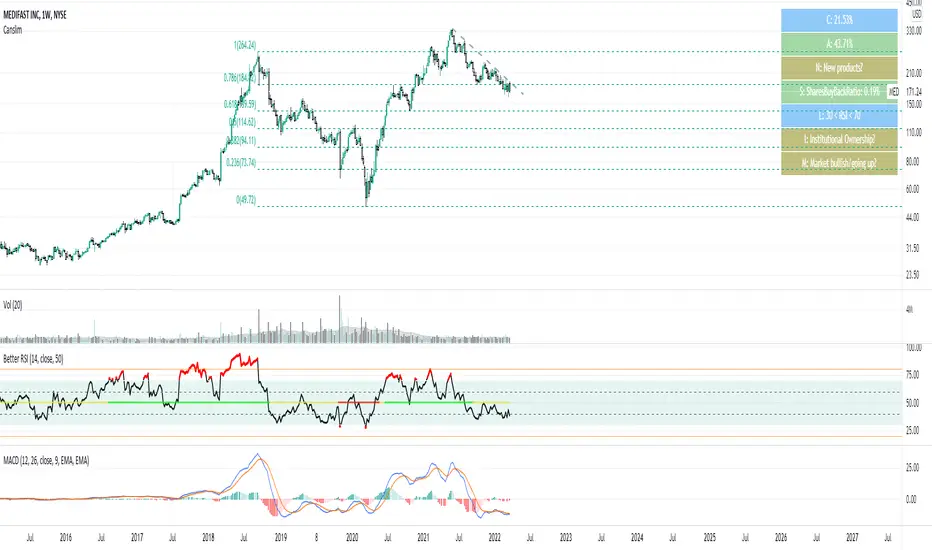
CanslimHey folks, I hope you are doing well!
I made a simple script to determine if a company met the CANSLIM criteria. Some of the criteria are not quantifiable so I left those in olive (you have to do research on those). The rest are quantifiable, which include earnings growth, whether it's a laggard, etc.
CANSLIM is a system developed by William O'Neil for selecting growth stocks by using a combination of fundamental and technical analysis techniques. The stocks that meets the criteria are usually outperformers and return really high gains.
C: Current eps have increased sharply from the same quarter in the prior year. Generally, investors using CANSLIM want EPS growth of over 20%, but the higher the better.
A: Annual earnings increases over the last three (some people use 5 but I prefer 3) years. Annual EPS growth should ideally be in excess of 20% over the last three years.
N: New products, management, or positive new events that push the company's stock to new highs. This type of headline news can cause short-term excitement, propelling a surge of optimism within the market and subsequent. This is also known as a catalyst.
S: Scarce supply coupled with a strong appetite for a stock creates excess demand and an environment in which share prices can soar. Generally, company buying back their own shares, reducing market supply and can indicate an expectation of increased demand along with insider confidence in the firm.
L: Laggard stocks are preferred within the same industry. We can use the RSI to determine whether the company is a laggard or not. An RSI reading below 30 suggests that the stock is oversold and could be undervalued—creating a buying opportunity (bullish). An RSI reading of above 70 signifies that a stock could be overbought or overvalued and could be a chance to sell (bearish). Some people prefer to use "Leader" for the L instead of "Laggard" and I personally think it's a good idea to use both. "Leader" suggests that a stock is a leader in its industry or sector
I: Institutions own the stock (mainly recent above-average performing institutions). For example, this could be a recently public company, still supported by a small handful of well-known private equity firms. Be cautious of stocks that are over-owned by institutions as you want to get in before the big money is fully invested.
M: Market average measures the overall price level of a given market, as defined by a specified group of stocks, such as the Dow Jones Industrial Average. CANSLIM stocks tend to be over-performers in bull markets. Determine the market direction for this one.
The colors:
Green = good
Blue = Neutral/Mediocre
Red = bad
Olive = none/requires own research
Up/Down Volume RatioUp/Down Volume Ratio is calculated by summing volume on days when it closes up and divide that total by the volume on days when the stock closed down.
High volume up days are typically a sign of accumulation(buying) by big players, while down days are signs of distribution(selling) by big market players. The Up Down volume ratio takes this assumption and turns it into a tangible number that's easier for the trader to understand. My formula is calculated using the past 50 periods, be warned it will not display a value for stocks with under 50 periods of trading history. This indicator is great for identify accumulation of growth stocks early on in their moves, most of the time you would like a growth stocks U/D value to be above 2, showing institutional sponsorship of a stock.
Up/Down Volume value interpretation:
U/D < 1 -> Bearish outlook, as sellers are in control
U/D = 1 -> Sellers and Buyers are equal
U/D > 1 -> Bullish outlook, as buyers are in control
U/D > 2 -> Bullish outlook, significant accumulation underway by market makers
U/D >= 3 -> MONSTER STOCK ALERT, market makers can not get enough of this stock and are ravenous to buy more
U/D values greater than 2 are rare and typically do not last very long, and U/D >= 3 are extremely rare one example I kind find of a stock's U/D peaking above 3 was Google back in 2005.
MAKE SURE TO HIT THE SETTINGS WHEEL AND CHECK THE BOX NEXT TO PLOT IN ORDER TO GET RID OF THE PLOTTED LINE.