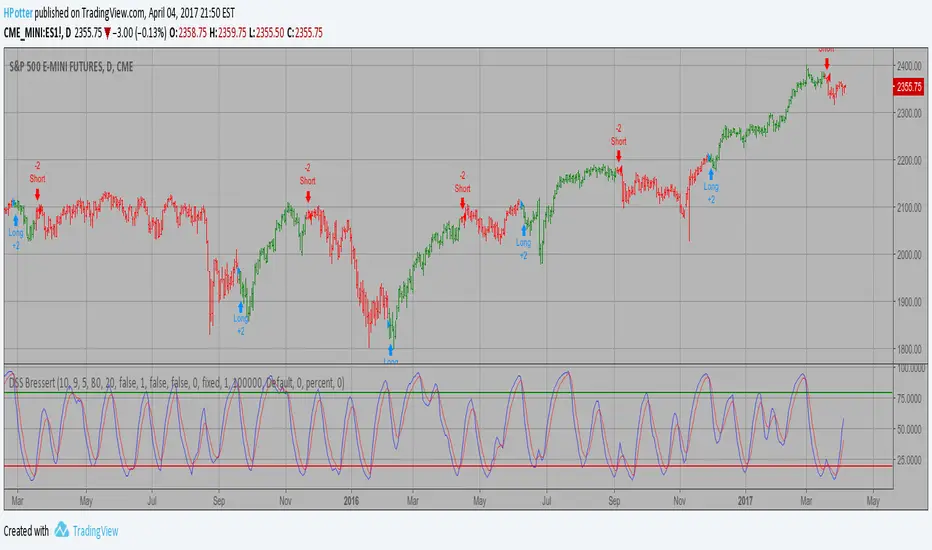
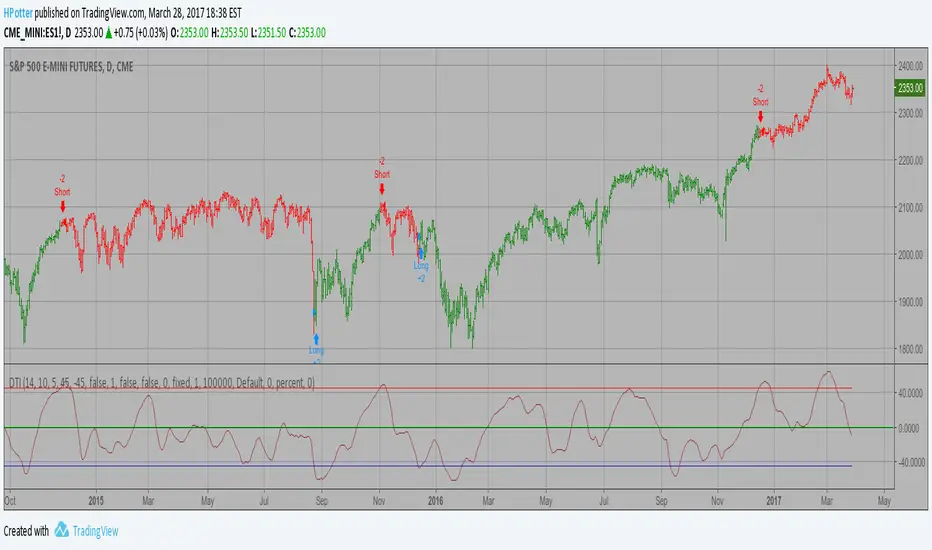
JUVENTUS FC, UNICREDIT, INTESA SANPAOLO, ENI, Apple, Advanced Micro Devices Inc
FTSE MIB, Euro Stoxx 50, Indice DAX, FTSE 100, S&P 500, Nasdaq Composite
Petrolio Brent, Petrolio greggio, Oro, Argento, Gas naturale, Bitcoin
Italia 10Y, Euro Bund, Germania 10Y, Francia 10Y, UK 10Y, US 10Y
This indicator is based on Bill Williams` recommendations from his book "New Trading Dimensions". We recommend this book to you as most useful reading. The wisdom, technical expertise, and skillful teaching style of Williams make it a truly revolutionary-level source. A must-have new book for stock and commodity traders. The 1st 2...
This technique was described by William Blau in his book "Momentum, Direction and Divergence" (1995). His book focuses on three key aspects of trading: momentum, direction and divergence. Blau, who was an electrical engineer before becoming a trader, thoroughly examines the relationship between price and momentum in step-by-step examples. From this...
This is combo strategies for get a cumulative signal. First strategy This System was created from the Book "How I Tripled My Money In The Futures Market" by Ulf Jensen, Page 183. This is reverse type of strategies. The strategy buys at market, if close price is higher than the previous close during 2 days and the meaning of 9-days Stochastic Slow...
Double Smoothed Stochastics (DSS) is designed by William Blaw. It attempts to combine moving average methods with oscillator principles. You can change long to short in the Input Settings Please, use it only for learning or paper trading. Do not for real trading.
Accumulation is a term used to describe a market controlled by buyers; whereas distribution is defined by a market controlled by sellers. Williams recommends trading this indicator based on divergences: Distribution of the security is indicated when the security is making a new high and the A/D indicator is failing to make a new high. Sell. ...
This indicator plots the oscillator as a histogram where blue denotes periods suited for buying and red . for selling. If the current value of AO (Awesome Oscillator) is above previous, the period is considered suited for buying and the period is marked blue. If the AO value is not above previous, the period is considered suited for selling...
The Accelerator Oscillator has been developed by Bill Williams as the development of the Awesome Oscillator. It represents the difference between the Awesome Oscillator and the 5-period moving average, and as such it shows the speed of change of the Awesome Oscillator, which can be useful to find trend reversals before the Awesome Oscillator does. You...
The Klinger Oscillator (KO) was developed by Stephen J. Klinger. Learning from prior research on volume by such well-known technicians as Joseph Granville, Larry Williams, and Marc Chaikin, Mr. Klinger set out to develop a volume-based indicator to help in both short- and long-term analysis. The KO was developed with two seemingly opposite goals in mind:...
Accumulation is a term used to describe a market controlled by buyers; whereas distribution is defined by a market controlled by sellers. Williams recommends trading this indicator based on divergences: Distribution of the security is indicated when the security is making a new high and the A/D indicator is failing to make a new high. Sell. ...
The SMI Ergodic Indicator is the same as the True Strength Index (TSI) developed by William Blau, except the SMI includes a signal line. The SMI uses double moving averages of price minus previous price over 2 time frames. The signal line, which is an EMA of the SMI, is plotted to help trigger trading signals. Adjustable guides are also given to fine tune...
This is combo strategies for get a cumulative signal. First strategy This System was created from the Book "How I Tripled My Money In The Futures Market" by Ulf Jensen, Page 183. This is reverse type of strategies. The strategy buys at market, if close price is higher than the previous close during 2 days and the meaning of 9-days Stochastic Slow...
This is one of the techniques described by William Blau in his book "Momentum, Direction and Divergence" (1995). If you like to learn more, we advise you to read this book. His book focuses on three key aspects of trading: momentum, direction and divergence. Blau, who was an electrical engineer before becoming a trader, thoroughly examines the...
The SMI Ergodic Indicator is the same as the True Strength Index (TSI) developed by William Blau, except the SMI includes a signal line. The SMI uses double moving averages of price minus previous price over 2 time frames. The signal line, which is an EMA of the SMI, is plotted to help trigger trading signals. Adjustable guides are also given to fine tune...
This indicator calculates 3 Moving Averages for default values of 13, 8 and 5 days, with displacement 8, 5 and 3 days: Median Price (High+Low/2). The most popular method of interpreting a moving average is to compare the relationship between a moving average of the security's price with the security's price itself (or between several moving averages).
This is one of the techniques described by William Blau in his book "Momentum, Direction and Divergence" (1995). If you like to learn more, we advise you to read this book. His book focuses on three key aspects of trading: momentum, direction and divergence. Blau, who was an electrical engineer before becoming a trader, thoroughly examines the relationship...
EXPERIMENTAL: fixed some mixed signals :p request for MarxBabu.