Williams %R /w BollingerWilliams %R V2 with Bollinger Bands
Due to the positive messages i got for the first version of "%R MA" indicator, i decided to develop an extended version of “%R MA” and I introduce you “%R V2 with Bollinger Bands”
Enhanced with additional features, such as Bollinger Bands to analyse waves, which can help traders determine if there is a buy or sell signal about to occur.
What’s changed?
V2 inherits all of the features of the first indicator and contains several additional features such as:
-Bollinger Bands
-Additional type of moving average to help to determine support and resistance levels.
-Background color change in case of possible trend reversal.
-Williams %R line colors to determine if the current is strong enough to continue or it’s a reversal.
-More customization
New Visuals
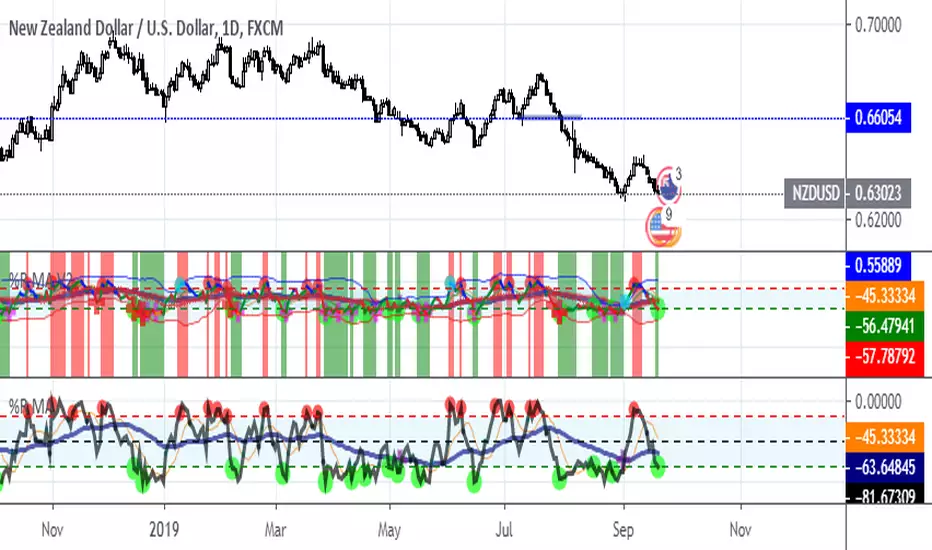
Background coloring comes by default and transparency level is adjustable, so traders can make it more or less visible any time they want. Background color turns red when Williams crosses overbought level and turns green when it crosses oversold level. This way trader can spot and analyse duration of overbought and oversold phase for the stocks/commodities/currencies they want. Rather than just giving only a signal, background colors also could be useful to determine, how the certain stock/commodity/currency behaved at certain levels before.
Red Line:
Red line is the newly introduced moving average for this indicator, which helps to determine resistance and support levels for Williams moves. It’s very similar to WMA;but it responds to price changes/moves much faster.
Bollinger Bands:
This is the key feature of this indicator. As a standalone indicator, it’s mostly used to monitor volatility and have certain strategies while entering or exiting a trade. Since price changes reflects to Williams indicator, I thought applying Bollinger Bands on Williams would be a good idea. Although, it requires at least basic knowledge of Bollinger Bands, it’s still quite easy to use since there are circles/crosses to warn traders for possible trend changes. Red little crosses at the middle represents Bollinger Bands moving average, so when Williams crossover continue to uptrend, that’s a buy signal. If %R reaches to Bollinger Upper Bands and crosses the band, it’ll draw a circle (aqua) to warn traders that the certain stock/currency is now at overbought area and be ready to sell. If you are using a trailing stop-loss, make sure you move your stop-loss in case if a sudden bearish move happens.
Similar to overbought bands, oversold bands act similar and when %R line crosses Bollinger Lower Bands, it’ll draw a red cross which indicates, trend might make a reversal so if you are in a short position you can either close your position or if you are using a trailing stop-loss method, make sure you have you set your stops at profitable levels, in case if there is a sudden bullish move. If you are waiting for a buy signal, wait for a confirmation both from chart and the indicator.
Also if both Bollinger Bands get closer to moving average in the middle, that usually leads to a huge move for both directions. Although, if that happens where there are several oversold(buy) signals, that usually leads to an explosive uptrend move. Same goes for the overbought(sell) signal.
As for any indicator, traders should always wait for a confirmation to buy and sell. And should not rely on a single indicator. Certain stocks/currencies may make unexpected moves so monitor price and trend changes closely on the chart as well.
Williams Line Colors:
Green line mostly represents an uptrend and as long as it goes up with the same color, that means price is still going up and uptrend still continues. If there are are small moves with red or blue lines in the middle of this move, that might be a small retracement, if that happens, make sure to watch out for the next candle. If move ends up with an overbought signal, trend may make a reversal. If current or upcoming candle manages to close above the previous candle, Williams will continue to draw a green line.
Blue line indication depends on the move length. If that happens during an uptrend, this move might end up with a small retracement. However, if blue line appears after an overbought signal, that means there might be a considerable retracement. Blue lines only appear closer to overbought levels and once it breaks WMA and red line support, color will be changed to red from blue. Blue line should be considered as reversal signal along with the overbought visuals. Also, if prices consolidate around similar prices; but each new bar closes below the previous bar, Williams will continue to draw a blue line, until it reaches to certain lower or upper level.
Red/Orange line appears when prices could not keep up and candles continues to make lower closes. This line is an indication of a downtrend and will appear below -50 level which is somewhat middle for this indicator. Orange lines appear almost at the bottom most of the time if there are no new lower lows at the present, these signals can be used to buy from the low. Although traders should wait for a green line and a green candle confirmation. If there are one or more oversold signals close to both red and orange lines, that will strengthen the possibility of a buy signal.
FX:NZDUSD
COINBASE:ETHUSD
OANDA:XAUUSD
Williams %R (%R)
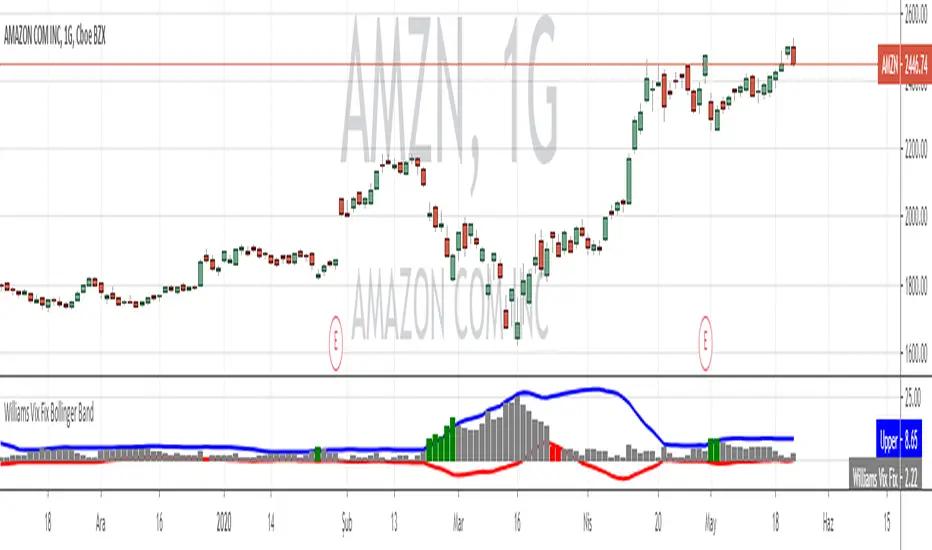
Williams Vix Fix paired with Supertrend HeatmapThis script shows my mod of the powerful Williams' Vix Fix indicator paired with a modified Supertrend Heatmap, originally created by Daveatt.

Willams %R with 13 EMA and Divergence FinderWilly 13 EMA
Features:
- Divergence finder
- Extreme conditions highlight

Haos Visual @PuppyTherapyToday I am bringing to you my interpretation of the Haos Visual Oscillator with a trend which is derived from two Williams R% indicators smoothed by T3. I have been inspired by this idea in the following post.
www.prorealcode.com
Is a pretty unique indicator indeed that due to its smoothing provide nice entries. Your Entry signal is when the histogram, which is the longer term willy is green that signalizes strong bullish momentum. If you then receive a momentum change which is the dot on the short willy or you breach the -30 to -40 area it is a strong buy signal.
Also, this is my first V4 Script thanks to Tradingview to adding to the platform :)

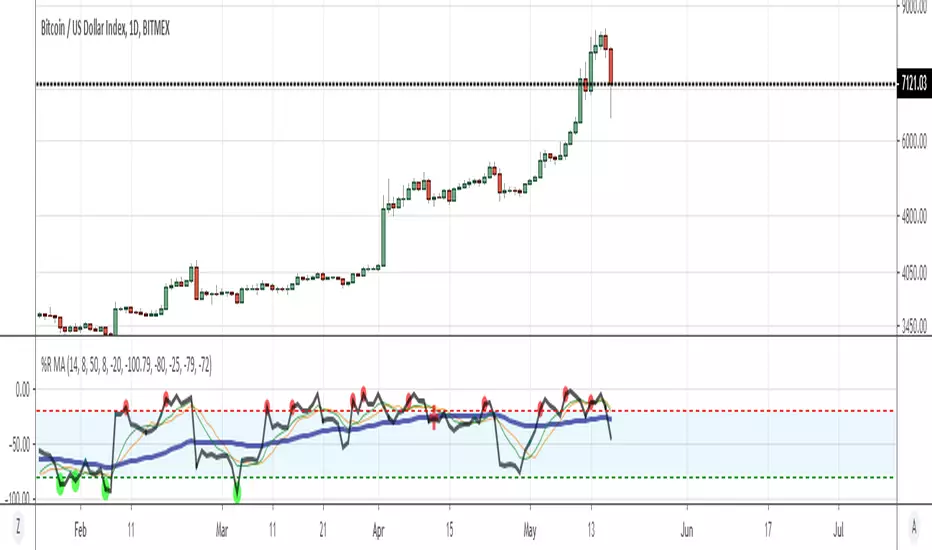
Williams %R with MA-EMA-WMAWilliams %R is a momentum indicator that is the inverse of the Fast Stochastic Oscillator. Also referred to as %R, Williams %R reflects the level of the close relative to the highest high for the look-back period. However, bare-metal version of Williams %R does not indicate where the trend is heading and only gives you buy and sell signals, whenever it crosses over or under certain levels. In order to improve this indicator i decided to add few things, in order to see where the trend is heading while Williams %R giving you buy and sell signals at the same time.
Information:
This indicator comes with adjustable (ma-ema and wma) moving averages, applied on Williams %R signal. So whenever Williams %R crossover SMA or EMA it's an indication of stock/coin price is moving upwards while it crossunder SMA or EMA values, it's an indication of price will go downwards. Convincigly though each crosspoints have their own custom colors, so you can identify if it's going up or down.
Oversold and Overbought Visuals:
Whenever Williams %R crossover overbought area, it will draw an orange circle, which indicates the direction of the trend is about to end and price of that stock/coin may fall. Anything over -20 is considered as Overbought.
Convincigly when Williams %R crossunder oversold area, it will drawn lime color circle, which indicates that the stock/coin may have reached at it's bottom and trend change is expected. Anything below -80 is considered as Oversold and could be used as buying zone.
Trend following with WMA:
As mentioned earlier, while Willams %R gives you reliatively good buy and sell points, it does not show you the whole picture, thanks to it's jagged nature. If the certain stock/coin in a falling trend, Williams %R may give you numerous buy and sell signals; but won't show you if it's going to get lower or higher. Thanks to WMA, it filters most of the jagged signals and gives you an idea of where the trend is heading, also offers key turning points (trend overbought and oversold areas)
Whenever WMA draws a red cross on top, it indicates the following trend is about the change and if you have not sold the stocks/coins you are holding, you may only have small amount of time left to do so. And when WMA draws a green cross at the bottom, it's an indication of strong buy signal and the downtrend is about to end. Although for both of these keypoints, you should always confirm it via Williams %R signals and candlesticks as well.
There is also something called midpoint. Whenever WMA draws purple circle at specific levels(which is also adjustable) it will give you an idea of trend may change it's direction if it's going upwards or downwards. These circles do not offer you a buy or sell signal and only informs you about where trend is heading or where it might make a reversal. You can also adjust overbought-oversold and midpoint levels for your own liking.
El Tangonator StrategyStrategy for my El Tangonator indicator. Optimized for Bitmex XBTUSD 4h chart. It includes pointers for entry, target and stop loss.
Available only to TRI members.

Williams %R IndicatorDeveloped by Larry Williams, Williams %R is a momentum indicator much like the Stochastic Oscillator and is especially popular
for measuring overbought and oversold levels. The scale ranges from 0 to -100 with readings from 0 to -20 considered overbought,
and readings from -80 to -100 considered oversold. Typically, Williams %R is calculated using 14 periods and can be used on intraday,
daily, weekly or monthly data.
This implementation is enhanced with CCI in the form of background colors as a confirming signal and an indication of a prevailing trend.

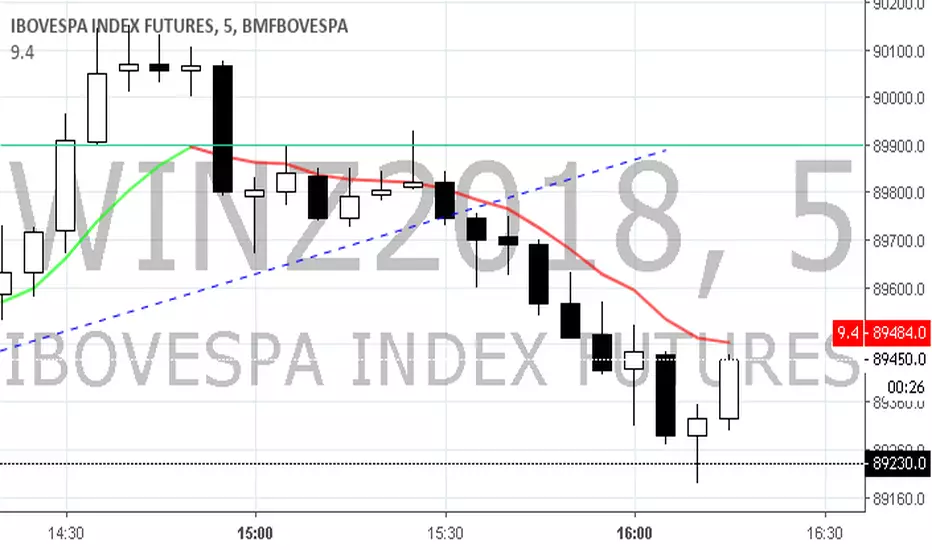
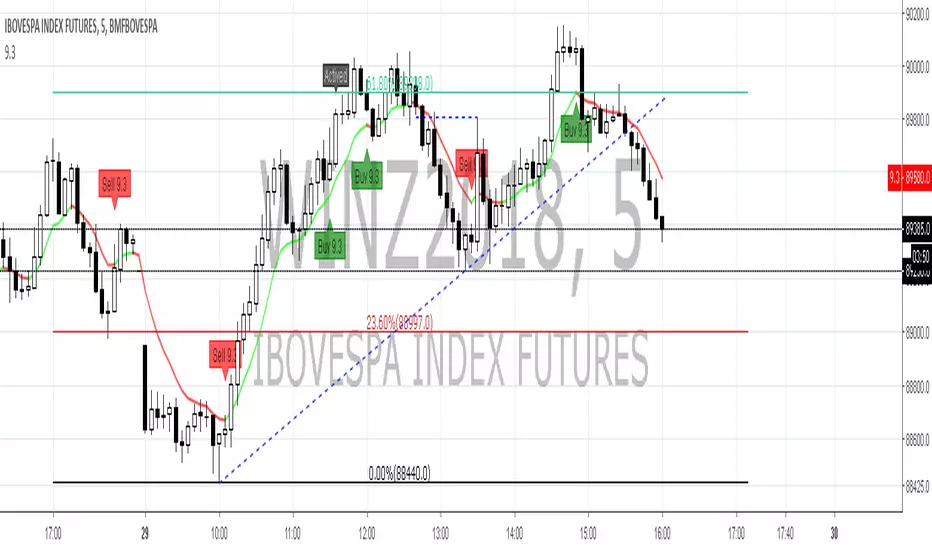
Setup 9.4 - Larry Williams---IN-US---
Hi traders, this simple setup was created by the professional Trader Larry Willians.
This trade system is based on 9 EMA .
Setup EMA 9.3
1) Find a stock with 9 EMA uptrend and turns down, but the low of the candle which made turn go down can't be lose, 9 EMA can go down ONLY ONE candle.
2) Wait for 9 EMA go up in the next candle and mark the high.
3) If the price doesnt across the high, mark the next high.
4) Buy when the price cross the mark.
5) Stop-loss in the low of the marked candle.
--PT-BR---
Olá traders, setup universal, criado pelo famoso Trader Larry Williams , e divulgado pelo Trader Palex. Setup baseado na MME de 9 períodos.
Setup MME 9.4
1) Achar ativo com a MME9 esteja subindo; A MME9 vem subindo e vira para baixo, mas o candle que fez essa virada ocorrer não tem a mínima perdida e a MME9 volta a virar para cima no candle seguinte. Só pode ficar virada pra baixo 1 candle e logo no candle seguinte a média vira pra cima.
2) Marcamos a máxima do candle que fez a MME9 virar para cima e no seu rompimento temos a entrada na
ponta compradora.
3) Se a máxima não for rompida, marcar a próxima máxima;
4) Compra no rompimento dessa máxima (qualquer negócio acima dessa máxima);
5)Stop-loss na mínima do candle que fez a MME9 virar para baixo.
Bons trades a todos.
Setup 9.3 - Larry Williams--IN-US---
Hi traders, this simple setup was created by the professional Trader Larry Willians.
This trade system is based on 9 EMA .
Setup 9.3
1) Find a stock with the 9 period EMA uptrend.
2) Look for a close which is followed by two lower closes,
3) Mark the high of the last candle.
4) Buy when the price cross the mark.
5) Stop-loss in the low of the marked candle.
---PT-BR---
Olá traders, setup universal, criado pelo famoso Trader Larry Williams , e divulgado pelo Trader Palex. Setup baseado na MME de 9 períodos.
Setup MME 9.3
1) Achar ativo com a MME9 esteja subindo;
2) Procurar 1 fechamento que seja seguido por dois fechamentos seguidos descendentes (abaixo do "candle referência") e marcar máxima do último candle;
3) Se a máxima não for rompida, marcar a próxima máxima;
4) Compra no rompimento dessa máxima (qualquer negócio acima dessa máxima);
5) Stop na mínima do candle anterior ao que gerou a entrada;
Setup 9.2 - Larry Williams---IN-US---
Hi traders, this simple setup was created by the professional Trader Larry Willians.
This trade system is based on 9 EMA.
Setup EMA 9.2
1) Find a stock with 9 EMA uptrend.
2) Wait for a close below the last candle low and mark the high of it candle.
3) If the price doesnt across the high, mark the next high.
4) Buy when the price cross the mark.
5) Stop-loss in the low of the marked candle.
---PT-BR---
Olá traders, setup universal, criado pelo famoso Trader Larry Williams, e divulgado pelo Trader Palex. Setup baseado na MME de 9 períodos.
Setup MME 9.2
1) Achar ativo com a MME9 subindo;
2) Aguardar fechamento abaixo da mínima do candle anterior e marcar a máxima desse candle;
3) Se a máxima não for rompida, marcar a próxima máxima;
4) Compra no rompimento dessa máxima (qualquer negócio acima dessa máxima);
5) Stop na mínima do candle anterior ao que gerou a entrada;
Bons trades.

Oscillators EqualizerAn oscillator of the oscillators. This is one of my private indicators that implements a quantitative approach: it collects readings from internal oscillators and calculates scores for the selected metric.
Features
46 well-known oscillators
6 metrics ( Bands Breakouts , Overbought/Oversold , Above/Below Middle Line , Middle Line Crossovers , Above/Below Signal Line , Signal Line Crossovers )
Oscillators customization
Implemented oscillators
Relative Strength Index (by J. Welles Wilder)
Chande Momentum Oscillator (by Tushar S. Chande)
Intraday Momentum Index (by Tushar S. Chande)
Stochastic RSI (by Tushar S. Chande and Stanley Kroll)
Aroon Oscillator (by Tushar S. Chande)
R-Squared Index (by Tushar S. Chande and Stanley Kroll)
Forecast Oscillator (by Tushar S. Chande)
Relative Momentum Index (by Roger Altman)
Moving Average Convergence/Divergence (by Gerald Appel)
Connors RSI (by Larry Connors)
Rapid RSI (by Ian Copsey)
Relative Spread Strength (by Ian Copsey)
Vortex Indicator (by Etienne Botes and Douglas Siepman)
Random Walk Index (by Michael Poulos)
True Strength Index (by William Blau)
Stochastic Momentum Index (by William Blau)
Ergodic Oscillator (by William Blau)
Smoothed Rate Of Change (by Fred G. Schutzman)
TRIX (by Jack Hutson)
Pretty Good Oscillator (by Mark Johnson)
Choppiness Index (by Bill Dreiss)
Tick Line Momentum Oscillator (by Daniel E. Downing)
Price Momentum Oscillator
Relative Volatility Index (by Donald Dorsey)
Trend Trigger Factor (by M. H. Pee)
Trend Intensity Index (by M. H. Pee)
Trend Detection Index (by M. H. Pee)
Trend Continuation Factor (by M. H. Pee)
Relative Vigor Index (by John F. Ehlers)
Fisher Transform (by John F. Ehlers)
CG Oscillator (by John F. Ehlers)
Stochastic CG Oscillator (by John F. Ehlers)
Laguerre RSI (by John F. Ehlers)
Rocket RSI (by John F. Ehlers)
Recursive Median Oscillator (by John F. Ehlers)
Super Passband Filter (by John F. Ehlers)
Roofing Filter (by John F. Ehlers)
Ehlers Stochastic (by John F. Ehlers)
Fisherized Deviation-Scaled Oscillator (by John F. Ehlers)
Bollinger Bands %B (by John Bollinger)
Williams %R (by Larry Williams)
Ultimate Oscillator (by Larry Williams)
Money Flow Index (by Gene Quong and Avrum Soudack)
Commodity Channel Index (by Donald Lambert)
Ease of Movement (by Richard W. Arms)
Chaikin Money Flow (by Marc Chaikin)

Willams %R with 13 EMA and middle pointWillams %R with 13 EMA and middle point. It also uses the textbook formula instead of the Tradingview one.
Xypher Oscillator Bottom-Top FinderThis script uses RSI, Stoch and Williams %R to indicate whenever an asset is highly oversold/overbought
Green background indicates oversold
Red background indicates overbought
Tested with cryptos

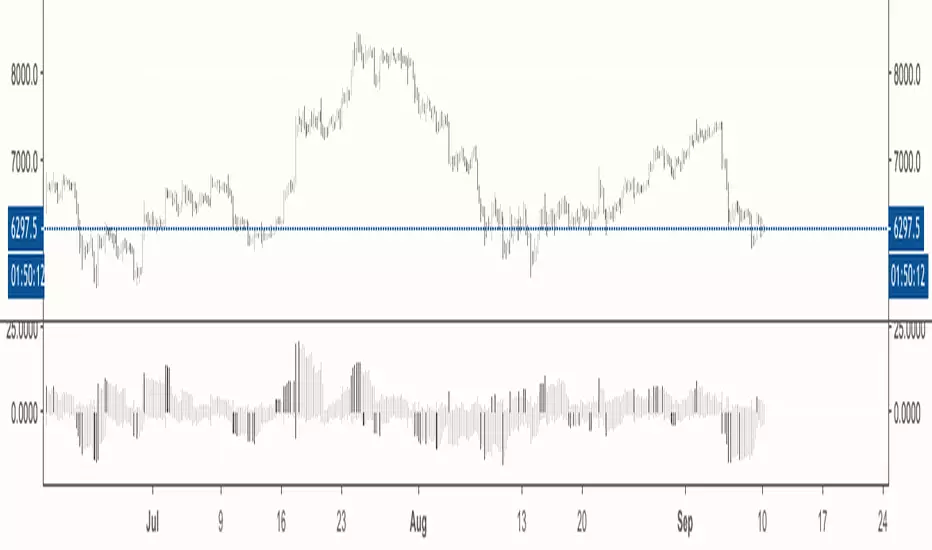
Ergodic CSI Backtest This is one of the techniques described by William Blau in his book
"Momentum, Direction and Divergence" (1995). If you like to learn more,
we advise you to read this book. His book focuses on three key aspects
of trading: momentum, direction and divergence. Blau, who was an electrical
engineer before becoming a trader, thoroughly examines the relationship between
price and momentum in step-by-step examples. From this grounding, he then looks
at the deficiencies in other oscillators and introduces some innovative techniques,
including a fresh twist on Stochastics. On directional issues, he analyzes the
intricacies of ADX and offers a unique approach to help define trending and
non-trending periods.
This indicator plots Ergotic CSI and smoothed Ergotic CSI to filter out noise.
You can change long to short in the Input Settings
WARNING:
- For purpose educate only
- This script to change bars colors.

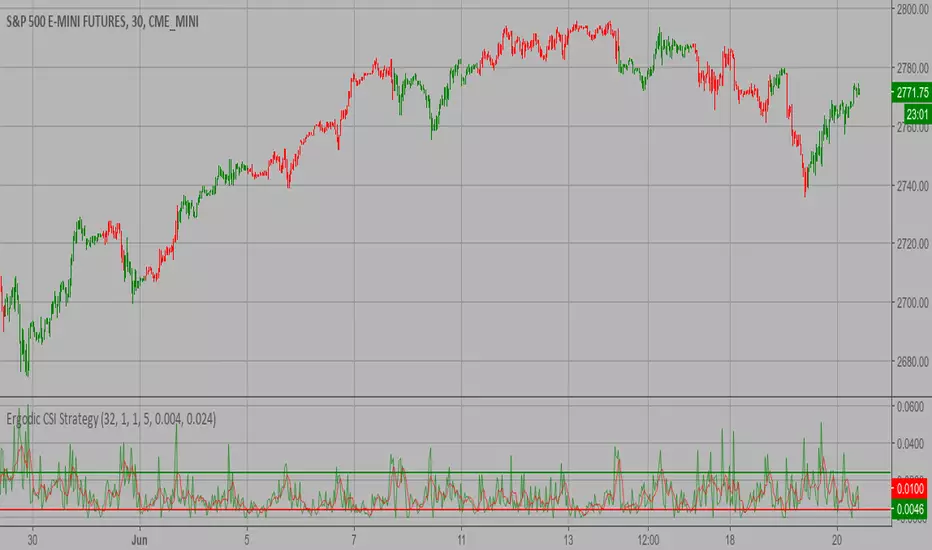
Ergodic CSI Strategy This is one of the techniques described by William Blau in his book
"Momentum, Direction and Divergence" (1995). If you like to learn more,
we advise you to read this book. His book focuses on three key aspects
of trading: momentum, direction and divergence. Blau, who was an electrical
engineer before becoming a trader, thoroughly examines the relationship between
price and momentum in step-by-step examples. From this grounding, he then looks
at the deficiencies in other oscillators and introduces some innovative techniques,
including a fresh twist on Stochastics. On directional issues, he analyzes the
intricacies of ADX and offers a unique approach to help define trending and
non-trending periods.
This indicator plots Ergotic CSI and smoothed Ergotic CSI to filter out noise.
WARNING:
- This script to change bars colors.
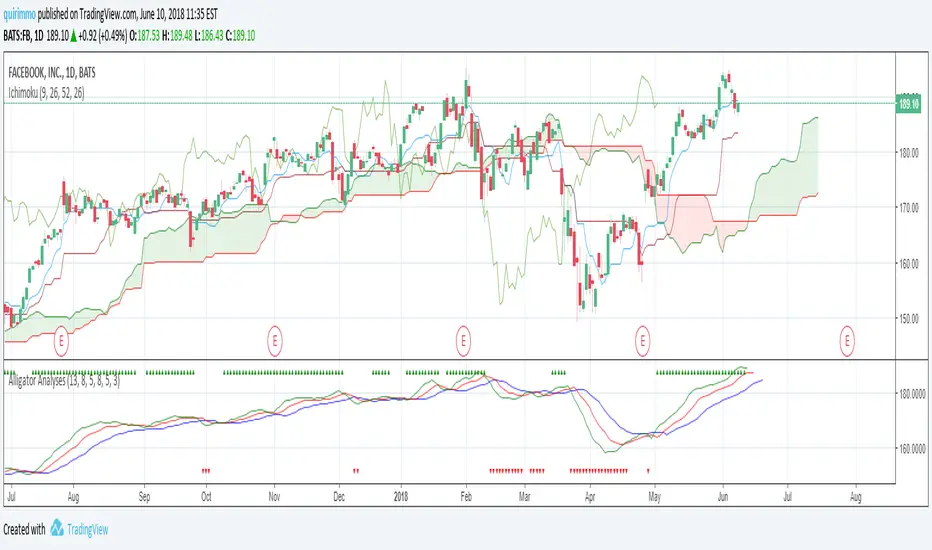
Alligator AnalysesA simple script in order to plot the Alligator Indicator with triangles plotted on the graph in order to see directly if the alligator is sleeping or eating.
You will see green up triangles when the alligator is bullish eating, while red down triangles when the alligator is bearish eating.
You will not see anything on the chart when the alligator is sleeping.
"Cycling Willy" Indicator very good tbuy/sell/trend signals!This oscillator is based on the williams%R combined with EMA's for better signals. it shows momentum and ob/os signals and indicates market cycles.
you can switch between the two EMA's for more direct or filtered signals and smooth the %R if needed.
i added 4 alertconditions to be triggered on crossovers of signal EMA and Filter EMA.
please let me know in the comments what you think about the indicator!!
happy trading!
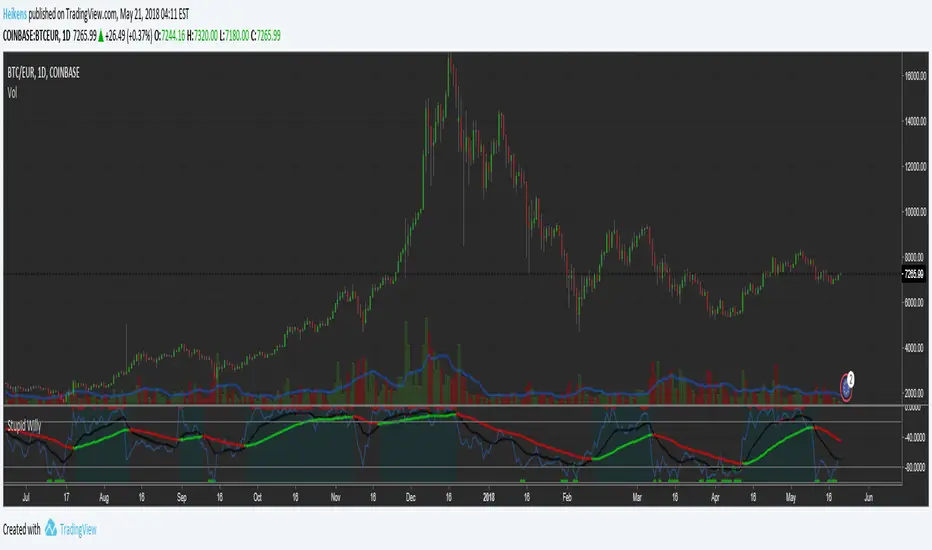
Willy Magnus
williams%R with EMA's tot filter out noise and trend signals. bgcolor to indicate cycles with top/bottom signals.
inspired on the rational flibbr and magnus indicators by magnus tradinggroup and flibbr!
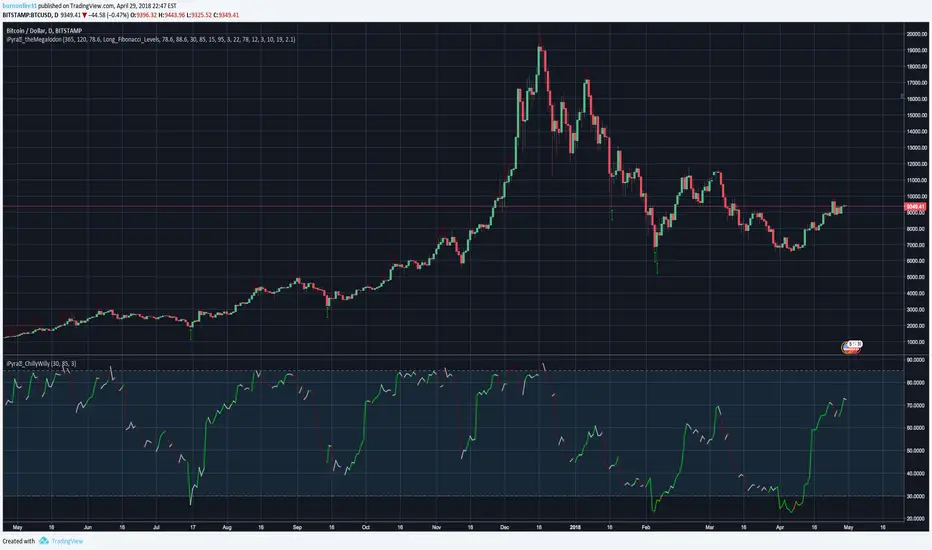
iPyra◬_ChillyWillyCHILLYWILLY
ChillyWilly looks for the momentum trades.
ChillyWilly combines the 4 different well known momentum indicators to bring the best signals.
ChillyWilly works with any kind of market state, any kind of trading, and any kind of asset.
ChillyWilly has more features than any other momentum indicator in the market: Combining shorter term momentum with longer term momentum, and looking for M's and W's for you.
--------------------------------------
ChillyWilly is designed for longer time frame traders and investors.
All you have to do is:
1- Use it like you would use RSI (ChillyWilly is ranging between 0-100 --> Closer to 0 means Long ~~ Closer to 100 means short)
2- Look for green or orange lines. (Orange means momentum is BOTH in a good location to long and showing a W ; Green means EITHER momentum is in a good location to long or showing a W)
3- Look for red or maroon lines. (Red means momentum is BOTH in a good location to short and showing a M ; Green means EITHER momentum is in a good location to short or showing a M)
------------------------------------------------------------
iPyra◬
Enlighten others
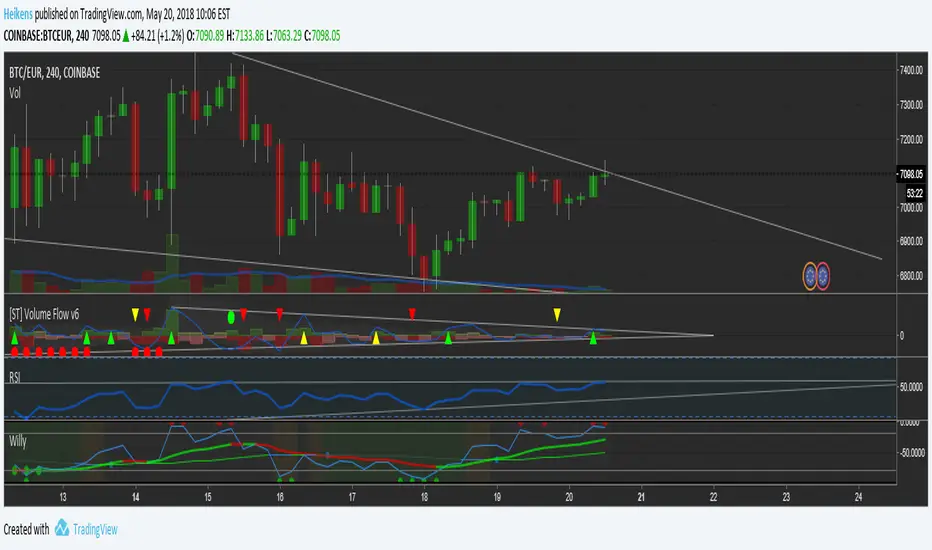
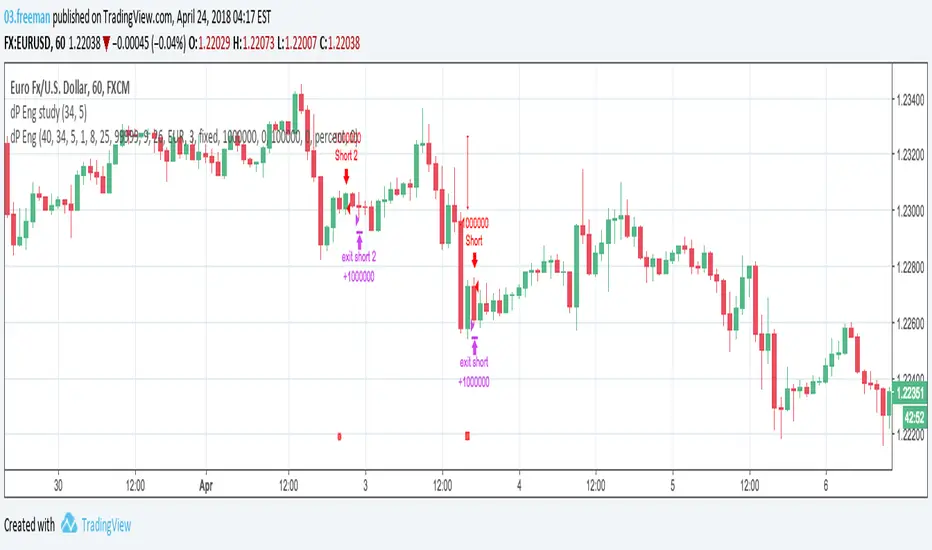
Engineered strategyThis strategy is based on volumes and Bill Williams indicators.
The idea is simple:
- if price has enough boost then follow the trend
- if the boost is slowing down then bet on trend reversal
Results are very good: look at maximum drawdown and percent profitable.
If you are intested on this strategy, I devoleped also the study with alarms.
I will post results on multi-timeframes.
Cryptopeep RSI, Stochastic RSI, Stochastic and Williams %R, 4in14 Charts all in one chart, RSI, Stochastic RSI, Stochastic and Williams %R
Hope you like, please let me know your thoughts.
If you would like to be kept up to date please FOLLOW us and try our indicators and strategies here: uk.tradingview.com
If you like it please click the LIKE button.
