GKD-C Zero-Lag MACD [Loxx]Giga Kaleidoscope Zero-Lag MACD is a Confirmation module included in Loxx's "Giga Kaleidoscope Modularized Trading System".
█ Giga Kaleidoscope Modularized Trading System
What is Loxx's "Giga Kaleidoscope Modularized Trading System"?
The Giga Kaleidoscope Modularized Trading System is a trading system built on the philosophy of the NNFX (No Nonsense Forex) algorithmic trading.
What is an NNFX algorithmic trading strategy?
The NNFX algorithm is built on the principles of trend, momentum, and volatility. There are six core components in the NNFX trading algorithm:
1. Volatility - price volatility; e.g., Average True Range, True Range Double, Close-to-Close, etc.
2. Baseline - a moving average to identify price trend
3. Confirmation 1 - a technical indicator used to identify trends.
4. Confirmation 2 - a technical indicator used to identify trends.
5. Continuation - a technical indicator used to identify trends.
6. Volatility/Volume - a technical indicator used to identify volatility/volume breakouts/breakdown.
7. Exit - a technical indicator used to determine when a trend is exhausted.
How does Loxx's GKD (Giga Kaleidoscope Modularized Trading System) implement the NNFX algorithm outlined above?
Loxx's GKD v1.0 system has five types of modules (indicators/strategies). These modules are:
1. GKD-BT - Backtesting module (Volatility, Number 1 in the NNFX algorithm)
2. GKD-B - Baseline module (Baseline and Volatility/Volume, Numbers 1 and 2 in the NNFX algorithm)
3. GKD-C - Confirmation 1/2 and Continuation module (Confirmation 1/2 and Continuation, Numbers 3, 4, and 5 in the NNFX algorithm)
4. GKD-V - Volatility/Volume module (Confirmation 1/2, Number 6 in the NNFX algorithm)
5. GKD-E - Exit module (Exit, Number 7 in the NNFX algorithm)
(additional module types will added in future releases)
Each module interacts with every module by passing data between modules. Data is passed between each module as described below:
GKD-B => GKD-V => GKD-C(1) => GKD-C(2) => GKD-C(Continuation) => GKD-E => GKD-BT
That is, the Baseline indicator passes its data to Volatility/Volume. The Volatility/Volume indicator passes its values to the Confirmation 1 indicator. The Confirmation 1 indicator passes its values to the Confirmation 2 indicator. The Confirmation 2 indicator passes its values to the Continuation indicator. The Continuation indicator passes its values to the Exit indicator, and finally, the Exit indicator passes its values to the Backtest strategy.
This chaining of indicators requires that each module conform to Loxx's GKD protocol, therefore allowing for the testing of every possible combination of technical indicators that make up the six components of the NNFX algorithm.
What does the application of the GKD trading system look like?
Example trading system:
Backtest: Strategy with 1-3 take profits, trailing stop loss, multiple types of PnL volatility, and 2 backtesting styles
Baseline: Hull Moving Average as shown on the chart above
Volatility/Volume: Average Directional Index (ADX) as shown on the chart above
Confirmation 1: Zero-Lag MACD as shown on the chart above
Confirmation 2: Williams Percent Range
Continuation: Fisher Transform
Exit: Rex Oscillator
Each GKD indicator is denoted with a module identifier of either: GKD-BT, GKD-B, GKD-C, GKD-V, or GKD-E. This allows traders to understand to which module each indicator belongs and where each indicator fits into the GKD protocol chain.
Giga Kaleidoscope Modularized Trading System Signals (based on the NNFX algorithm)
Standard Entry
1. GKD-C Confirmation 1 Signal
2. GKD-B Baseline agrees
3. Price is within a range of 0.2x Volatility and 1.0x Volatility of the Goldie Locks Mean
4. GKD-C Confirmation 2 agrees
5. GKD-V Volatility/Volume agrees
Baseline Entry
1. GKD-B Baseline signal
2. GKD-C Confirmation 1 agrees
3. Price is within a range of 0.2x Volatility and 1.0x Volatility of the Goldie Locks Mean
4. GKD-C Confirmation 2 agrees
5. GKD-V Volatility/Volume agrees
6. GKD-C Confirmation 1 signal was less than 7 candles prior
Continuation Entry
1. Standard Entry, Baseline Entry, or Pullback; entry triggered previously
2. GKD-B Baseline hasn't crossed since entry signal trigger
3. GKD-C Confirmation Continuation Indicator signals
4. GKD-C Confirmation 1 agrees
5. GKD-B Baseline agrees
6. GKD-C Confirmation 2 agrees
1-Candle Rule Standard Entry
1. GKD-C Confirmation 1 signal
2. GKD-B Baseline agrees
3. Price is within a range of 0.2x Volatility and 1.0x Volatility of the Goldie Locks Mean
Next Candle:
1. Price retraced (Long: close < close or Short: close > close )
2. GKD-B Baseline agrees
3. GKD-C Confirmation 1 agrees
4. GKD-C Confirmation 2 agrees
5. GKD-V Volatility/Volume agrees
1-Candle Rule Baseline Entry
1. GKD-B Baseline signal
2. GKD-C Confirmation 1 agrees
3. Price is within a range of 0.2x Volatility and 1.0x Volatility of the Goldie Locks Mean
4. GKD-C Confirmation 1 signal was less than 7 candles prior
Next Candle:
1. Price retraced (Long: close < close or Short: close > close )
2. GKD-B Baseline agrees
3. GKD-C Confirmation 1 agrees
4. GKD-C Confirmation 2 agrees
5. GKD-V Volatility/Volume Agrees
PullBack Entry
1. GKD-B Baseline signal
2. GKD-C Confirmation 1 agrees
3. Price is beyond 1.0x Volatility of Baseline
Next Candle:
1. Price is within a range of 0.2x Volatility and 1.0x Volatility of the Goldie Locks Mean
3. GKD-C Confirmation 1 agrees
4. GKD-C Confirmation 2 agrees
5. GKD-V Volatility/Volume Agrees
█ Zero-Lag MACD
What is Zero-Lag MACD?
Moving average convergence divergence ( MACD ) is a trend-following momentum indicator that shows the relationship between two moving averages of a security’s price. The MACD is calculated by subtracting the 26-period exponential moving average (EMA) from the 12-period EMA.
This version adds the ability to change the moving average to 60+ different moving averages. This is also Zero-lag which increases the speed at which MACD identifies trends.
You can read about the moving averages here:
Requirements
Inputs
Confirmation 1 and Solo Confirmation: GKD-V Volatility / Volume indicator
Confirmation 2: GKD-C Confirmation indicator
Outputs
Confirmation 2 and Solo Confirmation: GKD-E Exit indicator
Confirmation 1: GKD-C Confirmation indicator
Continuation: GKD-E Exit indicator
Additional features will be added in future releases.
This indicator is only available to ALGX Trading VIP group members . You can see the Author's Instructions below to get more information on how to get access.
Zerolagmacd

Hybrid, Zero lag, Adaptive cycle MACD Backtest (Simple) [Loxx]Simple backtest for Hybrid, Zero lag, Adaptive cycle MACD Backtest (Simple) found here:
What this backtest includes:
-Customization of inputs for MACD calculation
-Take profit 1 (TP1), and Stop-loss (SL), calculated using standard RMA-smoothed true range
-Activation of TP1 after entry candle closes
-Zero-cross entry signal plots
-MACD-Signal cross entry continuations
-Longs and shorts
Happy trading!

Hybrid, Zero lag, Adaptive cycle MACD [Loxx]TASC's March 2008 edition Traders' Tips includes an article by John Ehlers titled "Measuring Cycle Periods," and describes the use of bandpass filters to estimate the length, in bars, of the currently dominant price cycle.
What are Dominant Cycles and Why should we use them?
Even the most casual chart reader will be able to spot times when the market is cycling and other times when longer-term trends are in play. Cycling markets are ideal for swing trading however attempting to “trade the swing” in a trending market can be a recipe for disaster. Similarly, applying trend trading techniques during a cycling market can equally wreak havoc in your account. Cycle or trend modes can readily be identified in hindsight. But it would be useful to have an objective scientific approach to guide you as to the current market mode.
There are a number of tools already available to differentiate between cycle and trend modes. For example, measuring the trend slope over the cycle period to the amplitude of the cyclic swing is one possibility.
We begin by thinking of cycle mode in terms of frequency or its inverse, periodicity. Since the markets are fractal; daily, weekly, and intraday charts are pretty much indistinguishable when time scales are removed. Thus it is useful to think of the cycle period in terms of its bar count. For example, a 20 bar cycle using daily data corresponds to a cycle period of approximately one month.
When viewed as a waveform, slow-varying price trends constitute the waveform's low frequency components and day-to-day fluctuations (noise) constitute the high frequency components. The objective in cycle mode is to filter out the unwanted components--both low frequency trends and the high frequency noise--and retain only the range of frequencies over the desired swing period. A filter for doing this is called a bandpass filter and the range of frequencies passed is the filter's bandwidth .
Indicator Features
-Zero lag or Regular MACD/signal calculation
- Fixed or Band-pass Dominant Cycle for MACD and Signal MA period inputs
-10 different moving average options for both MACD and Signal MA calculations
-Separate Band-pass Dominant Cycle calculations for both MACD and Signal MA calculations
- Slow-to-Fast Band-pass Dominant Cycle input to tweak the ratio of MACD MA input periods as they relate to each other

The Trend Oracle - The Ultimate Position ToolThe Trend Oracle is a superadaptive multi-timeframe Indicator
Ideal timeframes are 4H, and 1D
It is based on a combination of several other indicators including:
- The Superstrength Index - An adaptive indicator using volume weighted average of the traditional RSI, MFI and OBV
- The Superfast MACD - An adaptive zero lag MACD
- ADX Trend - A tweaked version of the ADX
- Chop Zones - A combination of 2 Chop indexes to identify trending and non trending conditions.
- The Adaptive Supertrend - An adaptive version of the Supertrend, (switching multipliers based on the market trend)
- Breakout & Breakdown - An algorithm computing volume compression and expansion to indicate breakout & breakdown signals.
- [bBullish and Bearish Divergences - Confirmed Bull and Bear divs shown as green and red dots at the top and bottom of the indicator.
Areas highlighted in Aqua are bullish, red are bearish.
Use this indicator as a tool to position yourself over longer timeframes.
Enjoy!
MM :)

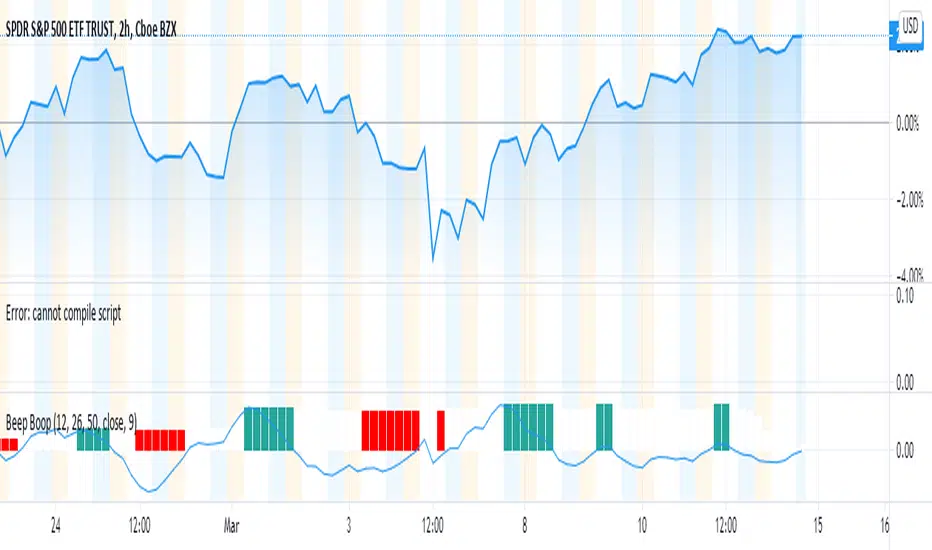
Beep Boop(Improved) Beep Boop Indicator for Trending Markets originally written by Trading Rush.
It is originally based on the MACD 12-26 and the 50 bar EMA.
The macd hist is color coded with green as buy and sell as red.
I added an option to use a couple of lower lag ema's (See line 13 - ema_signal).
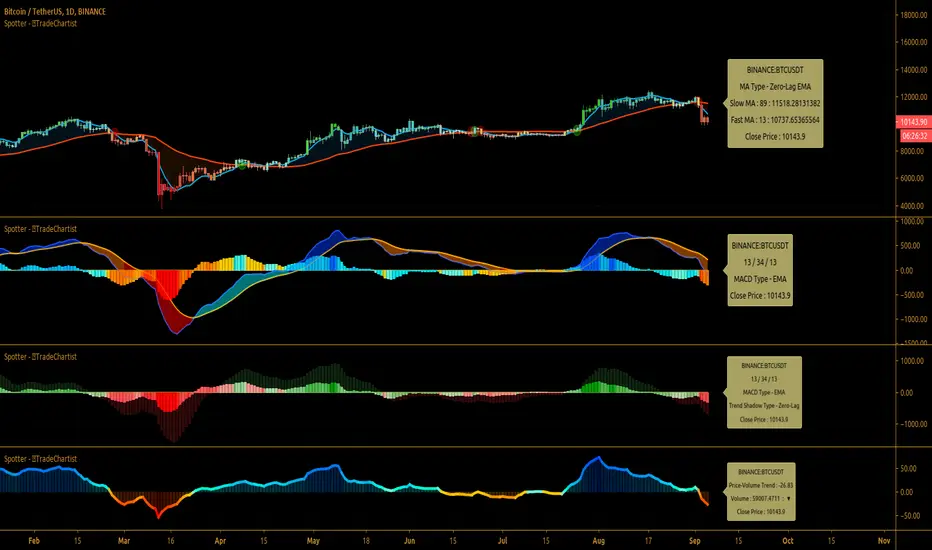
TradeChartist Spotter ™TradeChartist Spotter is a extremely well designed Trader's toolkit that packs a range of trading indicators like MACD, RSI, MA/MA-Crosses and Price-Volume Trend Oscillator, along with visual trade spotting tools like Symbol Tracker, MACD Trend Shadow plot and Coloured Bars, including a handy information Dashboard.
===================================================================================================================
™TradeChartist Spotter Features:
1. MACD
MACD is an essential indicator for any trader to track trend strength and momentum of asset prices. Spotter offers 3 MACD options - SMA, EMA and Zero-Lag EMA . Since MACD is based on moving averages, it is inherently a lagging indicator and may not work well when there is no trend strength or when the market is choppy. It is for this reason Spotter offers the option of Overall Trend Shadow and also the option to display Zero-Lag Trend Shadow on normal MACD based on SMA or EMA. This is based on the average of MACD and Signal plots.
Spotter's default MACD settings are 13/34/13, but this can be changed to the classic settings of 12/26/9 and the user can enable or disable the various elements of the MACD based on their preference.
The Dashboard on the MACD Spotter offers information on the symbol tracked, settings used and also the close price of the asset. This is really useful especially when tracking a different symbol than the current price chart symbol. Note that the actual MACD plot also will be of the symbol tracked if it is not the same as price chart symbol.
Using Zero-Lag Trend Shadow on normal SMA/EMA MACD histogram helps spot trend changes early. It is recommended to test different MACD settings on asset traded to suit trading style and frequency.
If MACD Histogram is disabled to see the Overall Trend better, make sure to switch back on as it should not be confused with the main MACD histogram which tracks the distance between the MACD and Signal plots.
2. RSI
RSI is the classic technical indicator that helps track the price magnitude and velocity of the asset's price movement. It helps spot Oversold and Overbought areas easily as it oscillates between 0 and 100, even though values below 10 and values above 90 are almost never seen. By using a upper band and a lower band plot, it is possible to track the strength of the up or down move.
Spotter's default RSI settings are ohlc4/14/5. EMA smoothing of 5 is used to eliminate the noise, but these can be changed to suit user's preference. The default Upper Band is 60 and Lower Band is 40 in the settings, as price moves above 60 RSI tend to be bullish and price moves below 40 tend to be bearish. This can be changed to 70/30 or 80/20 etc. based on how RSI is being used by the user.
RSI strength can also be visualised on the price bars using Spotter's Coloured Bars. The bar colours can be inverted to help traders see the price action differently.
RSI Dashboard also helps track another symbol, it's RSI value and close price to help the user track another symbol on the same chart. Note that the actual RSI plot also will be of the symbol tracked if it is not the same as price chart symbol.
3. MA/MA-Crosses
Two Moving averages (SMA, EMA or Zero-Lag EMA) can be plotted with MA Crosses using the MA/MA-Crosses Spotter.
The MACD input of Fast MA Length and Slow MA Length is used to plot the MA's. To plot just one MA, same value can be entered in both MA length boxes in the settings.
The plots can be merged with the main price chart by using Move Pane Above and by merging the scales into one.
The Dashboard also helps track another symbol, it's MA plots and close price to help the user track another symbol on the same chart. Note that the actual MA plots also will be of the symbol tracked if it is not the same as price chart symbol.
4. Price-Volume Trend Oscillator
Spotter converts the Price Volume Trend (PVT) into an Oscillator, as it helps spot divergences and makes it easy to plot PVT strength as coloured bars on main price chart.
No user input required for this Oscillator plot. Note: Some Symbols don't have volume information and hence PVT Oscillator will not work on them.
PVT Oscillator Dashboard displays current bar volume (if available) along with the close price. Similar to other plots in the Spotter, the Oscillator is of the symbol tracked if its not the same as price chart symbol.
5. Useful Extras
Coloured Bars - Paints price bars with strength and intensity based on indicator used. Bar Colours can be inverted by enabling Invert Bar Colors option from Spotter settings.
Five Colour Themes - Classic, Acute Classic, Effulgence, Firefly and Hallucination
Background colour - Same as bar colour strength, but painted subtly in the indicator background.
===================================================================================================================
Note:
Alerts can be created using the name of the plot under Alert Condition for Spotter - ™TradeChartist crossing above/below etc based on the type of alert the user wants to get.
The indicator does not repaint. Alerts may display potential repaint warning, but this is because the code uses bar index for the Dashboard. For confidence in the indicator, it can be tested using bar replay to make sure the real-time and bar replay trade entries and plots stay on the same bar/timestamp.
™TradeChartist Spotter can be connected to ™TradeChartist Plug and Trade (Premium Script - not free) to generate Trade Entries, Targets, Sop Loss plots etc and to create all types of alerts. Example chart below using LINK-USDT.
===================================================================================================================
Example Charts
1. BTC-USDT 1 hr chart showing MACD with classic settings 12/26/9 on top pane with normal Overall Trend Shadow and the bottom pane with exact same settings with Zero-Lag Overall Trend Shadow.
2. XAU-USD 4 hr chart showing MACD (13/55/34) using Zero-Lag EMA.
3.ADA-USDT 1 hr chart with Price-Volume Trend Oscillator - Useful for confirming divergences and trade decisions based on volume.
4. SPX 15m chart with RSI (ohlc4,14,5) in bottom pane and 5/34 MA cross Spotter on Price Chart with Dashboard.
5. GBP-USD 1 hr chart with Spotter tracking MACD (13/89/34) of DXY (Different Symbol from GBP-USD on chart)
===================================================================================================================
Best Practice: Test with different settings first using Paper Trades before trading with real money
This is a free to use indicator.
===================================================================================================================
STC w/ Zero Lag MACDSTC + Zero Lag MACD (includes regular MACD also)
What I added here was two other variables
The Schaff Trend Cycle working with Zero Lag Macd to give you double confirmation on your Higher Time Frame entries such as 4H, 6H, and Daily.
You may also turn on regular MACD instead of Zero Lag, if you'd like.
***Red Dot for Bear
***Green Dot for Bull
***Higher Confirmation is:
Red Dot + Red MACD for Bear
Green Dot + Green MACD for Bull
More confirmation to come!
CHEERS
If you would like to get in contact with me, please reach out to me via DM here, or Twitter. It's the best way to get in touch with me in regards to indicators, and market analysis. Enjoy!
-RingoKid

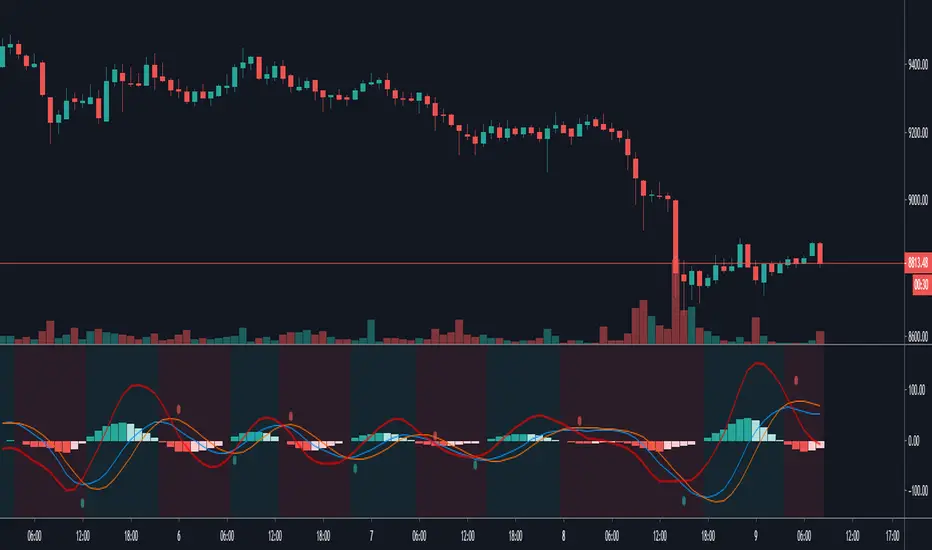
Zero Lag MACD [ChuckBanger]This is an MACD indicator with the ability to use zeror lag moving average instead of exponential moving average. I also added different background color when histogram is over or under center line, MACD Leader, Laguerre filter and dots to indicate when Leader line crosses macd line. Good luck traders!
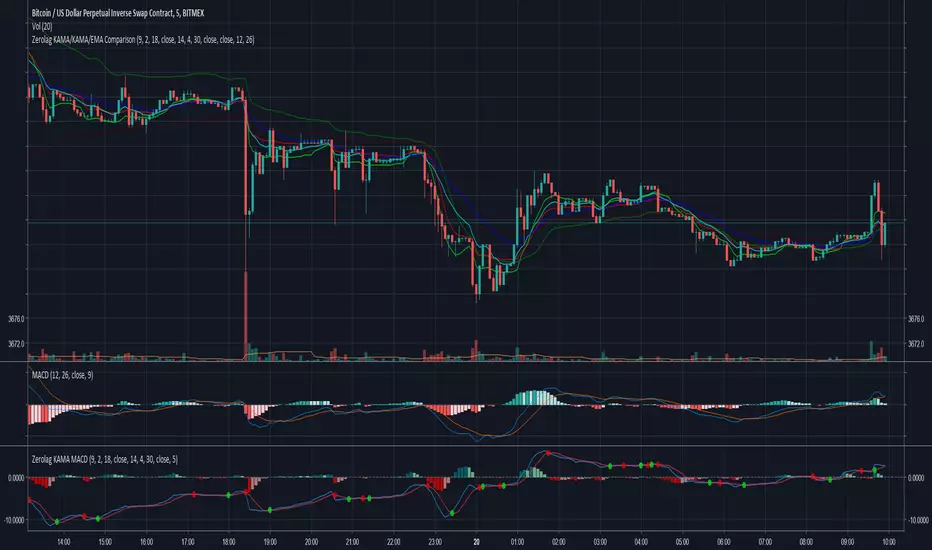
Zerolag KAMA MACDExperimental Zero Lag Adjusted KAMA based MACD.
Uses Kaufman's Adaptive Moving Average (KAMA) instead of the standard EMAs to calculate the MACD with an optional application of the zero lag adjustment.
Significant differences in momentum changes (zero line crossovers), often earlier signal line crossovers and differences in divergences.
Chart displays :
Top : Zero lag adjusted KAMA based MACD
Middle : Unadjusted KAMA based MACD
Bottom : Standard MACD