Smart Trader, Episode 04, by Ata Sabanci, Candles and Z ScoresSmart Trader, Episode 04
Candles and Z-Scores: A Statistical Approach to Market Analysis
━━━━━━━━━━━━━━━━━━━━━━━━━━━━━━━━━━━━━━━━━━━
OVERVIEW
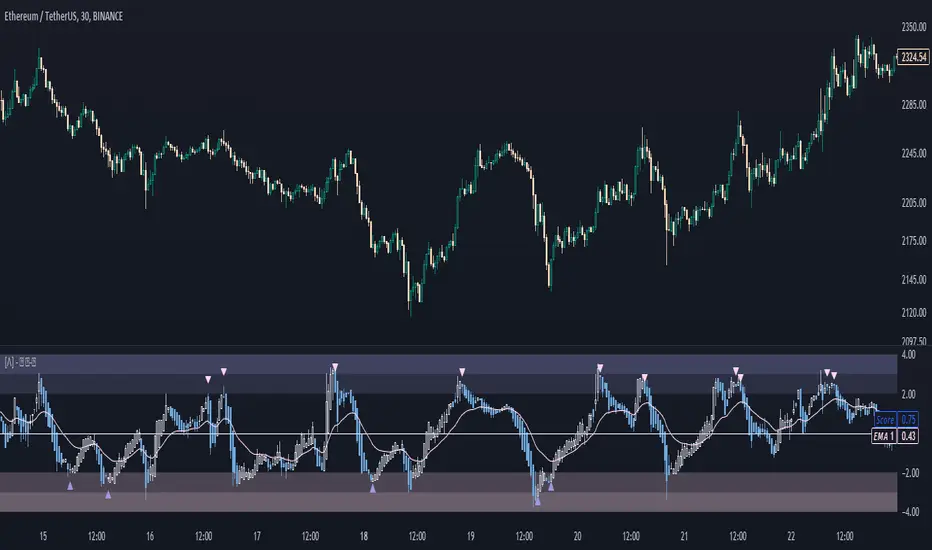
This indicator applies Z-Score statistical analysis to measure how unusual current market conditions are compared to historical norms. It simultaneously analyzes five key metrics: Price, Total Volume, Buy Volume, Sell Volume, and Delta (Buy minus Sell) . The system detects 60 academically-researched market scenarios and provides visual feedback through Z-Lines (support/resistance levels), Event Markers, Trend Channels, and a comprehensive Dashboard.
━━━━━━━━━━━━━━━━━━━━━━━━━━━━━━━━━━━━━━━━━━━
CORE CONCEPT: WHY Z-SCORE?
A Z-Score measures how many standard deviations a value is from its mean. In financial markets, extreme Z-Scores indicate statistically rare events that often precede significant price movements.
Mathematical Formula:
Z = (Current Value - Mean) / Standard Deviation
Interpretation:
• Z ≥ +2.0: Extremely high (occurs approximately 2.5% of the time)
• Z ≥ +1.0: Above average
• Z ≈ 0: Normal (near the mean)
• Z ≤ -1.0: Below average
• Z ≤ -2.0: Extremely low (occurs approximately 2.5% of the time)
━━━━━━━━━━━━━━━━━━━━━━━━━━━━━━━━━━━━━━━━━━━
ACADEMIC FOUNDATION
This indicator is inspired by / grounded in market microstructure literature (abbreviated citations in-script) from market microstructure literature:
• Price-Volume Relationship - Karpoff (1987), Journal of Financial and Quantitative Analysis, Cambridge
Volume is positively correlated with price change magnitude
• Order Flow Imbalance - Cont, Kukanov, Stoikov (2014), Journal of Financial Econometrics
Order imbalance drives price more reliably than raw volume
• Informed Trading (PIN Model) - Easley, Kiefer, O'Hara, Paperman (1996), Journal of Finance
Buy/Sell imbalance reveals informed trader activity
• Mixture of Distributions - Tauchen & Pitts (1983), Clark (1973)
Volume clusters with volatility regimes
• Volume Predictability - Gervais, Kaniel, Mingelgrin (2001)
Volume shocks predict future returns
• Liquidity & Order Imbalance - Chordia, Roll, Subrahmanyam (2002)
Order imbalance affects short-term returns
• Volume-Return Dynamics - Llorente, Michaely, Saar, Wang (2002)
Speculation vs. risk-sharing patterns
• Reversal vs. Continuation - Campbell, Grossman, Wang (MIT)
High volume predicts lower autocorrelation
━━━━━━━━━━━━━━━━━━━━━━━━━━━━━━━━━━━━━━━━━━━
VOLUME ENGINE
The indicator offers two methods for decomposing total volume into Buy and Sell components:
Method 1: Geometry (Approximation)
Uses candle structure to estimate buying and selling pressure:
Buy Volume = Total Volume × (Close - Low) / (High - Low)
Sell Volume = Total Volume × (High - Close) / (High - Low)
• Works on all instruments without additional data requirements
• Fast calculation
• Less precise than intrabar method
Method 2: Intrabar (Precise)
Uses Lower Timeframe (LTF) tick/second data to aggregate actual up-ticks versus down-ticks:
• More accurate volume decomposition
• Requires LTF data availability
• Configurable LTF: 1T (tick), 1S, 15S, 1M
Delta Calculation:
Delta = Buy Volume - Sell Volume
━━━━━━━━━━━━━━━━━━━━━━━━━━━━━━━━━━━━━━━━━━━
Z-SCORE SYSTEM
The system calculates Z-Scores for five metrics simultaneously, using a configurable lookback period (default: 20 bars):
• Zp (Price Z-Score): Measures price deviation from its mean
• Zv (Volume Z-Score): Measures total volume deviation
• Zbuy (Buy Volume Z-Score): Measures buying pressure deviation
• Zsell (Sell Volume Z-Score): Measures selling pressure deviation
• ZΔ (Delta Z-Score): Measures order flow imbalance deviation
Threshold Constants:
• ZH (Z High) = 2.0: Extreme threshold
• ZM (Z Medium) = 1.0: Moderate threshold
• Z0 (Z Zero) = 0.5: Near-zero threshold
Group System:
The analysis window is divided into groups (default: 5 groups × 20 bars = 100 bar total window). Group numbers (1, 2, 3...) are displayed above candles when enabled, helping identify the relative age of detected levels.
━━━━━━━━━━━━━━━━━━━━━━━━━━━━━━━━━━━━━━━━━━━
Z-LINES (SUPPORT/RESISTANCE LEVELS)
When any metric reaches an extreme Z-Score, the system marks that price level as a significant support or resistance zone.
Detection Logic:
• Upper Z-Line: Drawn from the HIGH when Z ≥ upper threshold (default +2.0)
• Lower Z-Line: Drawn from the LOW when Z ≤ lower threshold (default -2.0)
Multi-Metric Detection:
Z-Lines can be triggered by any of the five metrics (Price, Volume, Buy, Sell, Delta). When multiple metrics trigger at similar price levels, they are clustered together into a single combined label showing all contributing metrics.
Persistence:
Z-Lines persist for the entire analysis window (Period × Groups bars) and are NOT removed when price touches them. This allows traders to see historical support/resistance levels that may still be relevant.
Anti-Overlap System:
Labels are automatically repositioned to prevent overlap. The "Label Min Gap (%)" setting controls minimum vertical separation between ALL labels (both upper and lower), ensuring readability even when multiple levels cluster together.
━━━━━━━━━━━━━━━━━━━━━━━━━━━━━━━━━━━━━━━━━━━
EVENT DETECTION ENGINE (60 SCENARIOS)
The system analyzes 60 distinct market scenarios based on Z-Score combinations. Each scenario is derived from academic research and assigned a confidence score based on signal strength and alignment.
Notation:
• Zp = Price Z-Score
• Zv = Total Volume Z-Score
• Zbuy = Buy Volume Z-Score
• Zsell = Sell Volume Z-Score
• ZΔ = Delta Z-Score
• dirP = Price direction (+1 if Zp > 0.5, -1 if Zp < -0.5, else 0)
• = Previous bar value
• ZH = 2.0 (High threshold)
• ZM = 1.0 (Medium threshold)
• Z0 = 0.5 (Zero threshold)
─────────────────────────────────────────────────────────────
CATEGORY A: PRICE-VOLUME (Events 1-10)
Based on: Karpoff (1987), Tauchen-Pitts (1983), Clark (1973)
─────────────────────────────────────────────────────────────
Event 1: Breakout Confirmed
|Zp| ≥ ZH AND Zv ≥ ZH AND sign(ZΔ) = dirP AND dirP ≠ 0
Direction: Bullish/Bearish (follows price direction)
Event 2: Trend Strength Confirmed
|Zp| ≥ ZH AND Zv ≥ ZH
Direction: Follows price direction
Event 3: Fragile Move
|Zp| ≥ ZH AND Zv ≤ -ZM
Direction: Warning (price move without volume support)
Event 4: Weak Rally
Zp ≥ ZH AND Zv ≤ -ZH
Direction: Warning (price up without volume)
Event 5: Weak Selloff
Zp ≤ -ZH AND Zv ≤ -ZH
Direction: Warning (price down without volume)
Event 6: Momentum Build
ZM ≤ |Zp| < ZH AND Zv ≥ ZH
Direction: Follows price direction
Event 7: Churn
|Zp| ≤ Z0 AND Zv ≥ ZH
Direction: Neutral (high volume, low price movement)
Event 8: Quiet Compression
|Zp| ≤ Z0 AND Zv ≤ -ZH
Direction: Neutral (low volume, low price movement)
Event 9: High Volume Regime
Zv ≥ ZH
Direction: Neutral
Event 10: Low Volume Regime
Zv ≤ -ZH
Direction: Neutral
─────────────────────────────────────────────────────────────
CATEGORY B: ORDER-FLOW / DELTA (Events 11-16)
Based on: Cont, Kukanov, Stoikov (2014), Easley, Kiefer, O'Hara, Paperman (1996)
─────────────────────────────────────────────────────────────
Event 11: Imbalance Drives Price
|ZΔ| ≥ ZH AND sign(ZΔ) = dirP AND dirP ≠ 0
Direction: Follows price direction (dirP), with delta alignment required
Event 12: Divergence Top
Zp ≥ ZH AND ZΔ ≤ -ZH
Direction: Warning (distribution at top)
Event 13: Divergence Bottom
Zp ≤ -ZH AND ZΔ ≥ ZH
Direction: Warning (accumulation at bottom)
Event 14: Absorption Positive
|Zp| ≤ Z0 AND Zv ≥ ZH AND ZΔ ≥ ZH
Direction: Bullish (buy absorption, support forming)
Event 15: Absorption Negative
|Zp| ≤ Z0 AND Zv ≥ ZH AND ZΔ ≤ -ZH
Direction: Bearish (sell absorption, resistance forming)
Event 16: Depth Wall
Zv ≥ ZH AND |ZΔ| ≥ ZH AND |Zp| ≤ Z0
Direction: Neutral (market depth absorbing)
─────────────────────────────────────────────────────────────
CATEGORY C: BUY VS SELL (Events 17-23)
Based on: Easley, Kiefer, O'Hara, Paperman (1996), Chordia, Roll, Subrahmanyam (2002)
─────────────────────────────────────────────────────────────
Event 17: Aggressive Buy Dominance
Zbuy ≥ ZH AND ZΔ ≥ ZH AND Zsell ≤ -ZM
Direction: Bullish
Event 18: Aggressive Sell Dominance
Zsell ≥ ZH AND ZΔ ≤ -ZH AND Zbuy ≤ -ZM
Direction: Bearish
Event 19: Two-Sided Battle
Zbuy ≥ ZH AND Zsell ≥ ZH AND |ZΔ| ≤ Z0
Direction: Neutral (buyers and sellers equally strong)
Event 20: Battle with Buy Edge
Zbuy ≥ ZH AND Zsell ≥ ZH AND ZM ≤ ZΔ < ZH
Direction: Bullish
Event 21: Battle with Sell Edge
Zbuy ≥ ZH AND Zsell ≥ ZH AND -ZH < ZΔ ≤ -ZM
Direction: Bearish
Event 22: Hidden Accumulation
Zbuy ≥ ZH AND |Zp| ≤ Z0 AND Zv ≥ ZH
Direction: Bullish (buy shock without price movement)
Event 23: Hidden Distribution
Zsell ≥ ZH AND |Zp| ≤ Z0 AND Zv ≥ ZH
Direction: Bearish (sell shock without price movement)
─────────────────────────────────────────────────────────────
CATEGORY D: PREDICTABILITY (Events 24-26)
Based on: Gervais, Kaniel, Mingelgrin (2001), Karpoff (1987)
─────────────────────────────────────────────────────────────
Event 24: Volume Shock Positive Drift
Zv ≥ ZH AND |Zp| ≤ ZM
Direction: Follows price direction
Event 25: Volume Shock Negative Drift
Zv ≤ -ZH AND |Zp| ≤ ZM
Direction: Opposite to price direction
Event 26: Abnormal Volume Info Arrival
Zv ≥ ZH
Direction: Neutral
─────────────────────────────────────────────────────────────
CATEGORY E: REVERSAL VS CONTINUATION (Events 27-30)
Based on: Campbell, Grossman, Wang (MIT), Llorente, Michaely, Saar, Wang (2002)
─────────────────────────────────────────────────────────────
Event 27: High Vol Reversal Risk
Zv ≥ ZH
Direction: Warning (high volume implies lower positive autocorrelation)
Event 28: Low Vol Continuation Risk
Zv ≤ -ZH
Direction: Follows price direction (trend likely continues)
Event 29: Speculation Continuation
Zv ≥ ZH AND |ZΔ| ≥ ZM AND sign(ZΔ) = dirP AND dirP ≠ 0
Direction: Follows price direction
Event 30: Risk Sharing Reversal
Zv ≥ ZH AND |ZΔ| ≤ Z0
Direction: Warning (potential reversal)
─────────────────────────────────────────────────────────────
CATEGORY F: IMBALANCE LAG (Events 31-33)
Based on: Chordia, Roll, Subrahmanyam (2002)
─────────────────────────────────────────────────────────────
Event 31: Persistent Imbalance Push
|ZΔ| ≥ ZM AND |ZΔ | ≥ ZM AND sign(ZΔ) = sign(ZΔ )
Direction: Follows delta direction (persistent pressure)
Event 32: Imbalance Pressure Decay
(ZΔ ≥ ZM AND ZΔ ≤ -ZM) OR (ZΔ ≤ -ZM AND ZΔ ≥ ZM)
Direction: Warning (imbalance sign flip)
Event 33: Intraday Imbalance Predicts
|ZΔ| ≥ ZM
Direction: Follows delta direction
─────────────────────────────────────────────────────────────
CATEGORY G: SUPPORT/RESISTANCE (Events 34-36)
Based on: Peskir (Manchester)
─────────────────────────────────────────────────────────────
Event 34: SR Barrier Event
|Zp| ≤ Z0 AND Zv ≥ ZH
Direction: Neutral (price stalls with high volume)
Event 35: Volume Backed SR Level
|Zp| ≤ Z0 AND Zv ≥ ZH AND |ZΔ| ≥ ZM
Direction: Follows delta direction
Event 36: Volume Poor SR Level
|Zp| ≤ Z0 AND Zv ≤ -ZM
Direction: Warning (weak S/R without volume)
─────────────────────────────────────────────────────────────
CATEGORY H: EXTENDED ANALYSIS (Events 37-50)
Based on: Extended market microstructure analysis
─────────────────────────────────────────────────────────────
Event 37: Climax Buy
Zbuy ≥ ZH AND Zp ≥ ZH AND Zv ≥ ZH
Direction: Warning (extreme buying exhaustion, potential top)
Event 38: Climax Sell
Zsell ≥ ZH AND Zp ≤ -ZH AND Zv ≥ ZH
Direction: Warning (extreme selling exhaustion, potential bottom)
Event 39: Stealth Accumulation
Zbuy ≥ ZM AND |Zp| ≤ Z0 AND Zv ≤ Z0
Direction: Bullish (quiet buying)
Event 40: Stealth Distribution
Zsell ≥ ZM AND |Zp| ≤ Z0 AND Zv ≤ Z0
Direction: Bearish (quiet selling)
Event 41: Volume Divergence Bull
Zp ≤ -ZM AND Zv ≤ -ZM
Direction: Bullish (price down but volume declining)
Event 42: Volume Divergence Bear
Zp ≥ ZM AND Zv ≤ -ZM
Direction: Bearish (price up but volume declining)
Event 43: Delta Price Alignment
|Zp| ≥ ZM AND |ZΔ| ≥ ZM AND sign(Zp) = sign(ZΔ)
Direction: Follows price direction (strong trend confirmation)
Event 44: Extreme Compression
|Zp| ≤ Z0 AND Zv ≤ -ZH
Direction: Neutral (very low volatility)
Event 45: Volatility Expansion
|Zp| ≥ ZH AND Zv ≥ ZH
Direction: Follows price direction (breakout from compression)
Event 46: Buy Exhaustion
Zbuy ≥ ZH AND Zp ≤ Z0
Direction: Warning (high buy but price fails)
Event 47: Sell Exhaustion
Zsell ≥ ZH AND Zp ≥ -Z0
Direction: Warning (high sell but price holds)
Event 48: Trend Acceleration
|Zp| ≥ ZM AND |Zp| > |Zp | AND Zv ≥ ZM
Direction: Follows price direction (increasing momentum)
Event 49: Trend Deceleration
|Zp| ≥ ZM AND |Zp| < |Zp | AND sign(Zp) = sign(Zp )
Direction: Warning (decreasing momentum)
Event 50: Multi Divergence
(Zp ≥ ZM AND ZΔ ≤ -ZM) OR (Zp ≤ -ZM AND ZΔ ≥ ZM) + |Zp| ≥ ZM AND Zv ≤ -ZM
Direction: Warning (multiple divergence signals)
─────────────────────────────────────────────────────────────
CATEGORY I: TREND-INTEGRATED (Events 51-60)
Based on: Combined price-volume-delta trend analysis
─────────────────────────────────────────────────────────────
Event 51: Trend Breakout Confirmed
|Zp| ≥ ZH AND Zv ≥ ZH AND |ZΔ| ≥ ZM AND sign(ZΔ) = dirP AND dirP ≠ 0
Direction: Follows price direction
Event 52: Trend Support Test
Zp ≥ ZM AND Z0 ≤ Zp < ZM AND ZΔ ≥ Z0
Direction: Bullish (pullback in uptrend)
Event 53: Trend Resistance Test
Zp ≤ -ZM AND -ZM < Zp ≤ -Z0 AND ZΔ ≤ -Z0
Direction: Bearish (rally in downtrend)
Event 54: Trend Reversal Signal
sign(Zp) ≠ sign(Zp ) AND |Zp| ≥ ZM AND |Zp | ≥ ZM
Direction: Follows new price direction (momentum flip)
Event 55: Channel Absorption
|Zp| ≤ Z0 AND Zv ≥ ZH
Direction: Neutral (range-bound with volume)
Event 56: Trend Continuation Volume
|Zp| ≥ ZM AND Zv ≥ ZM AND sign(ZΔ) = dirP AND dirP ≠ 0
Direction: Follows price direction (healthy trend with volume)
Event 57: Trend Exhaustion
|Zp| ≥ ZM AND Zv ≤ -ZM AND |Zp| < |Zp |
Direction: Warning (trend losing steam)
Event 58: Range Breakout Pending
|Zp| ≤ Z0 AND Zv ≤ -ZH AND |ZΔ| ≥ ZM
Direction: Follows delta direction (compression with imbalance)
Event 59: Trend Quality High
|Zp| ≥ ZM AND sign(ZΔ) = dirP AND Zv ≥ Z0 AND dirP ≠ 0
Direction: Follows price direction (strong aligned signals)
Event 60: Trend Quality Low
|Zp| ≥ ZM AND sign(ZΔ) ≠ dirP AND dirP ≠ 0
Direction: Warning (conflicting signals)
━━━━━━━━━━━━━━━━━━━━━━━━━━━━━━━━━━━━━━━━━━━
TREND CHANNEL SYSTEM
The trend channel system is adapted from Smart Trader Episode 03 to provide consistent visual context for price action analysis.
How It Works:
• Divides the chart into blocks based on Z-Score groups
• Calculates OHLC (Open, High, Low, Close) for each block
• Detects Higher Highs/Higher Lows (uptrend) or Lower Highs/Lower Lows (downtrend) patterns
• Draws channel lines connecting block extremes
• Classifies by angle: steep angles indicate trends, flat angles indicate ranges
Channel Classifications:
• UPTREND: Higher highs and higher lows detected
• DOWNTREND: Lower highs and lower lows detected
• RANGE: Channel angle below threshold (default 10 degrees)
Label Information:
• Trend direction (UPTREND/DOWNTREND/RANGE)
• Channel boundary prices
• Distance from current price (absolute and percentage)
• Channel angle in degrees
━━━━━━━━━━━━━━━━━━━━━━━━━━━━━━━━━━━━━━━━━━━
DASHBOARD
The dashboard provides a comprehensive real-time view of all Z-Score metrics and detected events.
Dashboard Sections:
1. Header Row
Displays indicator name and current calculation mode (CLOSED or LIVE).
2. Metric Rows (Price, Total Volume, Buy Volume, Sell Volume, Delta)
Each row displays:
• Value: Current metric value
• Z: Calculated Z-Score
• Visual: Graphical Z-bar showing position relative to mean
• Status: Interpretation (Extreme High, Above Avg, Normal, Below Avg, Extreme Low)
• Upper: Oldest active upper Z-Line in window (Label Mirror)
• Lower: Oldest active lower Z-Line in window (Label Mirror)
3. Event Detection Section
• Count of triggered events out of 60 total scenarios
• Market Bias: Bull/Bear/Neutral percentage with visual bar
• Strongest Event: Highest confidence event currently triggered
• #2 Event: Second highest confidence event
4. Footer
Shows engine type (Geometry/Intrabar), Z-Score period, calculation basis, and number of valid bars.
━━━━━━━━━━━━━━━━━━━━━━━━━━━━━━━━━━━━━━━━━━━
ALERT SYSTEM
The indicator uses native alertcondition() functions, keeping the settings menu clean while providing comprehensive alert options in TradingView's alert dialog.
Available Alert Categories:
• Master Alerts: Any event, Any bullish, Any bearish, Any warning
• Single Event Alerts: Individual alerts for key events (Breakout, Climax, Divergence, etc.)
• Category Alerts: Alerts by event category (Price-Volume, Order-Flow, etc.)
• Confluence Alerts: 2+, 3+, 4+, or 5+ aligned events
• Bias Shift Alerts: 10%, 20%, or 30% shifts in market bias
• High Confidence Alerts: Events with 60%+, 70%+, 80%+, or 90%+ confidence
• Divergence Alerts: Price vs Volume or Price vs Delta divergences
━━━━━━━━━━━━━━━━━━━━━━━━━━━━━━━━━━━━━━━━━━━
DATA ACCURACY AND LIMITATIONS
This indicator is 100% VOLUME-BASED and requires Lower Timeframe (LTF) intrabar data for accurate calculations when using the Intrabar method.
Data Accuracy Levels:
• 1T (Tick): Most accurate, real volume distribution per tick
• 1S (1 Second): Reasonably accurate approximation
• 15S (15 Seconds): Good approximation, longer historical data available
• 1M (1 Minute): Rough approximation, maximum historical data range
Backtest and Replay Limitations:
• Replay mode results may differ from live trading due to data availability
• For longer backtest periods, use higher LTF settings (15S or 1M)
• Not all symbols/exchanges support tick-level data
• Crypto and Forex typically have better LTF data availability than stocks
A Note on Data Access:
Higher TradingView plans provide access to more historical intrabar data, which directly impacts the accuracy of volume-based calculations. More precise volume data leads to more reliable calculations.
━━━━━━━━━━━━━━━━━━━━━━━━━━━━━━━━━━━━━━━━━━━
LANGUAGE SUPPORT (TRI-LINGUAL UI)
This indicator includes a built-in language switch with three interface languages :
• English (EN)
• Türkçe (TR)
• 한국어 (KO)
The selected language updates key interface text such as the Dashboard headers/rows , tooltips , and the Event Engine outputs (event names, category names, and direction labels). Turkish diacritics and Korean Hangul are supported for clean, native readability.
Why only three languages?
Each additional language requires duplicating strings throughout the code, which increases script size/memory usage and compilation time. To keep the indicator optimized and responsive, language options are intentionally limited to three.
━━━━━━━━━━━━━━━━━━━━━━━━━━━━━━━━━━━━━━━━━━━
⚠️ DISCLAIMER
FOR EDUCATIONAL AND RESEARCH PURPOSES ONLY
This indicator is designed as an educational and research tool based on academic market microstructure literature. It is NOT financial advice and should NOT be used as the sole basis for trading decisions.
Important Notices:
• Past performance does not guarantee future results
• All trading involves risk of substantial loss
• The indicator's signals are statistical probabilities, not certainties
• Always conduct your own research and consult qualified financial advisors
• The creator assumes no responsibility for trading losses
Research Sources:
This indicator is built upon peer-reviewed academic research from:
• Journal of Financial and Quantitative Analysis (Cambridge University Press)
• Journal of Finance
• Journal of Financial Econometrics
• MIT Working Papers
• arXiv Financial Mathematics
Zscoreindicator

ZScore SemiConductoresZ-Score of Semiconductor Sector Volume
This custom Pine Script indicator applies a Z-Score calculation to the aggregated trading volume of leading semiconductor companies. The goal is to highlight statistical extremes in sector activity that may signal unusual market behavior.
🔧 How it works
- Fixed ticker list: NVDA, AVGO, TSM, AMD, ASML, MU, ARM, ON, TXN, QCOM, INTC.
- Aggregate volume: The script sums the trading volume of all tickers in the list for the selected timeframe.
- Z-Score calculation:
- Moving average and standard deviation are computed over a configurable window (default = 50 bars).
- Formula:
Z= (Current Volume - Mean) / Standard Deviation
Visualization:
- Z-Score plotted in green.
- Reference lines at 0, ±1σ, ±2σ.
- Labels (triangles) mark critical signals when Z > +2 or Z < -2.
📈 Why it matters
- Detects abnormal surges or drops in sector-wide volume.
- Highlights potential euphoria (+2σ) or panic (-2σ) moments.
- Useful as a filter for trading strategies or as a sector-level alert system.
⚠️ Disclaimer: This script is for educational purposes only and not financial advice

Institutional Quantum Momentum Impulse [BullByte]## Overview
The Institutional Quantum Momentum Impulse (IQMI) is a sophisticated momentum oscillator designed to detect institutional-level trend strength, volatility conditions, and market regime shifts. It combines multiple advanced technical concepts, including:
- Quantum Momentum Engine (Hilbert Transform + MACD Divergence + Stochastic Energy)
- Fractal Volatility Scoring (GARCH + Keltner-based volatility)
- Dynamic Adaptive Bands (Self-adjusting thresholds based on efficiency)
- Market Phase Detection (Volume + Momentum alignment)
- Liquidity & Cumulative Delta Analysis
The indicator provides a Z-score normalized momentum reading, making it ideal for mean-reversion and trend-following strategies.
---
## Key Features
### 1. Quantum Momentum Core
- Combines Hilbert Transform, MACD divergence, and Stochastic Energy into a single composite momentum score.
- Normalized using a Z-score for statistical significance.
- Smoothed with EMA/WMA/HMA for cleaner signals.
### 2. Dynamic Adaptive Bands
- Upper/Lower bands adjust based on volatility and efficiency ratio .
- Acts as overbought/oversold zones when momentum reaches extremes.
### 3. Market Phase Detection
- Identifies bullish , bearish , or neutral phases using:
- Volume-Weighted MA alignment
- Fractal momentum extremes
### 4. Volatility & Liquidity Filters
- Fractal Volatility Score (0-100 scale) shows market instability.
- Liquidity Check ensures trades are taken in favorable spread conditions.
### 5. Dashboard & Visuals
- Real-time dashboard with key metrics:
- Momentum strength, volatility, efficiency, cumulative delta, and market regime.
- Gradient coloring for intuitive momentum visualization .
---
## Best Trade Setups
### 1. Trend-Following Entries
- Signal :
- QM crosses above zero + Market Phase = Bullish + ADX > 25
- Cumulative Delta rising (buying pressure)
- Confirmation :
- Efficiency > 0.5 (strong momentum quality)
- Liquidity = High (tight spreads)
### 2. Mean-Reversion Entries
- Signal :
- QM touches upper band + Volatility expanding
- Market Regime = Ranging (ADX < 25)
- Confirmation :
- Efficiency < 0.3 (weak momentum follow-through)
- Cumulative Delta divergence (price high but delta declining)
### 3. Breakout Confirmation
- Signal :
- QM holds above zero after a pullback
- Market Phase shifts to Bullish/Bearish
- Confirmation :
- Volatility rising (expansion phase)
- Liquidity remains high
---
## Recommended Timeframes
- Intraday (5M - 1H): Works well for scalping & swing trades.
- Swing Trading (4H - Daily): Best for trend-following setups.
- Position Trading (Weekly+): Useful for macro trend confirmation.
---
## Input Customization
- Resonance Factor (1.0 - 3.618 ): Adjusts MACD divergence sensitivity.
- Entropy Filter (0.382/0.50/0.618) : Controls stochastic damping.
- Smoothing Type (EMA/WMA/HMA) : Changes momentum responsiveness.
- Normalization Period : Adjusts Z-score lookback.
---
The IQMI is a professional-grade momentum indicator that combines institutional-level concepts into a single, easy-to-read oscillator. It works across all markets (stocks, forex, crypto) and is ideal for traders who want:
✅ Early trend detection
✅ Volatility-adjusted signals
✅ Institutional liquidity insights
✅ Clear dashboard for quick analysis
Try it on TradingView and enhance your trading edge! 🚀
Happy Trading!
- BullByte

Enhanced Price Z-Score OscillatorThe Enhanced Price Z-Score Oscillator by tkarolak is a powerful tool that transforms raw price data into an easy-to-understand statistical visualization using Z-Score-derived candlesticks. Simply put, it shows how far prices stray from their average in terms of standard deviations (Z-Scores), helping traders identify when prices are unusually high (overbought) or unusually low (oversold).
The indicator’s default feature displays Z-Score Candlesticks, where each candle reflects the statistical “distance” of the open, high, low, and close prices from their average. This creates a visual map of market extremes and potential reversal points. For added flexibility, you can also switch to Z-Score line plots based on either Close prices or OHLC4 averages.
With clear threshold lines (±2σ and ±3σ) marking moderate and extreme price deviations, and color-coded zones to highlight overbought and oversold areas, the oscillator simplifies complex statistical concepts into actionable trading insights.
Mean Reversion Watchlist [Z score]Hi Traders !
What is the Z score:
The Z score measures a values variability factor from the mean, this value is denoted by z and is interpreted as the number of standard deviations from the mean.
The Z score is often applied to the normal distribution to “standardize” the values; this makes comparison of normally distributed random variables with different units possible.
This popular reversal based indicator makes an assumption that the sample distribution (in this case the sample of price values) is normal, this allows for the interpretation that values with an extremely high or low percentile or “Z” value will likely be reversal zones.
This is because in the population data (the true distribution) which is known, anomaly values are very rare, therefore if price were to take a z score factor of 3 this would mean that price lies 3 standard deviations from the mean in the positive direction and is in the ≈99% percentile of all values. We would take this as a sign of a negative reversal as it is very unlikely to observe a consecutive equal to or more extreme than this percentile or Z value.
The z score normalization equation is given by
In Pine Script the Z score can be computed very easily using the below code.
// Z score custom function
Zscore(source, lookback) =>
sma = ta.sma(source, lookback)
stdev = ta.stdev(source, lookback, true)
zscore = (source - sma) / stdev
zscore
The Indicator:
This indicator plots the Z score for up to 20 different assets ( Note the maximum is 40 however the utility of 40 plots in one indicator is not much, there is a diminishing marginal return of the number of plots ).
Z score threshold levels can also be specified, the interpretation is the same as stated above.
The timeframe can also be fixed, by toggling the “Time frame lock” user input under the “TIME FRAME LOCK” user input group ( Note this indicator does not repain t).

Z Score CANDLE and Exciting candle signal [DJ D]This script paints candles when their zscore reaches above 2 standard deviations in price from the mean. The blue candle represents up candle above 2. Magenta candle below -2. The candles can signal the beginning of a move and also importantly exhaustion.
The script also signals when a candle has volatility above 6. The higher the sensitivity the less frequent it will paint. These are real time paints and signals. You can adjust for higher time frames by adjusting the length of the z score and adjust the sensitivity of the volatility candles.
The yellow candle is a mean candle and can signify consolidation and/or indecision. Drawing a Darvis type box around around mean candles can give you a zone to watch.
These settings are for 1 minute scalping. The volatility sensitivity range between 1- 2 is good for 15, 30, (ie 1.0 or 1.2) and your discretion....
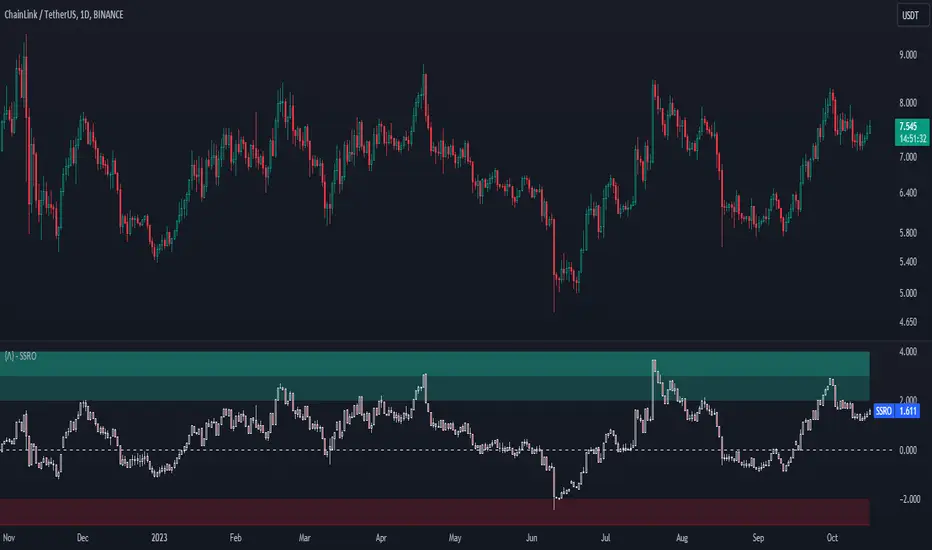
Stablecoin Supply Ratio Oscillator
The Stablecoin Supply Ratio Oscillator (SSRO) is a cryptocurrency indicator designed for mean reversion analysis and sentiment assessment. It calculates the ratio of CRYPTO:BTCUSD 's market capitalization to the sum of stablecoins' market capitalization and z-scores the result, offering insights into market sentiment and potential turning points.
Methodology:
The SSRO is calculated as follows-
method ssro(float src, array stblsrc, int len) =>
float ssr = src / stblsrc.sum() // Source of the underlying divided by the sum of stablecoin sources
(ssr - ta.sma(ssr, len)) / ta.stdev(ssr, len) // Z-Score Transformed
This ratio is Z-Scored to provide a standardized measure, allowing users to identify periods of market fear or greed based on the allocation of capital between the underlying and Stablecoins ( CRYPTOCAP:USDT , CRYPTOCAP:USDC , CRYPTO:TUSD , CRYPTOCAP:BUSD , CRYPTOCAP:DAI , CRYPTOCAP:USDD , CRYPTOCAP:FRAX ). The z-scored values indicate potential areas of discount (buying opportunities) or premium (selling opportunities) relative to historical patterns.
Customization:
Underlying Asset: SSRO is customizable to different underlying assets, offering a versatile tool for various cryptocurrencies.
Calculation Length: Users can adjust the length of the calculation, tailoring the indicator to short or long-term analysis.
Visualization: SSRO can be displayed as candles, providing a visual representation of premium and discount areas.
Interpretation:
Market Sentiment: Lower SSRO values may indicate market fear, suggesting a preference for stablecoins as a relatively safer haven for capital. Conversely, higher values may suggest market greed, as more capital is allocated to the underlying asset.
Utility and Use Cases:
1. Mean Reversion Analysis: SSRO identifies potential mean reversion opportunities, guiding traders on optimal entry and exit points.
2. Sentiment Analysis: The indicator provides insights into market sentiment, aiding traders in understanding market dynamics.
3. Macro Analysis: The majority of cryptos follow \ correlate to CRYPTO:BTCUSD , Therefore by assessing premium and discount areas of CRYPTO:BTCUSD relative to the chosen underlying asset, users gain insights into potential market tops and bottoms.
4. Divergence Analysis: SSRO divergence from price trends can signal potential reversals, providing traders with additional confirmation for their decisions.
The Stablecoin Supply Ratio Oscillator is a valuable tool for cryptocurrency traders, offering a nuanced perspective on market sentiment and mean reversion opportunities. Its customization options and visual representation make it a versatile and powerful addition to the crypto analyst's toolkit.
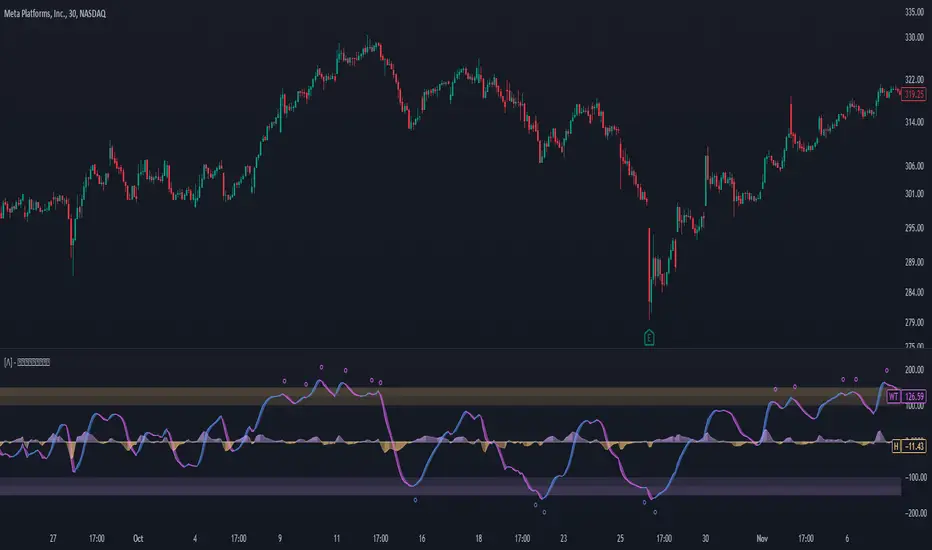
Enhanced WaveTrend OscillatorThe Enhanced WaveTrend Oscillator is a modified version of the original WaveTrend. The WaveTrend indicator is a popular technical analysis tool used to identify overbought and oversold conditions in the market and generate trading signals. The enhanced version addresses certain limitations of the original indicator and introduces additional features for improved analysis and comparison across assets.
WaveTrend:
The original WaveTrend indicator calculates two lines based on exponential moving averages and their relationship to the asset's price. The first line measures the distance between the asset's price and its EMA, while the second line smooths the first line over a specific period. The result is divided by 0.015 multiplied by the smoothed difference ('d' for reference). The indicator aims to identify overbought and oversold conditions by analyzing the relationship between the two lines.
In the original formula, the rudimentary estimation factor 0.015 times 'd' fails to accomodate for approximately a quarter of the data, preventing the indicator from reaching the traditional stationary levels of +-100. This limitation renders the indicator quantitatively biased, as it relies on the user's subjective adjustment of the levels. The enhanced version replaces this factor with the standard deviation of the asset's price, resulting in improved estimation accuracy and provides a more dynamic and robust outcome, we thereafter multiply the result by 100 to achieve a more traditional oscillation.
Enhancements and Features:
The enhanced version of the WaveTrend indicator addresses several limitations of the original indicator and introduces additional features-
Dynamic Estimation: The original indicator uses an arbitrary estimation factor, while the enhanced version replaces it with the standard deviation of the asset's price. This modification provides a more dynamic and accurate estimation, adapting to the specific price characteristics of each asset.
Stationary Support and Resistance Levels: The enhanced version provides stationary key support and resistance levels that range from -150 to 150. These levels are determined based on the analysis of the indicator's data and encompass more than 95% of the indicator's values. These levels offer important reference points for traders to identify potential price reversals or significant price movements.
Comparison Across Assets: The enhanced version allows for better comparison and analysis across different assets. By incorporating the standard deviation of the asset's price, the indicator provides a more consistent and comparable interpretation of the market conditions across multiple assets.
Upon closer inspection of the modification in the enhanced version, we can observe that the resulting indicator is a smoothed variation of the Z-Score!
f_ewave(src, chlen, avglen) =>
basis = ta.ema(src, chlen)
dev = ta.stdev(src, chlen)
wave = (src - basis) / dev * 100
ta.ema(wave, avglen)
Z-Score Analysis:
The Z-Score is a statistical measurement that quantifies how far a particular data point deviates from the mean in terms of standard deviations. In the enhanced version, the calculation involves determining the basis (mean) and deviation (standard deviation) of the asset's price to calculate its Z-Score, thereafter applying a smoothing technique to generate the final WaveTrend value.
Utility:
The 𝗘𝗻𝗵𝗮𝗻𝗰𝗲𝗱 𝗪𝗧 indicator offers traders and investors valuable insights into overbought and oversold conditions in the market. By analyzing the indicator's values and referencing the stationary support and resistance levels, traders can identify potential trend reversals, evaluate market strength, and make better informed analysis.
It is important to note that this indicator should be used in conjunction with other technical analysis tools and indicators to confirm trading signals and validate market dynamics.
Credit:
The 𝗘𝗻𝗵𝗮𝗻𝗰𝗲𝗱 𝗪𝗧 indicator is a modification of the original WaveTrend Oscillator developed by @LazyBear on TradingView.
Example Charts:
Z-Score Heikin-Ashi TransformedThe Z-Score Heikin-Ashi Transformed (𝘡 𝘏-𝘈) indicator is a powerful technical tool that combines the principles of Z-Score and Heikin Ashi to provide traders with a smoothed representation of price movements and a standardized measure of market volatility.
The 𝘡 𝘏-𝘈 indicator applies the Z-Score calculation to price data and then transforms the resulting Z-Scores using the Heikin Ashi technique. Understanding the individual components of Z-Score and Heikin Ashi will provide a foundation for comprehending the methodology and unique features of this indicator.
Z-Score:
Z-Score is a statistical measure that quantifies the distance between a data point and the mean, relative to the standard deviation. It provides a standardized value that allows traders to compare different data points on a common scale. In the context of the 𝘡 𝘏-𝘈 indicator, Z-Score is calculated based on price data, enabling the identification of extreme price movements and the assessment of their significance.
Heikin Ashi:
Heikin Ashi is a popular charting technique that aims to filter out market noise and provide a smoother representation of price trends. It involves calculating each candlestick based on the average of the previous candle's open, close, high, and low prices. This approach results in a chart that reduces the impact of short-term price fluctuations and reveals the underlying trend more clearly.
Methodology:
The 𝘡 𝘏-𝘈 indicator starts by calculating the Z-Score of the price data, which provides a standardized measure of how far each price point deviates from the mean. Next, the resulting Z-Scores are transformed using the Heikin Ashi technique. Each Z-Score value is modified according to the Heikin Ashi formula, which incorporates the average of the previous Heikin Ashi candle's open and close prices. This transformation smooths out the Z-Score values and reduces the impact of short-term price fluctuations, providing a clearer view of market trends.
This tool enables traders to identify significant price movements and assess their relative strength compared to historical data. Positive transformed Z-Scores indicate that prices are above the average, suggesting potential overbought conditions, while negative transformed Z-Scores indicate prices below the average, suggesting potential oversold conditions. Traders can utilize this information to identify potential reversals, confirm trend strength, and generate trading signals.
Utility:
The indicator offers valuable insights into price volatility and trend analysis. By combining the standardized measure of Z-Score with the smoothing effect of Heikin Ashi, traders can make more informed trading decisions and improve their understanding of market dynamics. 𝘡 𝘏-𝘈 can be used in various trading strategies, including identifying overbought or oversold conditions, confirming trend reversals, and establishing entry and exit points.
Note that the 𝘡 𝘏-𝘈 should be used in conjunction with other technical indicators and analysis tools to validate signals and avoid false positives. Additionally, traders are encouraged to conduct thorough backtesting and experimentation with different parameter settings to optimize the effectiveness of the indicator for their specific trading approach.
Key Features:
Optional Reversion Doritos
Adjustable Reversion Threshold
2 Adjustable EMAs
Example Charts:
See Also:
On Balance Volume Heikin-Ashi Transformed