OPEN-SOURCE SCRIPT
Aggiornato Z-Score Heikin-Ashi Transformed
The Z-Score Heikin-Ashi Transformed (𝘡 𝘏-𝘈) indicator is a powerful technical tool that combines the principles of Z-Score and Heikin Ashi to provide traders with a smoothed representation of price movements and a standardized measure of market volatility.
The 𝘡 𝘏-𝘈 indicator applies the Z-Score calculation to price data and then transforms the resulting Z-Scores using the Heikin Ashi technique. Understanding the individual components of Z-Score and Heikin Ashi will provide a foundation for comprehending the methodology and unique features of this indicator.
Z-Score:
Z-Score is a statistical measure that quantifies the distance between a data point and the mean, relative to the standard deviation. It provides a standardized value that allows traders to compare different data points on a common scale. In the context of the 𝘡 𝘏-𝘈 indicator, Z-Score is calculated based on price data, enabling the identification of extreme price movements and the assessment of their significance.
Heikin Ashi:
Heikin Ashi is a popular charting technique that aims to filter out market noise and provide a smoother representation of price trends. It involves calculating each candlestick based on the average of the previous candle's open, close, high, and low prices. This approach results in a chart that reduces the impact of short-term price fluctuations and reveals the underlying trend more clearly.
Methodology:
The 𝘡 𝘏-𝘈 indicator starts by calculating the Z-Score of the price data, which provides a standardized measure of how far each price point deviates from the mean. Next, the resulting Z-Scores are transformed using the Heikin Ashi technique. Each Z-Score value is modified according to the Heikin Ashi formula, which incorporates the average of the previous Heikin Ashi candle's open and close prices. This transformation smooths out the Z-Score values and reduces the impact of short-term price fluctuations, providing a clearer view of market trends.
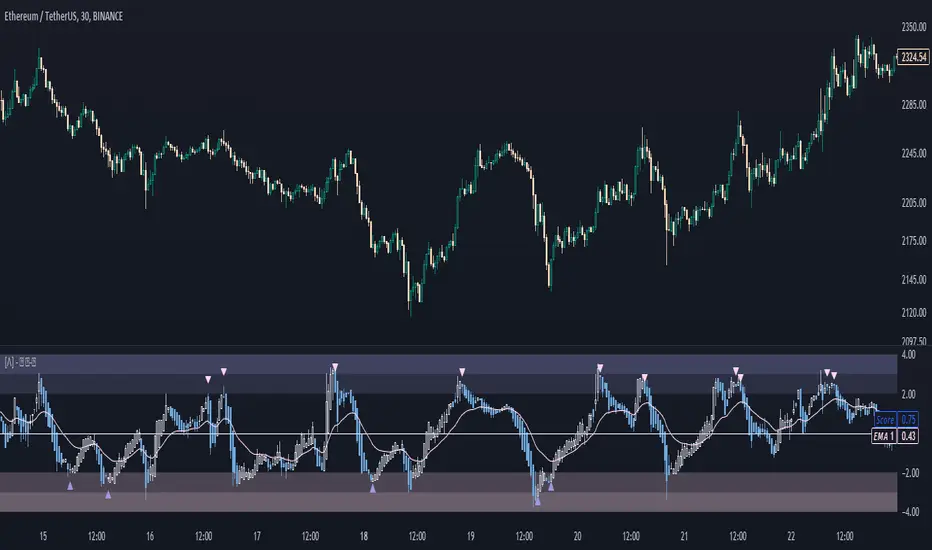
This tool enables traders to identify significant price movements and assess their relative strength compared to historical data. Positive transformed Z-Scores indicate that prices are above the average, suggesting potential overbought conditions, while negative transformed Z-Scores indicate prices below the average, suggesting potential oversold conditions. Traders can utilize this information to identify potential reversals, confirm trend strength, and generate trading signals.
Utility:
The indicator offers valuable insights into price volatility and trend analysis. By combining the standardized measure of Z-Score with the smoothing effect of Heikin Ashi, traders can make more informed trading decisions and improve their understanding of market dynamics. 𝘡 𝘏-𝘈 can be used in various trading strategies, including identifying overbought or oversold conditions, confirming trend reversals, and establishing entry and exit points.
Note that the 𝘡 𝘏-𝘈 should be used in conjunction with other technical indicators and analysis tools to validate signals and avoid false positives. Additionally, traders are encouraged to conduct thorough backtesting and experimentation with different parameter settings to optimize the effectiveness of the indicator for their specific trading approach.
Key Features:
Example Charts:

See Also:
On Balance Volume Heikin-Ashi Transformed

The 𝘡 𝘏-𝘈 indicator applies the Z-Score calculation to price data and then transforms the resulting Z-Scores using the Heikin Ashi technique. Understanding the individual components of Z-Score and Heikin Ashi will provide a foundation for comprehending the methodology and unique features of this indicator.
Z-Score:
Z-Score is a statistical measure that quantifies the distance between a data point and the mean, relative to the standard deviation. It provides a standardized value that allows traders to compare different data points on a common scale. In the context of the 𝘡 𝘏-𝘈 indicator, Z-Score is calculated based on price data, enabling the identification of extreme price movements and the assessment of their significance.
Heikin Ashi:
Heikin Ashi is a popular charting technique that aims to filter out market noise and provide a smoother representation of price trends. It involves calculating each candlestick based on the average of the previous candle's open, close, high, and low prices. This approach results in a chart that reduces the impact of short-term price fluctuations and reveals the underlying trend more clearly.
Methodology:
The 𝘡 𝘏-𝘈 indicator starts by calculating the Z-Score of the price data, which provides a standardized measure of how far each price point deviates from the mean. Next, the resulting Z-Scores are transformed using the Heikin Ashi technique. Each Z-Score value is modified according to the Heikin Ashi formula, which incorporates the average of the previous Heikin Ashi candle's open and close prices. This transformation smooths out the Z-Score values and reduces the impact of short-term price fluctuations, providing a clearer view of market trends.
This tool enables traders to identify significant price movements and assess their relative strength compared to historical data. Positive transformed Z-Scores indicate that prices are above the average, suggesting potential overbought conditions, while negative transformed Z-Scores indicate prices below the average, suggesting potential oversold conditions. Traders can utilize this information to identify potential reversals, confirm trend strength, and generate trading signals.
Utility:
The indicator offers valuable insights into price volatility and trend analysis. By combining the standardized measure of Z-Score with the smoothing effect of Heikin Ashi, traders can make more informed trading decisions and improve their understanding of market dynamics. 𝘡 𝘏-𝘈 can be used in various trading strategies, including identifying overbought or oversold conditions, confirming trend reversals, and establishing entry and exit points.
Note that the 𝘡 𝘏-𝘈 should be used in conjunction with other technical indicators and analysis tools to validate signals and avoid false positives. Additionally, traders are encouraged to conduct thorough backtesting and experimentation with different parameter settings to optimize the effectiveness of the indicator for their specific trading approach.
Key Features:
- Optional Reversion Doritos
- Adjustable Reversion Threshold
- 2 Adjustable EMAs
Example Charts:
See Also:
On Balance Volume Heikin-Ashi Transformed
Note di rilascio
Hollow Candles mode now adjustableNote di rilascio
Updated licenseNote di rilascio
Improved code methodology.Note di rilascio
improved methodology, added support for plot export to new SuperTrend ToolKitNote di rilascio
Added alerts.Note di rilascio
Added option for any alert call.Added option to change EMA and Reversal colors.
Script open-source
In pieno spirito TradingView, il creatore di questo script lo ha reso open-source, in modo che i trader possano esaminarlo e verificarne la funzionalità. Complimenti all'autore! Sebbene sia possibile utilizzarlo gratuitamente, ricorda che la ripubblicazione del codice è soggetta al nostro Regolamento.
Declinazione di responsabilità
Le informazioni ed i contenuti pubblicati non costituiscono in alcun modo una sollecitazione ad investire o ad operare nei mercati finanziari. Non sono inoltre fornite o supportate da TradingView. Maggiori dettagli nelle Condizioni d'uso.