Analisi: Performance delle posizioni
Visualizza le prestazioni degli asset del portafoglio sotto forma di grafico a barre interattivo. Consente una rapida valutazione degli asset che hanno registrato le dinamiche migliori e peggiori.
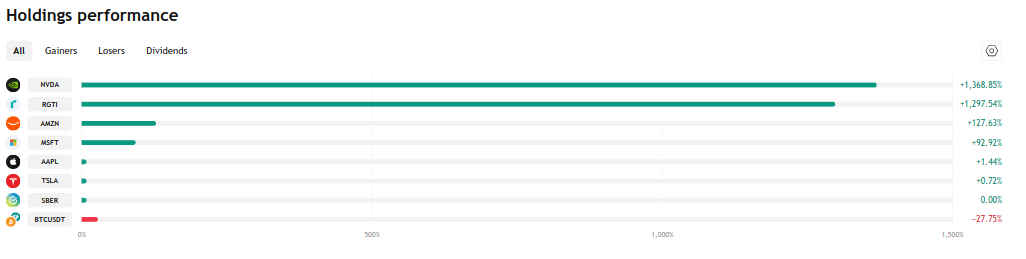
Modalità di visualizzazione:
- Tutto: vengono visualizzati tutti gli asset del portafoglio.
- Rialzi: solo gli asset con rendimenti positivi per l'intera durata del portafoglio.
- Ribassi: solo gli asset con rendimenti negativi per l'intera durata del portafoglio.
- Dividendi: solo asset che hanno generato reddito da dividendi durante l'intero ciclo di vita del portafoglio.
Il grafico a barre è ordinato in ordine decrescente di rendimento (in base alla modalità selezionata). Ogni riga rappresenta un singolo asset.
Controlli di visualizzazione:
- Visualizza venduti: opzione che abilita/disabilita la visualizzazione degli asset chiusi (venduti). Abilitata per impostazione predefinita.
- Valore: consente di passare dalla visualizzazione dei valori assoluti a quella dei valori relativi:
- Assoluto: valori assoluti di profitto/perdita (nella valuta del portafoglio).
- Percentuale: valori relativi (come percentuale dell'importo investito).
Passando il mouse su un asset, vengono visualizzati i parametri chiave:
- Guadagno totale %: profitto relativo sulla posizione rispetto all'importo investito.
- Guadagno totale: profitto totale sulla posizione nella valuta del portafoglio.
- Valore totale: valore attuale della posizione nella valuta del portafoglio (Valore).
Nota: Tutti i calcoli e i dati sono sincronizzati con la tabella della pagina Posizioni.