Come leggere i pattern grafici
I pattern grafici sono formazioni di prezzo che possono segnalare una potenziale inversione, una continuazione o un momento di incertezza in un trend, aiutando i trader a identificare i livelli di supporto e resistenza, i punti di ingresso e di uscita delle operazioni, o persino indicare che potrebbe essere una buona idea rimanere fuori dal mercato per un certo periodo di tempo fino a quando la situazione non si sarà chiarita.
In questo articolo tratteremo i concetti essenziali che riguardano i pattern grafici e gli strumenti che è possibile utilizzare per identificarli ed evidenziarli.
CONTENUTI:
- Cosa sono i pattern grafici
- Tipologie di pattern grafici
- Criteri di convalida dei pattern grafici
- Pattern grafici vs candele vs gap
- Strumenti di disegno dei pattern grafici
- Indicatori dei pattern grafici
Cosa sono i pattern grafici?
Le figure che si ripetono in modo visivamente simile sui grafici sono chiamate pattern. Hanno un aspetto distintivo e indicano che il prezzo potrebbe seguire un determinato andamento. Affinché un pattern possa essere confermato con maggiore probabilità, ovvero che il prezzo si sia mosso nella direzione suggerita, è necessario che sia supportato da segnali provenienti da altri strumenti tecnici.
I pattern grafici funzionano per diversi tipi di grafici. Grafici a linee e ad area; grafici a barre; candele vuote, di volume e standard: tutti hanno gli stessi pattern di prezzo e segnalano la stessa cosa.
Anche se si dividono tra pattern a candela e pattern grafici, hanno categorie e tipologie dalle carattiristiche simili, conoscerle potrà aiutare a orientarti meglio tra i mercati.
Tipologie di pattern grafici
I pattern costituiscono un campo di conoscenza completo nell'analisi tecnica. I pattern relativi a prezzo, candele e gap si dividono tutti in tre tipi principali.
Pattern di inversione: segnalano un potenziale cambiamento nella direzione del prezzo. Si verificano alla fine di un trend in corso, ma il problema è che non si sa mai quando il trend finirà.
Ad esempio, il doppio massimo è un forte pattern di inversione, il che significa che il prezzo non è stato in grado di superare un livello di resistenza consolidato.

Pattern di continuazione: indicano che il prezzo continuerà probabilmente a muoversi nella direzione precedente. Sono più frequenti durante le fasi di consolidamento.
Ad esempio, se si individua un pattern a triangolo, è probabile che il prezzo continui il suo andamento precedente.

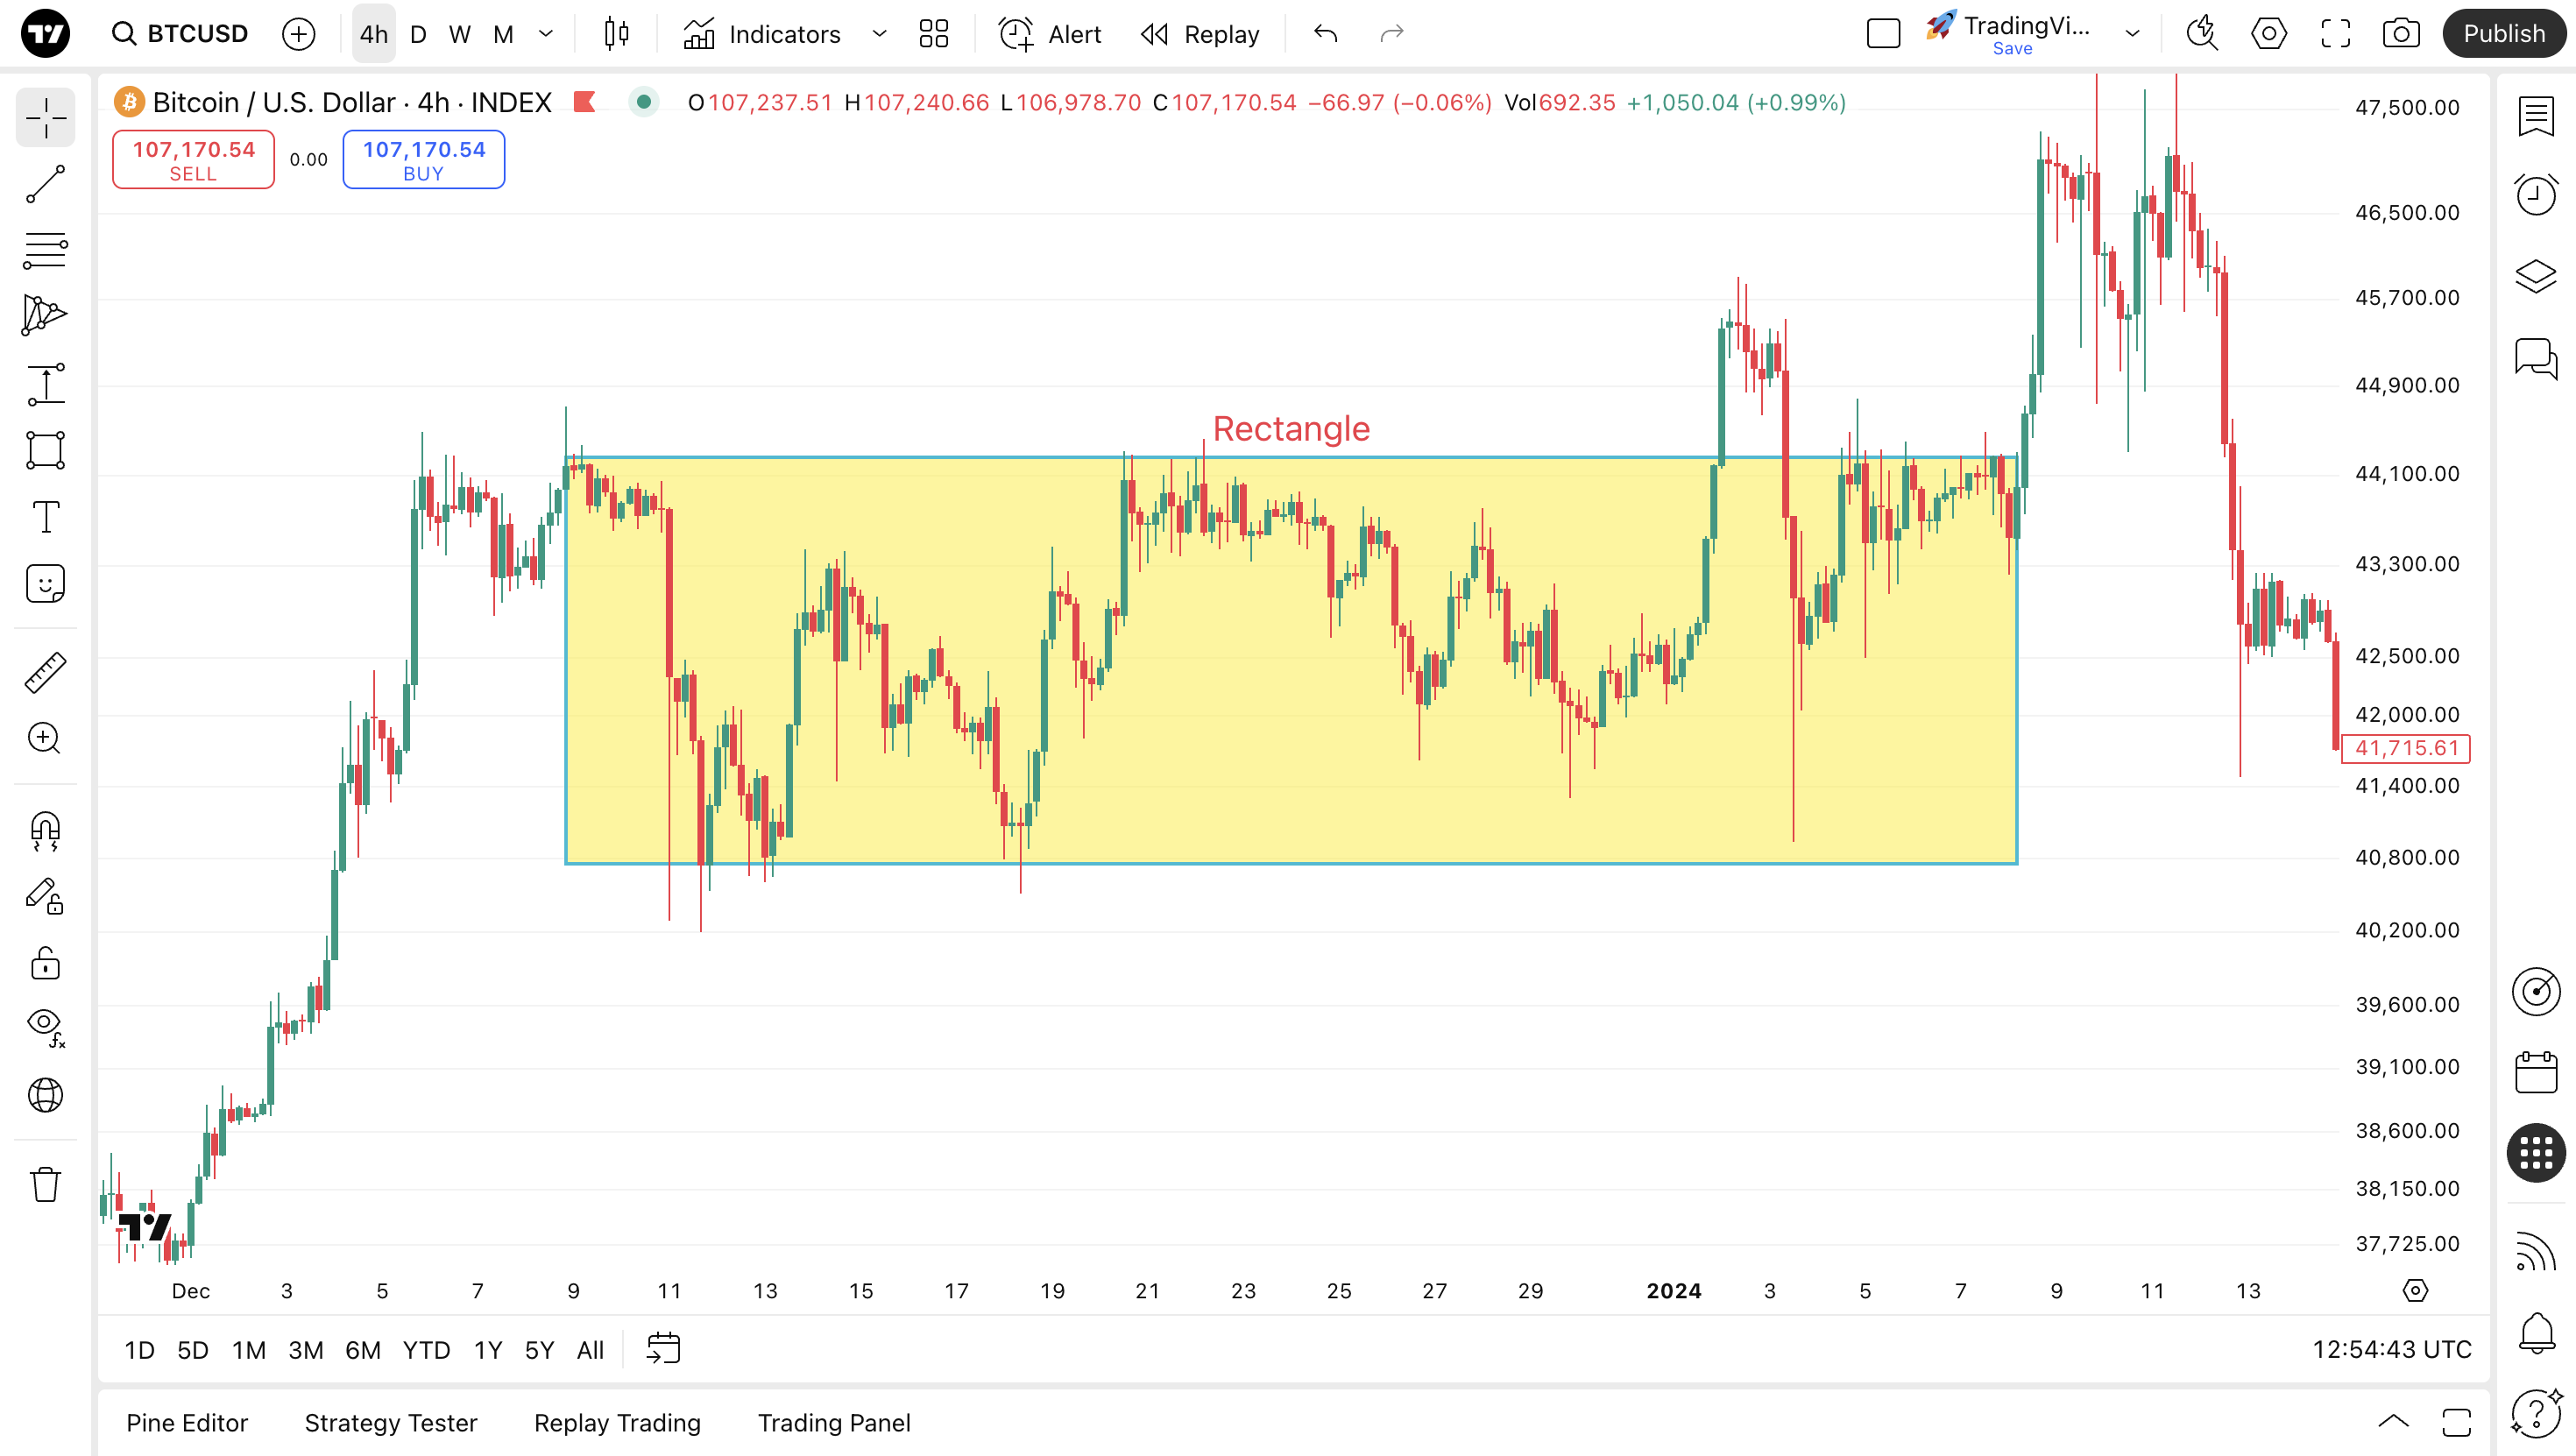
Pattern neutrali: il prezzo può continuare il suo movimento in entrambe le direzioni con probabilità uguali. Questi pattern hanno una maggiore probabilità di verificarsi durante le fasi di consolidamento.
Ad esempio, quando si individua un pattern rettangolare, la direzione futura del prezzo è incerta.
Criteri di convalida dei pattern grafici
I pattern di per sé hanno poco significato. Ogni trader interpreta i grafici a modo suo e può individuare pattern dove altri non se li aspetterebbero. Non tutto ciò che sembra un pattern lo è effettivamente.
I pattern non prevedono, ma suggeriscono. Non esiste nulla di accurato al 100% nell'analisi tecnica, poiché i mercati sono influenzati da molti fattori imprevedibili. Per ridurre al minimo l'incertezza, un pattern deve soddisfare alcune condizioni, ciascuna delle quali aumenta le possibilità che possa essere confermato.
Tuttavia, anche i pattern perfetti da manuale potrebbero non funzionare come previsto, a causa di molte ragioni che non possiamo prevedere e variabili che non siamo in grado di calcolare.
Nella tabella sottostante è possibile esaminare più da vicino i diversi criteri di convalida dei pattern, ciascuno dei quali è molto importante prima di prendere decisioni operative.
Pattern grafici vs candele vs gap
I pattern grafici sono il tipo di pattern più comune. Possono essere individuati su quasi tutti i tipi di grafici.
I pattern a candela funzionano solo con i grafici a candela.
I pattern gap sono unici in quanto funzionano meglio con gli asset negoziati su borse valori classiche come il Nasdaq o la Borsa di Bombay. Tali mercati hanno orari di negoziazione fissi, mentre i grafici vengono aggiornati in tempo reale.
Dopo la chiusura delle contrattazioni, la negoziazione pubblica si interrompe e i nuovi elementi del grafico appaiono solo all'apertura del mercato il giorno successivo o la settimana successiva. Dopo tali pause, si formano dei gap.

In questa tabella è possibile confrontare tutti i tipi di grafici disponibili su TradingView in termini di compatibilità con diversi tipi di pattern.

Strumenti per disegnare pattern grafici
Se individui un pattern grafico, potresti volerlo evidenziare per un'ulteriore analisi. Puoi farlo con i nostri strumenti di disegno situati nella barra degli strumenti a sinistra dei grafici.

Indicatori dei pattern grafici
Identificare i pattern è un processo che richiede tempo. È anche possibile accedere agli indicatori automatici che riconoscono i pattern sui grafici e aiutano nell'analisi di mercato.
È possibile trovarli nel menù a tendina “Indicatori” nella barra degli strumenti in alto. Quindi, andare su ‘Tecnici’ e cliccare su “Pattern”.
Informazioni più dettagliate su ciascun pattern e indicatore sono disponibili nelle nostre conoscenze di base.
Conclusioni
Un approccio comune quando si inizia ad analizzare i grafici è cercare i pattern. Questi possono fornire ulteriori informazioni sul prezzo dell'asset, sulla sua possibile inversione, continuazione o sul fatto che la sua direzione futura non sia chiara, ma nulla sui mercati è mai certo.
Di solito formano figure riconoscibili, che possono essere individuate su vari tipi di grafici disponibili su TradingView.
I pattern di per sé non garantiscono che il prezzo seguirà il percorso suggerito. Ti consigliamo di utilizzarli come complemento al tuo approccio analitico.
E' possibile evidenziare i pattern con gli strumenti di disegno. Inoltre, gli indicatori automatici possono farti risparmiare tempo mentre esegui la tua analisi di mercato.
Si consiglia di evitare di affidarsi esclusivamente ai pattern e di studiare invece altri strumenti di trading per ottenere una comprensione più ampia e chiara dei mercati finanziari.
Leggi anche: