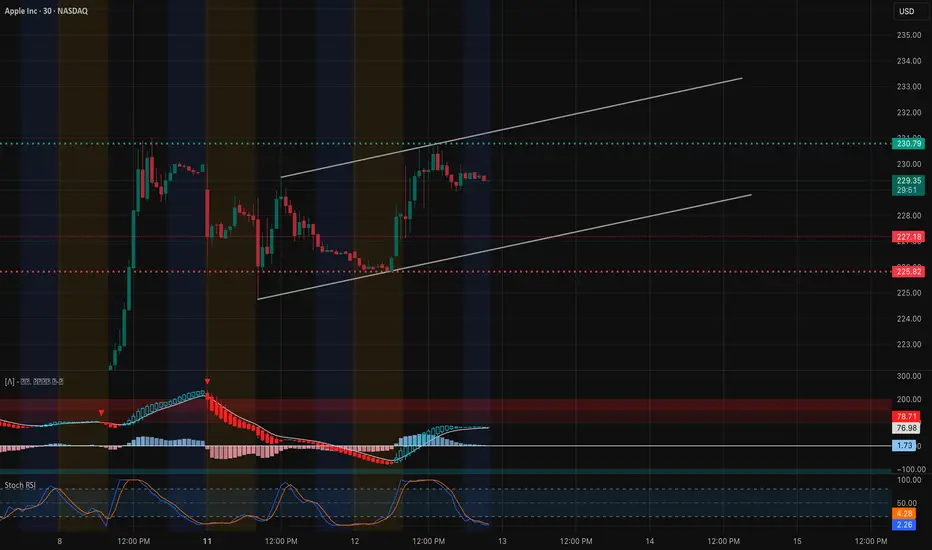
30-Minute Price Action
AAPL is trading inside a rising channel, showing steady higher lows but stalling under $230.79.
* Resistance: $230.79 – tested multiple times, acting as a lid.
* Support: $227.18 – intraday floor; $225.82 – lower channel & previous demand.
* Indicators:
* MACD momentum is still positive but flattening, signaling reduced buying pressure.
* Stoch RSI is near oversold levels, giving room for a potential bounce if support holds.
1-Hour GEX Insights

* Highest Positive NET GEX / Gamma Wall: $230.79 – aligns perfectly with 30m resistance, explaining repeated stalls.
* Next Call Walls Above: $233.5 & $237.5 – strong upside targets if $230.79 is broken.
* Put Support: $217.5 (1st defense), $210 (major downside GEX floor).
* IVR: 16.9 – relatively low implied volatility, making long options cheaper than usual.
TA + GEX Combined Read
The $230.79 level is critical — it’s both technical resistance on the 30m and the largest gamma wall on the 1h GEX chart.
* If AAPL breaks and holds above $230.79, gamma positioning could fuel a quick push to $233.5 and possibly $237.5.
* If rejected again, expect a pullback toward $227.18 and possibly $225.82, where technical support and the lower channel converge.
Trading Scenarios for August 13
* Bullish Breakout: Long calls or call spreads above $230.79 targeting $233.5 / $237.5.
* Bearish Rejection: Short-term puts or put spreads if $230.79 rejects and $227.18 breaks, targeting $225.82.
* Range Play: If stuck between $227–$231, credit spreads could work given low IVR.
Reasoning The 30m chart shows the rising channel structure, and the 1h GEX confirms why $230.79 is the decision point. A breakout can trigger hedging pressure to the upside; failure there points to a controlled drift back to lower channel support.
Disclaimer: This analysis is for educational purposes only and does not constitute financial advice. Always do your own research and manage risk appropriately before trading.
AAPL is trading inside a rising channel, showing steady higher lows but stalling under $230.79.
* Resistance: $230.79 – tested multiple times, acting as a lid.
* Support: $227.18 – intraday floor; $225.82 – lower channel & previous demand.
* Indicators:
* MACD momentum is still positive but flattening, signaling reduced buying pressure.
* Stoch RSI is near oversold levels, giving room for a potential bounce if support holds.
1-Hour GEX Insights
* Highest Positive NET GEX / Gamma Wall: $230.79 – aligns perfectly with 30m resistance, explaining repeated stalls.
* Next Call Walls Above: $233.5 & $237.5 – strong upside targets if $230.79 is broken.
* Put Support: $217.5 (1st defense), $210 (major downside GEX floor).
* IVR: 16.9 – relatively low implied volatility, making long options cheaper than usual.
TA + GEX Combined Read
The $230.79 level is critical — it’s both technical resistance on the 30m and the largest gamma wall on the 1h GEX chart.
* If AAPL breaks and holds above $230.79, gamma positioning could fuel a quick push to $233.5 and possibly $237.5.
* If rejected again, expect a pullback toward $227.18 and possibly $225.82, where technical support and the lower channel converge.
Trading Scenarios for August 13
* Bullish Breakout: Long calls or call spreads above $230.79 targeting $233.5 / $237.5.
* Bearish Rejection: Short-term puts or put spreads if $230.79 rejects and $227.18 breaks, targeting $225.82.
* Range Play: If stuck between $227–$231, credit spreads could work given low IVR.
Reasoning The 30m chart shows the rising channel structure, and the 1h GEX confirms why $230.79 is the decision point. A breakout can trigger hedging pressure to the upside; failure there points to a controlled drift back to lower channel support.
Disclaimer: This analysis is for educational purposes only and does not constitute financial advice. Always do your own research and manage risk appropriately before trading.
Declinazione di responsabilità
Le informazioni ed i contenuti pubblicati non costituiscono in alcun modo una sollecitazione ad investire o ad operare nei mercati finanziari. Non sono inoltre fornite o supportate da TradingView. Maggiori dettagli nelle Condizioni d'uso.
Declinazione di responsabilità
Le informazioni ed i contenuti pubblicati non costituiscono in alcun modo una sollecitazione ad investire o ad operare nei mercati finanziari. Non sono inoltre fornite o supportate da TradingView. Maggiori dettagli nelle Condizioni d'uso.