AAPL Elliott Wave Update: Wave 4 Triangle Nears Completion – $300+ Wave 5 Targets Ahead
AAPL continues its bullish trajectory in a classic 5-wave impulse structure, originating from the April 2025 low of $169.21 following an ABC correction from late 2024 highs. This rally has delivered over 70% gains, confirming a higher-degree Wave ((5)) within the multi-year uptrend.
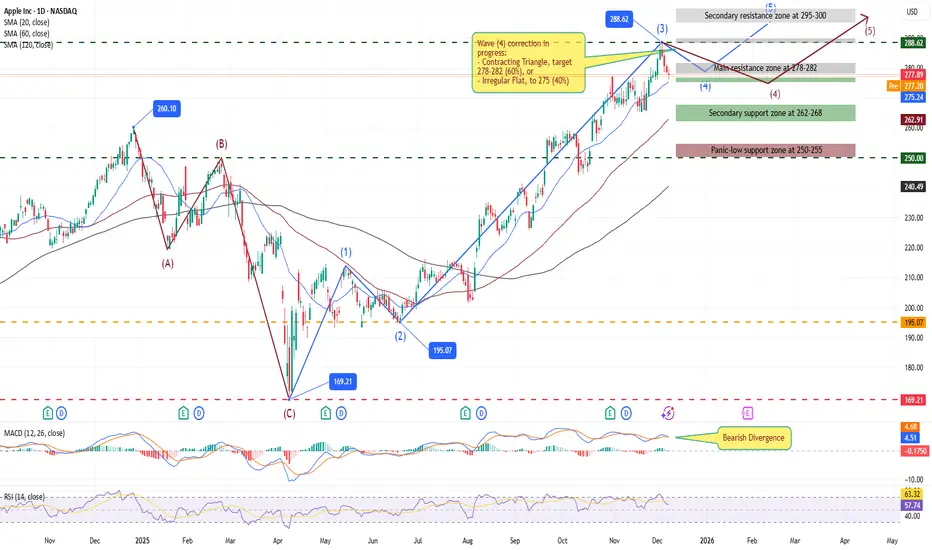
The impulse kicked off with Wave 1 surging to $213 (May high), followed by a shallow Wave 2 retracement to $195.07 (0.618 Fib), respecting the origin without overlap. Wave 3 then extended aggressively to $288.62 (December 3 high), measuring 1.618x Wave 1 and driving the strongest momentum since the blue-box low. Volume spiked during this extension, underscoring institutional buying.
We're now in Wave 4, a textbook sideways correction trading in the $276-282 range. Recent action suggests a Contracting Triangle (a-b-c-d-e pattern), with converging trendlines targeting a resolution near $277-282. Alternatively, an Irregular Flat could form if we probe $275 (0.382 Fib of Wave 3).
Bearish divergence on RSI (57.74) and MACD hints at waning momentum, but the 50-day SMA at $275.24 provides firm support. Critically, no overlap with Wave 1 high ($213) – a key invalidation level – keeps the structure intact.
Wave 5 targets align with Fib extensions: initial $290-293 (0.618 of Waves 1-3), standard $300-310 (1.0-1.618x). The parallel channel upper rail supports $305, fueled by AI tailwinds and upcoming Q1 earnings. Risk: Break below $270 channels a deeper pullback to $262, but VIX under 14 favors bulls.
Multi-month hold for longs above $275; add on triangle breakout with stops at $274. Structure remains bullish – Wave 5 could cap the year strong. What's your take?
Disclaimer: This analysis is for educational purposes only and is not investment advice. Please do your own research (DYOR) before making any trading decisions.
AAPL continues its bullish trajectory in a classic 5-wave impulse structure, originating from the April 2025 low of $169.21 following an ABC correction from late 2024 highs. This rally has delivered over 70% gains, confirming a higher-degree Wave ((5)) within the multi-year uptrend.
The impulse kicked off with Wave 1 surging to $213 (May high), followed by a shallow Wave 2 retracement to $195.07 (0.618 Fib), respecting the origin without overlap. Wave 3 then extended aggressively to $288.62 (December 3 high), measuring 1.618x Wave 1 and driving the strongest momentum since the blue-box low. Volume spiked during this extension, underscoring institutional buying.
We're now in Wave 4, a textbook sideways correction trading in the $276-282 range. Recent action suggests a Contracting Triangle (a-b-c-d-e pattern), with converging trendlines targeting a resolution near $277-282. Alternatively, an Irregular Flat could form if we probe $275 (0.382 Fib of Wave 3).
Bearish divergence on RSI (57.74) and MACD hints at waning momentum, but the 50-day SMA at $275.24 provides firm support. Critically, no overlap with Wave 1 high ($213) – a key invalidation level – keeps the structure intact.
Wave 5 targets align with Fib extensions: initial $290-293 (0.618 of Waves 1-3), standard $300-310 (1.0-1.618x). The parallel channel upper rail supports $305, fueled by AI tailwinds and upcoming Q1 earnings. Risk: Break below $270 channels a deeper pullback to $262, but VIX under 14 favors bulls.
Multi-month hold for longs above $275; add on triangle breakout with stops at $274. Structure remains bullish – Wave 5 could cap the year strong. What's your take?
Disclaimer: This analysis is for educational purposes only and is not investment advice. Please do your own research (DYOR) before making any trading decisions.
“Discussion is welcome. Respect all views — markets are dynamic.”
Declinazione di responsabilità
Le informazioni e le pubblicazioni non sono intese come, e non costituiscono, consulenza o raccomandazioni finanziarie, di investimento, di trading o di altro tipo fornite o approvate da TradingView. Per ulteriori informazioni, consultare i Termini di utilizzo.